Sex differences in anthropometric and
cephalometric characteristics in the severity of
obstructive sleep apnea syndrome
Hung-Huey Tsai,a
Ching-Yin Ho,b
Pei-Lin Lee,c
and Ching-Ting Tand Taipei, Taiwan
Introduction: Craniofacial anatomic abnormalities related to structural narrowing of the upper airway have
been reported in patients with obstructive sleep apnea syndrome (OSAS). The purpose of this study was to test whether there are sex differences in the relative contributions of specific anthropometric and cephalometric measurements of OSAS severity. Methods: The subjects were Taiwanese patients who visited the Ear, Nose, and Throat Department of National Taiwan University Hospital with complaints of snoring or sleep apnea. The anthropometric, cephalometric, and overnight polysomnographic records of 109 subjects were evaluated. Results: There are obvious sex differences in the craniofacial skeletal character-istics that contribute to OSAS severity. Male patients with the following risk factors are likely to have more severe type OSAS: increased neck size, inferiorly positioned hyoid bone, and greater anterior lower facial height. The risk factors related to the severity of OSAS in female patients include smaller posterior facial height and anteriorly positioned hyoid bone. Conclusions: To evaluate OSAS severity, different anthropo-metric and cephaloanthropo-metric measurements should be used for men and women. The craniofacial skeletal characteristics that contribute to OSAS severity were in the anterior lower portion of the profile in men and in the posterior portion of the profile in women. (Am J Orthod Dentofacial Orthop 2009;135:155-64)
S
leep-disordered breathing, characterized by re-peated episodes of hypopnea (underbreathing) and apnea (not breathing) during sleep, affects 24% of middle-aged white men in Wisconsin,1 14.4% of Chinese men in Hong Kong,2and 27% and 16% of middle-aged Korean men and women, re-spectively.3 Obstructive sleep apnea syndrome (OSAS) is a common form of sleep-disordered breathing that is characterized by repetitive episodes of partial or complete upper airway obstruction, causing sleep fragmentation and other symptoms.4 OSAS is equally common among middle-aged white and Hong Kong Chinese populations with a mini-mum prevalence of 4%.1,2Approximately 40% to 60% of OSAS patients seen in sleep laboratories have hypertension.5,6There is also an association of OSAS with heart failure,7ischemic heart disease,8stroke,9cardiac arrhythmia,10 and sud-den cardiac death.11 These findings clearly show that OSAS is a serious condition with major health-related consequences and that identification of patients with OSAS is important.
Although still under investigation, increased pha-ryngeal collapse during sleep has been postulated to contribute as a risk factor for OSAS.12,13 Craniofa-cial anatomic abnormalities related to structural nar-rowing of the upper airway have been reported in patients with OSAS.14-20
One overnight polysomnogram in a sleep labora-tory is an adequate measure and is accepted as the gold standard for diagnosis of OSAS. Although the diagnos-tic superiority of polysomnography is without question, it is regarded as both time consuming and expensive. OSAS is a progressive disease that evolves from snoring.21 This evolution moves along a spectrum of heavy snoring with intermittent apneic events, eventu-ally progressing to severe disease with respiratory failure in extreme cases. Early diagnosis of OSAS is important for minimizing neurocognitive, cardiac, be-havioral, and developmental complications as a result of the syndrome.22 Therefore, there is a need for a
a
Professor, College of Oral Medicine, Taipei Medical University, Taipei, Taiwan.
b
Associate professor, Department of Otolaryngology, Taipei Veterans General Hospital, Taipei, Taiwan.
c
Lecturer, Department of Internal Medicine, National Taiwan University Hospital and National Taiwan University College of Medicine, Taipei, Taiwan.
d
Assistant professor, Department of Otolaryngology, National Taiwan Univer-sity Hospital and National Taiwan UniverUniver-sity College of Medicine, Taipei, Taiwan.
Reprint requests to: Ching-Ting Tan, Department of Otolaryngology, National Taiwan University Hospital and National Taiwan University College of Medicine, No. 7 Chung-Shan South Rd, Taipei 100, Taiwan, ROC; e-mail,
Submitted, November 2006; revised and accepted, October 2008. 0889-5406/$36.00
Copyright © 2009 by the American Association of Orthodontists. doi:10.1016/j.ajodo.2008.10.001
simple, rapid, and effective diagnostic tool that can be used to differentiate patients with simple snoring from those with OSAS. Several methods exploiting ad-vanced technologies have been used to evaluate the anatomic characteristics of the upper airway and the craniofacial structures that might predict OSAS and determine the sites of obstruction.23-27 However, the traditional cephalometric method has been the most practical.14,15,18,19,28-32
Although OSAS is prevalent in both sexes, male predominance is clear.1,33The mechanism for the sex difference in OSAS prevalence is an area of intensive research. We hypothesized that the etiology and features of OSAS progression in women differ from those observed in men. This study was conducted to evaluate the potential sex differences in anthropo-metric and cephaloanthropo-metric variables that predict risks associated with OSAS severity.
MATERIAL AND METHODS
The subjects were Taiwanese patients who visited the Ear, Nose, and Throat Department of National Taiwan University Hospital with complaints of snoring or sleep apnea. Institutional review board approval for the study was obtained from National Taiwan Univer-sity Hospital, and all patients gave informed consent before entering the study.
All subjects had a full complement of permanent teeth (except for the third molars in some cases), no apparent craniofacial deformities, no history of orth-odontic treatment, no history of pharyngeal airway surgery, and clinically acceptable symmetry of the dental arches. Anthropometric, polysomnographic, and cephalometric records for 109 subjects (76 men, 33 women) were used.
Anthropometric variables included age; body mass index (BMI), calculated by dividing weight (kg) by height squared (m2); and neck size (cm), measured as the neck circumference at the level of the cricothyroid membrane.
The sleep functions of patients were evaluated from overnight polysomnography. Apnea was de-fined as cessation of breathing for at least 10 sec-onds. Hypopnea is a decreased effort to breathe of at least 50% less than the baseline and with at least a 4% decrease in oxygen saturation. The respiratory disturbance index (RDI) was calculated as the sum of total events (apnea and hypopnea) per hour ([apnea ⫹ hypopnea]/sleep time). A diagnosis of OSAS was based on the RDI. OSAS is considered to be an RDI value of more than 5 per hour. The men and women were divided into 4 groups according to their RDI
values. Subjects who snored but had an RDI less than 5 were grouped into the simple-snoring (Si-Sn) group. The severity of OSAS was stratified by the RDI, with mild (Mi-OSAS) considered 5 to 20 per hour, moderate (Mo-OSAS) 21 to 40 per hour, and severe (Se-OSAS) more than 40 per hour.
A standard cephalometric radiograph was ob-tained for each subject with the teeth in centric occlusion and the Frankfort horizontal plane parallel to the floor at the end of the expiration phase and without swallowing. All cephalometric landmarks were located and digitized by the same investigator (H.-H.T.), with customized software developed for the 2-dimensional morphologic analysis of the anat-omy. Definitions of landmarks, reference planes, and cephalometric angular and linear measurements are given in Figure 1. Errors in landmark identification and digitizing method were estimated by examining duplicate tracings of 20 randomly selected patients made 10 days after the originals. Reliability was fairly accurate, with paired t tests indicating no significant differences in the duplicate measure-Fig 1. Anatomic landmark points: 1, sella turcica (S); 2,
nasion (N); 3, porion (Po); 4, orbitale (Or); 5, posterior nasal spine (PNS); 6, anterior nasal spine (ANS); 7, Point A (A); 8, Point B (B); 9, incisal tip of the maxillary central incisor with the most anteriorly positioned crown (U1); 10, incisal tip of the mandibular central incisor with the most anteriorly positioned crown (L1); 11, gnathion (Gn); 12, menton (Me); 13, gonion (Go); 14, posterior gonion (GoP); 15, lower gonion (GoL); 16, basion (Ba); 17, articulare (Ar); 18, third vertebra (C3); 19, hyoidale (H).
ments. The reference points were digitized as coor-dinates by using customized software. The straight line passing through sella turcica and parallel to the Frankfort horizontal plane was designated the x-axis. The straight line vertical to the x-axis and passing at a right angle through sella was designated the y-axis. Mean values of the x and y coordinates of all reference points as well as means and standard deviations for all measurements were calculated to enable characterization of the sample groups. All measurements were adjusted for magnification fac-tors.
The Student t test for independent samples was used to compare the sexes. Intergroup mean differ-ences for each measurement were separately as-sessed by using analysis of variance (ANOVA), between the 4 groups of subjects. ANOVA was followed by the Dunnett multiple comparisons test. Stepwise regression analysis was used to determine which variables could be included in a regression model. This procedure is useful in isolating a subset of predictor variables that best explain variations in the dependent variable. All regression analyses were done separately for men and women to assess the relative contributions of the various factors to the RDI. To determine whether the variables identified by the regression model differentiated the 4 groups, a discriminant analysis was performed. This proce-dure develops a discriminant model that attempts to classify each observation into 1 of the 4 groups. All
statistical analyses were performed with the SPSS statistical software package (version 13.0, SPSS, Cary, NC), and a 5% level of significance (P⬍ 0.05) was used.
RESULTS
The numbers of men in the Si-Sn, Mi-OSAS, Mo-OSAS, and Se-OSAS groups were 14, 29, 20, and 13, respectively; the numbers of women were 9, 14, 10, and 0, respectively. Therefore the comparisons of the mean values between the sexes were shown only for the Si-Sn, Mi-OSAS, and Mo-OSAS groups.
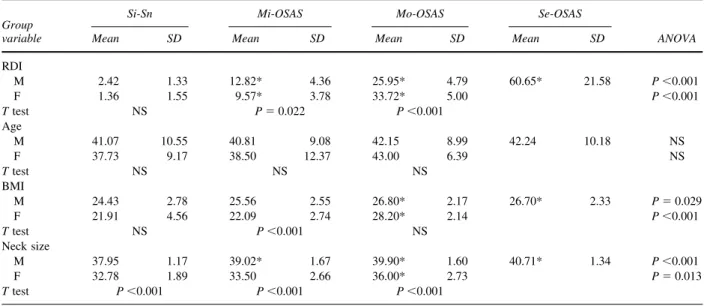
The anthropometric data are presented in Table I. Neck size and BMI statistically significantly increased with te severity of OSAS in both sexes. In comparisons with the Si-Sn group, the BMI in both sexes, and the neck size in women were significantly greater in the Mo-OSAS group. The neck sizes of the 3 OSAS groups in men were significantly greater than in the Si-Sn group. The neck sizes of men were significantly greater than those of the women in all groups.
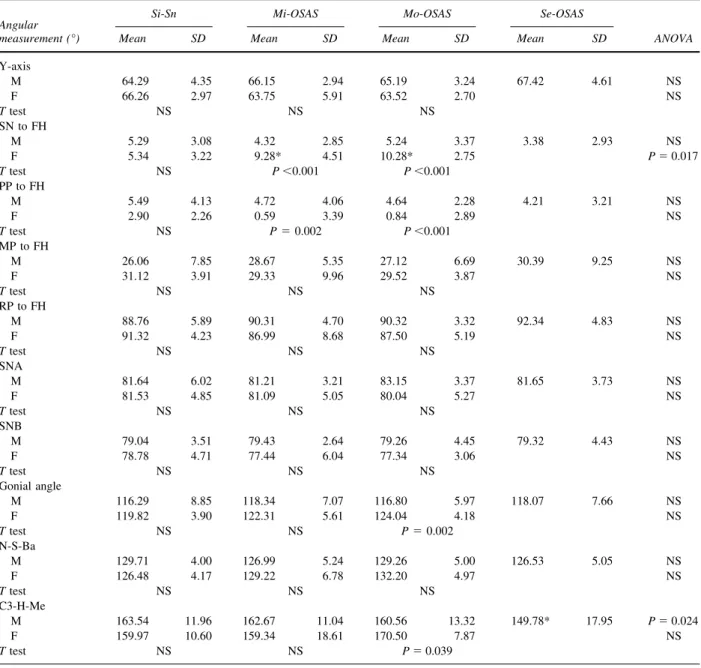
Comparisons of the mean values of cephalomet-ric measurements are shown inTables IIandIII. The angular measurement, SN to FH, in men statistically significantly increased with the severity of OSAS, whereas C3-H-Me in men decreased with the sever-ity of OSAS. There were no statistical differences in any angular measurements between the sexes in the Si-Sn group; however, with the severity of OSAS, SN to FH, the gonial angle, and C3-H-Me in women
Table I. Demographic and anthropometric data
Group variable
Si-Sn Mi-OSAS Mo-OSAS Se-OSAS
ANOVA
Mean SD Mean SD Mean SD Mean SD
RDI M 2.42 1.33 12.82* 4.36 25.95* 4.79 60.65* 21.58 P⬍0.001 F 1.36 1.55 9.57* 3.78 33.72* 5.00 P⬍0.001 T test NS P⫽ 0.022 P⬍0.001 Age M 41.07 10.55 40.81 9.08 42.15 8.99 42.24 10.18 NS F 37.73 9.17 38.50 12.37 43.00 6.39 NS T test NS NS NS BMI M 24.43 2.78 25.56 2.55 26.80* 2.17 26.70* 2.33 P⫽ 0.029 F 21.91 4.56 22.09 2.74 28.20* 2.14 P⬍0.001 T test NS P⬍0.001 NS Neck size M 37.95 1.17 39.02* 1.67 39.90* 1.60 40.71* 1.34 P⬍0.001 F 32.78 1.89 33.50 2.66 36.00* 2.73 P⫽ 0.013 T test P⬍0.001 P⬍0.001 P⬍0.001
M, Male; F, female; NS, not significant.
T test, comparison between male and female subjects. ANOVA, comparison between the Si-Sn and the treatment groups. *Statistically significant difference between the Si-Sn and the treatment groups.
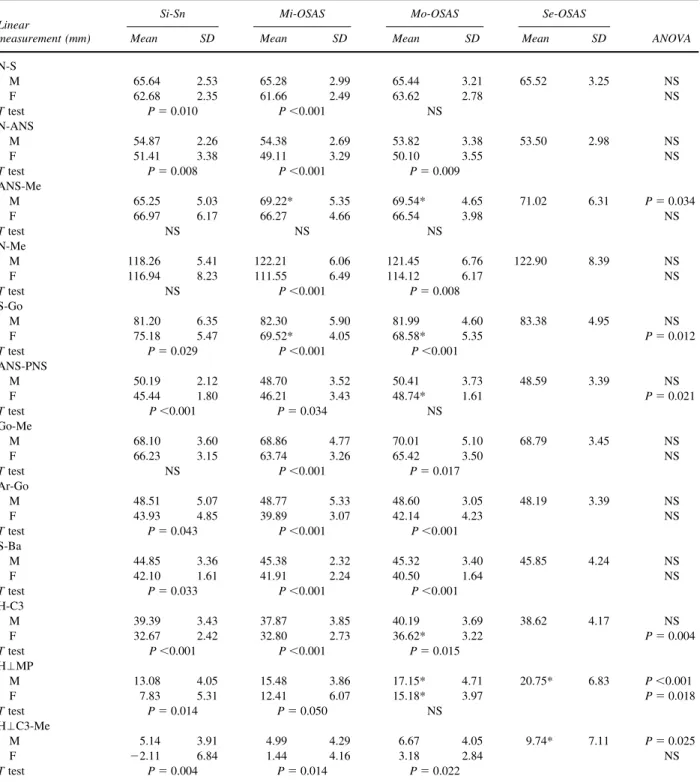
became greater than those measurements in men. There were some differences in linear measurements from the results of the ANOVA between the sexes; ANS-Me and H⬜C3-Me in men and ANS-PNS and H-C3 in women statistically significantly increased with the severity of OSAS, and S-Go in women statistically significantly decreased with the severity of OSAS. H⬜MP was the only linear measurement that statistically significantly increased with the se-verity of OSAS in both sexes.
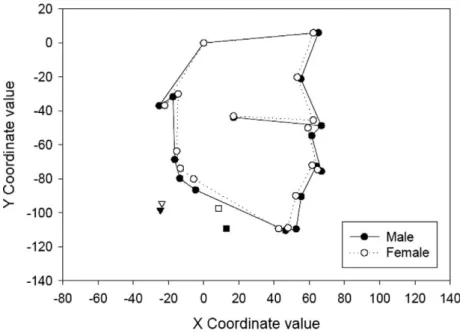
To compare craniofacial differences between the sexes in the Si-Sn and Mo-OSAS groups, between the Si-Sn and Se-OSAS groups in men, and between the Si-Sn and Mo-OSAS groups in women, the mean positions of each landmark were plotted, connected, and superimposed (Figs 2-5). These provide profile patterns that can readily be compared with and illustrate the relative overall differences between the 2 groups.
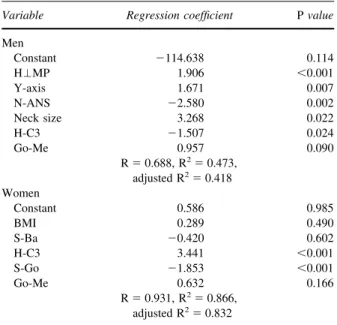
The results of the stepwise multiple regression analy-sis are shown inTable IVwith P values and regression
Table II. Comparison of means of cephalometric angular measurements
Angular measurement (°)
Si-Sn Mi-OSAS Mo-OSAS Se-OSAS
ANOVA
Mean SD Mean SD Mean SD Mean SD
Y-axis M 64.29 4.35 66.15 2.94 65.19 3.24 67.42 4.61 NS F 66.26 2.97 63.75 5.91 63.52 2.70 NS T test NS NS NS SN to FH M 5.29 3.08 4.32 2.85 5.24 3.37 3.38 2.93 NS F 5.34 3.22 9.28* 4.51 10.28* 2.75 P⫽ 0.017 T test NS P⬍0.001 P⬍0.001 PP to FH M 5.49 4.13 4.72 4.06 4.64 2.28 4.21 3.21 NS F 2.90 2.26 0.59 3.39 0.84 2.89 NS T test NS P⫽ 0.002 P⬍0.001 MP to FH M 26.06 7.85 28.67 5.35 27.12 6.69 30.39 9.25 NS F 31.12 3.91 29.33 9.96 29.52 3.87 NS T test NS NS NS RP to FH M 88.76 5.89 90.31 4.70 90.32 3.32 92.34 4.83 NS F 91.32 4.23 86.99 8.68 87.50 5.19 NS T test NS NS NS SNA M 81.64 6.02 81.21 3.21 83.15 3.37 81.65 3.73 NS F 81.53 4.85 81.09 5.05 80.04 5.27 NS T test NS NS NS SNB M 79.04 3.51 79.43 2.64 79.26 4.45 79.32 4.43 NS F 78.78 4.71 77.44 6.04 77.34 3.06 NS T test NS NS NS Gonial angle M 116.29 8.85 118.34 7.07 116.80 5.97 118.07 7.66 NS F 119.82 3.90 122.31 5.61 124.04 4.18 NS T test NS NS P⫽ 0.002 N-S-Ba M 129.71 4.00 126.99 5.24 129.26 5.00 126.53 5.05 NS F 126.48 4.17 129.22 6.78 132.20 4.97 NS T test NS NS NS C3-H-Me M 163.54 11.96 162.67 11.04 160.56 13.32 149.78* 17.95 P⫽ 0.024 F 159.97 10.60 159.34 18.61 170.50 7.87 NS T test NS NS P⫽ 0.039
M, Male; F, female; NS, not significant.
T test, comparison between male and female subjects. ANOVA, comparison between the Si-Sn and the treatment groups. *Statistically significant difference between the Si-Sn and the treatment groups.
coefficients. The variables entered into the model were H⬜MP, y-axis, N-ANS, neck size, H-C3, and Go-Me in men, and BMI, S-Ba, H-C3, S-Go, and Go-Me in women. R2 values for these variables were 0.688 for men and
0.931 for women. In the discriminant analysis between the 4 groups (3 groups of women) for all cases, about 60% of the men and more than 85% of the women were correctly classified (Table V).
Table III. Comparison of means of cephalometric linear measurements
Linear
measurement (mm)
Si-Sn Mi-OSAS Mo-OSAS Se-OSAS
ANOVA
Mean SD Mean SD Mean SD Mean SD
N-S M 65.64 2.53 65.28 2.99 65.44 3.21 65.52 3.25 NS F 62.68 2.35 61.66 2.49 63.62 2.78 NS T test P⫽ 0.010 P⬍0.001 NS N-ANS M 54.87 2.26 54.38 2.69 53.82 3.38 53.50 2.98 NS F 51.41 3.38 49.11 3.29 50.10 3.55 NS T test P⫽ 0.008 P⬍0.001 P⫽ 0.009 ANS-Me M 65.25 5.03 69.22* 5.35 69.54* 4.65 71.02 6.31 P⫽ 0.034 F 66.97 6.17 66.27 4.66 66.54 3.98 NS T test NS NS NS N-Me M 118.26 5.41 122.21 6.06 121.45 6.76 122.90 8.39 NS F 116.94 8.23 111.55 6.49 114.12 6.17 NS T test NS P⬍0.001 P⫽ 0.008 S-Go M 81.20 6.35 82.30 5.90 81.99 4.60 83.38 4.95 NS F 75.18 5.47 69.52* 4.05 68.58* 5.35 P⫽ 0.012 T test P⫽ 0.029 P⬍0.001 P⬍0.001 ANS-PNS M 50.19 2.12 48.70 3.52 50.41 3.73 48.59 3.39 NS F 45.44 1.80 46.21 3.43 48.74* 1.61 P⫽ 0.021 T test P⬍0.001 P⫽ 0.034 NS Go-Me M 68.10 3.60 68.86 4.77 70.01 5.10 68.79 3.45 NS F 66.23 3.15 63.74 3.26 65.42 3.50 NS T test NS P⬍0.001 P⫽ 0.017 Ar-Go M 48.51 5.07 48.77 5.33 48.60 3.05 48.19 3.39 NS F 43.93 4.85 39.89 3.07 42.14 4.23 NS T test P⫽ 0.043 P⬍0.001 P⬍0.001 S-Ba M 44.85 3.36 45.38 2.32 45.32 3.40 45.85 4.24 NS F 42.10 1.61 41.91 2.24 40.50 1.64 NS T test P⫽ 0.033 P⬍0.001 P⬍0.001 H-C3 M 39.39 3.43 37.87 3.85 40.19 3.69 38.62 4.17 NS F 32.67 2.42 32.80 2.73 36.62* 3.22 P⫽ 0.004 T test P⬍0.001 P⬍0.001 P⫽ 0.015 H⬜MP M 13.08 4.05 15.48 3.86 17.15* 4.71 20.75* 6.83 P⬍0.001 F 7.83 5.31 12.41 6.07 15.18* 3.97 P⫽ 0.018 T test P⫽ 0.014 P⫽ 0.050 NS H⬜C3-Me M 5.14 3.91 4.99 4.29 6.67 4.05 9.74* 7.11 P⫽ 0.025 F ⫺2.11 6.84 1.44 4.16 3.18 2.84 NS T test P⫽ 0.004 P⫽ 0.014 P⫽ 0.022
M, Male; F, female; NS, not significant.
T test, comparison between male and female subjects. ANOVA, comparison between the Si-Sn and the treatment groups. *Statistically significant difference between the Si-Sn and the treatment groups.
DISCUSSION
Although the RDI value of the women was signif-icantly smaller than that of the men in the Mi-OSAS group and no woman was in the Se-OSAS group, the RDI value of the women was significantly greater than that of the men in the Mo-OSAS group. It was supposed that there might be sex differences in the progression of OSAS in a Taiwanese population.
There were no significant differences in mean ages among the groups for either sex or between⬎men and women for the Si-Sn, Mi-OSAS, Mo-OSAS groups. It is thought that there are no sex differences in age for the likelihood of having OSAS.
Obesity has been thought to be a primary cause of OSAS. Obesity might be related to OSAS because of excessive soft tissue in the upper airway. Our study also Fig 2. Craniofacial differences between the sexes in the Si-Sn group.
demonstrated that BMI and neck size statistically sig-nificantly increased with the severity of OSAS in both sexes. Male and female subjects differed in that the men in the Mi-OSAS group had a larger neck size. Ryan and Love34 showed that obese patients with large necks tend to have a more easily collapsible velopharynx during wakefulness. The airway has a tendency to collapse from negative pressure
associ-ated with inspiration and airflow. The muscle tone of the palate, pharynx, and tongue help to balance the patency. Mass loading on the airway can produce changes in the airway configuration and its function. Cervical fat can produce a gravitational loading effect on the airway, especially when patients are supine. Obesity, through fat deposits around the upper airway in the neck, might narrow the pharynx and alter its Fig 4. Craniofacial differences between the Si-Sn and Se-OSAS groups in men.
shape and mechanical properties, predisposing patients to sleep-related obstruction. Our results indicated that large BMI and neck size, especially in men, are risk factors associated with OSAS severity.
Certain forms of craniofacial anatomic defects, including inferior displacement of the hyoid bone, larger gonial angle, smaller anterior cranial base, altered anterior and posterior facial heights, and mandibular deficiency, have been suggested as pre-disposing factors for upper airway obstruction during sleep.28,35-39 It was shown that the hyoid bone positions relative to the mandible and the third vertebrae were different between men and women in the Si-Sn group. The distances from the hyoid bone to the third vertebrae and to the mandible in men were both statistically significantly greater (anteri-orly and inferi(anteri-orly) than those in women. Although
both female and male OSAS subjects had an inferi-orly positioned hyoid bone compared with Si-Sn subjects, the changes of the hyoid bone positions as OSAS becomes severe were different between men and women. The position of the hyoid bone becomes more inferior as the condition becomes more severe, from Si-Sn to Se-OSAS, especially in men. In female patients, the position of the hyoid bone becomes more anterior as the OSAS condition becomes more severe.
The lingual musculature plays a strategic role in maintaining upper airway patency and is, moreover, anchored to the hyoid bone.40,41 An inferiorly posi-tioned hyoid bone can be due to macroglossia, diffuse fat depositions, or relaxation of the lingual musculature. These conditions might cause the man-dibular opening, making the gonial angle increase and altering anteroposterior facial height ratios. Therefore, an inferiorly positioned hyoid bone can impair upper airway patency because of involvement of the lingual musculature.
In addition to an inferiorly positioned hyoid bone, greater lower facial height was also related to an overall increase in OSAS severity in men, whereas larger SN to FH angle, smaller posterior facial height, and anteriorly positioned hyoid bone were related to an overall in-crease in OSAS severity in women. Based on results of the regression analysis, the following anthropometric and cephalometric characteristics are most likely to be expected in patients with severe OSAS: increased neck size and inferiorly positioned hyoid bone in both sexes, larger y-axis in men, and smaller posterior facial height and anteriorly positioned hyoid bone in women. From superimposition of the profiles of the Si-Sn and OSAS groups, it is clear that the major differences between these groups were in the anterior lower portion in men (inferiorly positioned chin and hyoid bone) and in the posterior portion in women (smaller posterior facial height). A larger y-axis implies more downward man-dibular growth and is related to greater lower facial height. A smaller posterior facial height implies man-dibular ramus deficiency and is related to a larger gonial angle and altered anterior and posterior facial heights.
Table IV shows that H-C3 (the distance from the third vertebra to the hyoid bone) had a negative correlation with the RDI in men and a positive corre-lation with the RDI in women. Previous studies showed that, although the hyoid bone position is associated with head posture, there is a regular pattern of down-ward and slightly anterior descent of the hyoid through-out the growth period.42,43The role of the hyoid bone in the evolution of OSAS might differ between the
Table IV. Stepwise multiple regression analysis
Variable Regression coefficient P value
Men Constant ⫺114.638 0.114 H⬜MP 1.906 ⬍0.001 Y-axis 1.671 0.007 N-ANS ⫺2.580 0.002 Neck size 3.268 0.022 H-C3 ⫺1.507 0.024 Go-Me 0.957 0.090 R⫽ 0.688, R2⫽ 0.473, adjusted R2⫽ 0.418 Women Constant 0.586 0.985 BMI 0.289 0.490 S-Ba ⫺0.420 0.602 H-C3 3.441 ⬍0.001 S-Go ⫺1.853 ⬍0.001 Go-Me 0.632 0.166 R⫽ 0.931, R2⫽ 0.866, adjusted R2⫽ 0.832
Table V. Discriminant analysis (data are numbers of patients)
Original group
classification n
Discriminant analysis classification (%)
Si-Sn Mi-OSAS Mo-OSAS Se-OSAS
Men Si-Sn 14 11 (78.6) 3 (21.4) 0 (0) 0 (0) Mi-OSAS 29 6 (20.7) 15 (51.7) 5 (17.3) 3 (10.3) Mo-OSAS 20 1 (5.0) 4 (25.0) 11 (55.0) 3 (15.0) Se-OSAS 13 0 (0) 1 (7.7) 2 (15.4) 10 (76.9) Women Si-Sn 9 7 (77.8) 2 (22.2) 0 (0) Mi-OSAS 14 2 (14.3) 12 (85.7) 0 (0) Mo-OSAS 10 0 (0) 0 (0) 10 (100)
sexes. Further investigation in this area could help to clarify these issues.
CONCLUSIONS
There are obvious sex differences in the cranio-facial skeletal characteristics that contribute to OSAS severity and, to evaluate OSAS severity, different anthropometric and cephalometric measure-ments should be used for men and women.
REFERENCES
1. Young T, Palta M, Dempsey J, Skatrud J, Weber S, Badr S. The occurrence of sleep-disordered breathing among middle-aged adults. N Engl J Med 1993;328:1230-5.
2. Hui DS, Chan JK, Ko FW, Choy DK, Li TS, Chan AT, et al. Prevalence of snoring and sleep-disordered breathing in a group of commercial bus drivers in Hong Kong. Intern Med J 2002; 32:149-57.
3. Kim J, In K, Kim J, You S, Kang K, Shim J, et al. Prevalence of sleep-disordered breathing in middle-aged Korean men and women. Am J Respir Crit Care Med 2004;170:1108-13. 4. McNamara SG, Grunstein RR, Sullivan CE. Obstructive sleep
apnoea. Thorax 1993;48:754-64.
5. Millman RP, Redline S, Carlisle CC, Assaf AR, Levinson PD. Daytime hypertension in obstructive sleep apnea. Prevalence and contributing risk factors. Chest 1991;99:861-6.
6. Fletcher EC. The relationship between systemic hypertension and obstructive sleep apnea: facts and theory. Am J Med 1995;98:118-28.
7. Tkacova R, Rankin F, Fitzgerald FS, Floras JS, Bradley TD. Effects of continuous positive airway pressure on obstructive sleep apnea and left ventricular afterload in patients with heart failure. Circulation 1998;98:2269-75.
8. Mooe T, Rabben T, Wiklund U, Franklin KA, Eriksson P. Sleep-disordered breathing in men with coronary artery disease. Chest 1996;109:659-63.
9. Dyken ME, Somers VK, Yamada T, Ren ZY, Zimmerman MB. Investigating the relationship between stroke and obstructive sleep apnea. Stroke 1996;27:401-7.
10. Guilleminault C, Connolly SJ, Winkle RA. Cardiac arrhythmia and conduction disturbances during sleep in 400 patients with sleep apnea syndrome. Am J Cardiol 1983;52:490-4.
11. Bliwise DL, Bliwise NG, Partinen M, Pursley AM, Dement WC. Sleep apnea and mortality in an aged cohort. Am J Public Health 1988;78:544-7.
12. Phillipson EA. Sleep apnea—a major public health problem. N Engl J Med 1993;328:1271-3.
13. Strohl KP, Cherniack NS, Gothe B. Physiologic basis of therapy for sleep apnea. Am Rev Respir Dis 1986;134:791-802. 14. Strelzow VV, Blanks RH, Basile A, Strelzow AE. Cephalometric
airway analysis in obstructive sleep apnea syndrome. Laryngo-scope 1988;98:1149-58.
15. deBerry-Borowiecki B, Kukwa A, Blanks RH. Cephalometric analysis for diagnosis and treatment of obstructive sleep apnea. Laryngoscope 1988;98:226-34.
16. Lyberg T, Krogstad O, Djupesland G. Cephalometric analysis in patients with obstructive sleep apnoea syndrome. I. Skeletal morphology. J Laryngol Otol 1989;103:287-92.
17. Riley R, Guilleminault C, Herran J, Powell N. Cephalometric analyses and flow-volume loops in obstructive sleep apnea patients. Sleep 1983;6:303-11.
18. Guilleminault C, Riley R, Powell N. Obstructive sleep apnea and abnormal cephalometric measurements. Implications for treat-ment. Chest 1984;86:793-4.
19. Partinen M, Guilleminault C, Quera-Salva MA, Jamieson A. Obstructive sleep apnea and cephalometric roentgenograms. The role of anatomic upper airway abnormalities in the definition of abnormal breathing during sleep. Chest 1988;93: 1199-205.
20. Lyberg T, Krogstad O, Djupesland G. Cephalometric analysis in patients with obstructive sleep apnoea syndrome: II. Soft tissue morphology. J Laryngol Otol 1989;103:293-7.
21. Lugaresi E, Cirignotta F, Gerardi R, Montagna P. Snoring and sleep apnoea: natural history of heavy snorers disease. In: Guilleminault C, Partinen M, editors. Obstructive sleep apnea syndrome: clinical research and treatment. New York: Raven Press; 1990. p. 25-36.
22. Yantis MA. Assessing children for obstructive sleep apnea. J Pediatr Health Care 1999;13(3 Pt 1):99-104.
23. Crumley RL, Stein M, Gamsu G, Golden J, Dermon S. Deter-mination of obstructive site in obstructive sleep apnea. Laryngo-scope 1987;97(3 Pt 1):301-8.
24. Haponik EF, Smith PL, Bohlman ME, Allen RP, Goldman SM, Bleecker ER. Computerized tomography in obstructive sleep apnea. Correlation of airway size with physiology during sleep and wakefulness. Am Rev Respir Dis 1983;127: 221-6.
25. Polo O, Tafti M, Fraga J, Billiard M. Pharyngeal CT studies in patients with mild or severe upper airway obstruction during sleep. Sleep 1993;16(8 Suppl):152-5.
26. Schwab RJ, Gupta KB, Gefter WB, Metzger LJ, Hoffman EA, Pack AI. Upper airway and soft tissue anatomy in normal subjects and patients with sleep-disordered breathing. Signifi-cance of the lateral pharyngeal walls. Am J Respir Crit Care Med 1995;152(5 Pt 1):1673-89.
27. Shepard JW Jr, Thawley SE. Localization of upper airway collapse during sleep in patients with obstructive sleep apnea. Am Rev Respir Dis 1990;141(5 Pt 1):1350-5.
28. Lowe AA, Santamaria JD, Fleetham JA, Price C. Facial mor-phology and obstructive sleep apnea. Am J Orthod Dentofacial Orthop 1986;90:484-91.
29. Lowe AA, Ono T, Ferguson KA, Pae EK, Ryan CF, Fleetham JA. Cephalometric comparisons of craniofacial and upper airway structure by skeletal subtype and gender in patients with obstruc-tive sleep apnea. Am J Orthod Dentofacial Orthop 1996; 110:653-64.
30. Pae EK, Lowe AA, Sasaki K, Price C, Tsuchiya M, Fleetham JA. A cephalometric and electromyographic study of upper airway structures in the upright and supine positions. Am J Orthod Dentofacial Orthop 1994;106:52-9.
31. Tangugsorn V, Skatvedt O, Krogstad O, Lyberg T. Obstructive sleep apnoea: a cephalometric study. Part I. Cervico-craniofacial skeletal morphology. Eur J Orthod 1995;17:45-56.
32. Tangugsorn V, Skatvedt O, Krogstad O, Lyberg T. Obstructive sleep apnoea: a cephalometric study. Part II. Uvulo-glossopha-ryngeal morphology. Eur J Orthod 1995;17:57-67.
33. Redline S, Kump K, Tishler PV, Browner I, Ferrette V. Gender differences in sleep disordered breathing in a commu-nity-based sample. Am J Respir Crit Care Med 1994;149(3 Pt 1):722-6.
34. Ryan CF, Love LL. Mechanical properties of the velopharynx in obese patients with obstructive sleep apnea. Am J Respir Crit Care Med 1996;154(3 Pt 1):806-12.
35. Isono S, Remmers JE, Tanaka A, Sho Y, Nishino T. Static properties of the passive pharynx in sleep apnea. Sleep 1996; 19(10 Suppl):175-7.
36. Croft CB, Pringle M. Sleep nasendoscopy: a technique of assessment in snoring and obstructive sleep apnoea. Clin Oto-laryngol Allied Sci 1991;16:504-9.
37. Nelson S, Hans M. Contribution of craniofacial risk factors in increasing apneic activity among obese and nonobese habitual snorers. Chest 1997;111:154-62.
38. Zucconi M, Ferini-Strambi L, Palazzi S, Orena C, Zonta S, Smirne S. Habitual snoring with and without obstructive sleep apnoea: the importance of cephalometric variables. Thorax 1992;47:157-61.
39. Andersson L, Brattstrom V. Cephalometric analysis of perma-nently snoring patients with and without obstructive sleep apnea syndrome. Int J Oral Maxillofac Surg 1991;20:159-62. 40. Remmers JE, deGroot WJ, Sauerland EK, Anch AM.
Pathogen-esis of upper airway occlusion during sleep. J Appl Physiol 1978;44:931-8.
41. Schwartz AR, Eisele DW, Hari A, Testerman R, Erickson D, Smith PL. Electrical stimulation of the lingual musculature in obstructive sleep apnea. J Appl Physiol 1996;81:643-52. 42. Bibby RE, Preston CB. The hyoid triangle. Am J Orthod
1981;80:92-7.
43. Rocabado M. Biomechanical relationship of the cranial, cervical, and hyoid regions. J Craniomandibular Pract 1983;1:61-6.