Journal of Chromatography A, 1209 (2008) 253–259
Contents lists available atScienceDirect
Journal of Chromatography A
j o u r n a l h o m e p a g e : w w w . e l s e v i e r . c o m / l o c a t e / c h r o m aUsing cation-selective exhaustive injection and sweeping micellar electrokinetic
chromatography to determine selective serotonin reuptake inhibitors
Hsiu-Li Su, You-Zung Hsieh
∗Department of Applied Chemistry, National Chiao Tung University, 1001 Ta Hsueh Road, Hsinchu 300, Taiwan
a r t i c l e i n f o
Article history: Received 21 April 2008
Received in revised form 22 August 2008 Accepted 26 August 2008
Available online 29 August 2008 Keywords:
CSEI–sweeping-MEKC
Selective serotonin reuptake inhibitor On-line preconcentration
Antidepressant drug MEKC
a b s t r a c t
We have employed a rapid and highly efficient on-line preconcentration method, cation-selective exhaus-tive injection and sweeping micellar electrokinetic chromatography (CSEI–sweeping-MEKC), for the analysis of selective serotonin reuptake inhibitors (SSRIs) of antidepressant drugs. We monitored the effects of several of the CSEI–sweeping-MEKC parameters – including the pH, the concentrations of high-conductivity buffer (HCB), sodium dodecyl sulfate (SDS), and organic modifier, the injection length of the HCB, and the injection time of the sample – to optimize the separation process. The optimal background electrolyte was 50 mM citric acid/disodium hydrogenphosphate buffer (pH 2.2) containing 100 mM SDS and 22% isopropyl alcohol. The sensitivity enhancements of the SSRIs sertraline, fluoxetine, paroxetine, flu-voxamine, and citalopram ranged from 5.7× 10⁴to 1.2× 10⁵; the coefficients of determination exceeded 0.9938 and the relative standard deviations of the peak heights were less than 3.2%; the detection lim-its ranged from 0.056 to 0.22 ng/mL. We employed the optimal conditions to analyze these five SSRIs in a plasma sample prepared using solid-phase extraction (SPE) to minimize the influence of the matrix. Although the limits of detection of the SSRIs in human plasma were higher than those in pure water, this present technique is more sensitive than other, more-conventional methods. The recovery of the SPE extraction efficiency was satisfactory (up to 89%). Our findings suggest that, under the optimal condi-tions, the CSEI–sweeping-MEKC method can be used successfully to determine these five SSRIs in human plasma.
© 2008 Elsevier B.V. All rights reserved.
1. Introduction
Selective serotonin reuptake inhibitors (SSRIs) are second-generation antidepressant drugs used for the treatment of depression [1]. They are often employed as first-line therapeu-tic drugs in place of traditional tricyclic antidepressants. Because of their minimal side effects and low toxicity, SSRIs are gener-ally tolerated well by patients suffering from depression or related conditions. Among the family of SSRIs, fluoxetine (Prozac) is the most widely consumed SSRI drug in the United States, followed by sertraline (Zoloft), paroxetine (Paxile), fluvoxamine (Luvox), and citalopram (Celexa). The mechanism of action of the SSRIs is blockage of serotonin reuptake at the presynaptic nerve termi-nal. Unfortunately, these drugs have several unwanted side effects, including sexual dysfunction, gastrointestinal effects, and disrup-tion of the central nervous system[2]; when the concentration of SSRIs in the blood is too high, acute symptoms or intoxication might occur. Hence, there is great interest in the development of
∗ Corresponding author. Tel.: +886 3 5731785; fax: +886 3 5723764. E-mail address:[email protected](Y.-Z. Hsieh).
a simple, rapid method for monitoring the concentrations of these therapeutic drugs in patients.
Several methods have been published for the analysis of SSRIs in plasma and urine, including gas chromatographic separation with mass spectrometric detection (GC/MS)[3]and high-performance liquid chromatographic (HPLC) separation with UV[4,5], fluores-cence spectroscopic [6], and mass spectrometric [7] detection. A CE-based technique – employing micellar electrokinetic chro-matography (MEKC), UV detection, and a buffer containing sodium dodecyl sulfate (SDS) and an organic modifier – has also been devel-oped for the successful separation of commercial antidepressants [8,9]. Because biological materials can interfere with the detection of the analytes of interest, biological fluids, such as plasma or urine, are usually pretreated through liquid–liquid extraction[8,10]or solid-phase extraction (SPE)[11].
Despite the development of this range of separation tech-niques, each has unattractive characteristics that hinder its application—e.g., consumption of a large amount of organic solvent (LC), complicated derivation steps (fluorescence detection), poor sensitivity (UV detection), or expensive equipment (mass spectro-metric detection). Quirino and Terabe were the first to develop on-line preconcentration techniques for CE analyses; since then, 0021-9673/$ – see front matter © 2008 Elsevier B.V. All rights reserved.
Fig. 1. Molecular structures of the five SSRIs.
the application of sweeping-MEKC[12,13], anion-selective exhaus-tive injection (ASEI)–sweeping-MEKC[14,15], and cation-selective exhaustive injection (CSEI)–sweeping-MEKC[16,17]has expanded into several fields. Because these methods are simple to use, pro-vide high sensitivity, and do not require additional equipment, they have found widespread use. An appropriate preconcentra-tion technique can be selected based on the analyte’s properties. If sweeping-MEKC concentration is employed, the detection limit can be improved by ca. 10–1000-fold[18]; if, however, sweeping-MEKC is coupled with selective electrokinetic injection, the sensitivity can be enhanced by up to a million-fold[19]. Among the many on-line preconcentration methods, one of the best preconcentration effi-ciencies is provided by the CSEI–sweeping-MEKC technique—used for the detection of cationic analytes—performed in conjunction with selective electrokinetic injection, followed by the addition of surfactants to effect the sweeping process. The CSEI–sweeping-MEKC technique has been applied, for example, to the analysis of lysergic acid diethylamide (LSD) in mouse blood[20], ephedra alkaloids in dilute herb extracts and mouse sera[21], and metham-phetamine, ketamine, morphine, and codeine in human urine[22]. Those studies have indicated the practicality of the method in terms of the linear relationship of the quantitative data, the reproducibil-ity of the measurements, and the application to real samples.
In this study, we used CSEI–sweeping-MEKC to improve the detection limit and enhance the sensitivity of the determination of five SSRI antidepressant drugs: fluoxetine, sertraline, paroxetine, fluvoxamine, and citalopram (Fig. 1). We optimized several separa-tion and sensitivity enhancement parameters, including the pH, the concentrations of surfactant, buffer, and organic modifier, the injec-tion length of the high-conductivity buffer (HCB), and the injecinjec-tion time of the sample. We also compared the sensitivity enhance-ments using CSEI–sweeping-MEKC and sweeping techniques. In addition, we applied the developed method to analyze the five SSRIs in human plasma samples. Using SPE, a simple technique for sam-ple preparation, we decreased both the degree of interference and the matrix effect.
2. Experimental
2.1. Chemicals
All of the reagents and chemicals were of analytical grade. Ser-traline, fluoxetine, paroxetine, fluvoxamine, citalopram, and SDS were obtained from Sigma (St. Louis, MO, USA). Disodium hydro-genphosphate (Na2HPO4) and sodium hydroxide (NaOH) were
purchased from Fluka (Buchs, Switzerland). Citric acid and acetoni-trile were obtained from Merck (Darmstadt, Germany). Methanol, isopropyl alcohol (IPA), acetic acid, and ammonium hydroxide were obtained from Aldrich (St. Louis, MO, USA). Water was purified through a Milli-Q water system (Millipore, Milford, MA, USA). The blank human plasma samples were obtained through donation.
2.2. Apparatus
A Beckman P/ACE MDQ CE system (Fullerton, CA, USA) was used to effect the separations. A diode-array detector was employed for detection. Separations were performed in a 60 cm (50 cm effective length)× 50 m i.d. fused-silica capillary tube (Polymicro Tech-nologies, Phoenix, AZ, USA). The capillary tube was assembled in the cartridge format. A personal computer using 32 Karat soft-ware controlled the P/ACE instrument and allowed data analysis. The conductivity of the samples was measured using a cond 340i conductivity meter (WTW, Weilheim, Germany). The human blood samples were centrifuged using a Hettich EBA21 appara-tus (Tuttlingen, Germany). Prior to use, the separation capillary was preconditioned sequentially with methanol (10 min), 1 M HCl (10 min), deionized water (2 min), 1 M NaOH (10 min), and deion-ized water (2 min). Stock solutions of 0.2 M citric acid and 0.4 M disodium hydrogenphosphate were first prepared. Different buffer solutions were prepared by mixing suitable amounts of the stock solutions with water to obtain a specified concentration and pH. Under typical conditions, the non-micellar background electrolyte (BGE) consisted of 100 mM citric acid/disodium
hydrogenphos-H.-L. Su, Y.-Z. Hsieh / J. Chromatogr. A 1209 (2008) 253–259 255 phate (pH 2.2) containing 22% IPA. The HCB solution was 100 mM
citric acid/disodium hydrogenphosphate (pH 2.2). The micellar BGE comprised 100 mM SDS in 50 mM citric acid/disodium hydrogen-phosphate (pH 2.2) containing 22% IPA. Between runs, the capillary was flushed sequentially with methanol (3 min), water (7 min), and non-micellar BGE (5 min) in the CSEI–sweeping-MEKC mode or with micellar BGE (5 min) in the sweeping-MEKC and MEKC modes.
2.3. Preparing standards and plasma samples
Stock standard solutions (1 mg/mL) of the five SSRIs were pre-pared in methanol and stored prior to use. Prior to analysis in the CSEI–sweeping-MEKC mode, the stock solution was diluted to 1g/mL using 250 M citric acid/disodium hydrogenphosphate buffer (pH 2.2) as the standard dilution solution. The working stan-dard was then diluted with pure water to the desired concentration. For analyses in the sweeping-MEKC mode, the sample was diluted with non-micellar BGE buffer to provide the same conductivity as the background solution. In the MEKC mode, the sample was diluted with pure water alone to prevent concentration errors aris-ing from vaporization of the organic solvent. The human plasma samples were collected through centrifugation of the blood sam-ples at 10,000 rpm for 20 min and then they were frozen; when required for an assay, they were thawed and warmed to room tem-perature.
2.4. Method procedures
The column used was a bare fused-silica capillary that was con-ditioned initially using a low-pH electrolyte. The electroosmotic flow was suppressed by the low pH (pH 2.2). In the MEKC procedure, samples were pressure-injected at 3.45 kPa for 3 s. The detection wavelength was set at 203 nm. The separation proceeded with the micellar BGE (containing 30% IPA) and a negative applied poten-tial (−20 kV). In the sweeping-MEKC procedure, samples were pressure-injected at 0.5 psi for 120 s. The capillary was filled with micellar BGE (containing 22% IPA) and a negative voltage (−20 kV) was applied. When the anionic micelles entered the sample zone, sweeping and separation were achieved through MEKC. In the CSEI–sweeping-MEKC procedure, the capillary was conditioned with a non-micellar BGE (containing 0–30% IPA) and then the HCB solution was injected hydrodynamically at 20.7 kPa for 0.5–2 min, followed by a sample of low conductivity (pure water) injected elec-trokinetically at 15 kV for 300–1200 s. Finally, the inlet and outlet capillary were placed in the micellar BGE and a negative voltage (−20 kV) was applied to effect separation.
2.5. Solid-phase extraction
Oasis HLB column-type cartridges for SPE were obtained from Waters (Milford, MA, USA). The cartridges (3 mL/60 mg) were first conditioned with methanol (2 mL) and H2O (2 mL). The loading
sample (0.5 mL) comprised human plasma (100L), the five SSRIs (1g/mL, 100 L), and 1 mM phosphate buffer (pH 7.4, 300 L). The column was washed with 30% methanol (2 mL) and then with a solution consisting of 70% methanol and 2% ammonium hydrox-ide (2 mL). The elution solution comprised 70% methanol and 2% acetic acid (0.5 mL); it was dried under a stream of nitrogen gas while heating at 40◦C. For assaying, the residue was dissolved in pure water until the conductivity of the sample solution achieved a level of ca. 60S/cm.
2.6. Calibration curves
Two kinds of calibration curves were set up: one for the five standards in pure water and the other after spiking the standards
into a blank plasma sample for treatment with SPE to imitate a real sample. The first calibration curve was obtained after prepar-ing solutions of the standards individually at 0.5, 2.0, 3.0, 5.0, and 7.5 ng/mL in low-conductivity (pure) water. For the spiked cali-bration curve, the drug-free plasma sample was subjected to SPE pretreatment and then the low-conductivity (ca. 60S/cm) matrix of the sample was spiked into standards at concentrations of 2.5, 4.0, 5.5, 7.0, and 8.5 ng/mL. The narrow linear range was selected from a consideration of the separation resolution effect to provide reliable quantitative data.
3. Results and discussion
3.1. Optimizing separation conditions for CSEI–sweeping-MEKC
To obtain the largest increase in sensitivity, we considered the effects of several parameters of the CSEI–sweeping-MEKC method, including the pH, the concentrations of the organic modifier, the HCB, and SDS, the injection length of the HCB, and the injection time of the sample, and the nature of the matrix. Our attempts to optimize each of these conditions are described in detail below.
3.1.1. Optimizing the pH
We tested the effect of the buffer at pH 2.2, 3.0, and 4.0 while maintaining the buffer composition at 50 mM citric acid/disodium hydrogenphosphate, 100 mM SDS, and 22% IPA. The results revealed that increasing the pH resulted in decreasing resolution. In this CSEI–sweeping-MEKC method, the separation was performed in the reverse-polarity mode. The direction of the EOF was opposite to that of the negatively charged micelles (SDS). The results were satisfactory at pH 2.2, but the baseline became unstable and the analytes did not achieve baseline separation at either pH 3.0 or 4.0. Hence, for subsequent experiments, we chose a separation buffer having a pH of 2.2.
3.1.2. Optimizing the IPA concentration
Fig. 2indicates that the effect of the organic solvent was an important factor influencing the separation efficiency. The use of typical organic solvents, such as methanol and acetonitrile, did not appear to improve the separation. In the absence of IPA in the buffer, the five analytes migrated together and could not be identified indi-vidually. The optimal resolution occurred after adding 22% IPA to the buffer. Further increases in the content of IPA did not improve the resolution of sertraline and fluoxetine, but caused the analysis time to increase to 65 min. Therefore, for subsequent experiments we used 22% IPA as the organic modifier in the separation buffer.
3.1.3. Optimizing the HCB concentration
Maintaining the HCB injection at 20.7 kPa for 1 min and varying the HCB concentration had a dramatic influence on the behavior of the focusing effect. The HCB was used to form a wall, thereby reduc-ing the cationic analytes’ velocities and resultreduc-ing in the cations stacking in a narrow zone. This phenomenon meant that electroki-netic injection could be used to increase the intensity of the signal through sample stacking. When we increased the HCB concentra-tion from 50 to 150 mM (Fig. 3), we observed that the peak intensity increased, but the resolution of the signals for sertraline and fluox-etine gradually worsened. At a concentration of 200 mM, the peak intensity appeared to decrease, as did the resolution. Therefore, taking both the peak enhancement and baseline separation into account, it appeared that an HCB concentration of 100 mM was optimal.
Fig. 2. Influence of the concentration of organic solvent in micellar BGE on the CSEI–sweeping-MEKC method. Conditions: non-micellar BGE, 100 mM citric acid/disodium hydrogenphosphate (pH 2.2); HCB, 100 mM citric acid/disodium hydrogenphosphate (pH 2.2); HCB length, 18.1 cm; micellar BGE, 100 mM SDS in 50 mM citric acid/disodium hydrogenphosphate (pH 2.2); sample concentration, 5 ng/mL in pure water; electrokinetic injection, 15 kV for 900 s; separation voltage,−20 kV; detection at 203 nm; effective capillary length, 50 cm. (A) 0% IPA, (B) 15% IPA, (C) 22% IPA, and (D) 30% IPA. Peak identification: (1) sertraline, (2) fluoxetine, (3) paroxetine, (4) fluvoxamine, and (5) citalopram.
3.1.4. Optimizing the HCB injection length
In addition to the HCB concentration, the HCB injection length is another important factor affecting the stacking efficiency. We maintained the pH and the IPA and HCB concentrations at the opti-mal values described above, but varied the HCB injection length. Pressure injection for 0.5, 1.0, 1.5, and 2.0 min at 20.7 kPa provided HCB lengths of 9.1, 18.1, 27.2, and 36.3 cm, respectively. A longer HCB length allows more time for the cations to stack into a
nar-Fig. 3. Influence of the HCB concentration on the CSEI–sweeping-MEKC method. (A) 50 mM, (B) 100 mM, (C) 150 mM, and (D) 200 mM. Others conditions were the same as those used to obtainFig. 2.
row zone, resulting in higher-sensitivity detection of the analytes. The peak intensities when the HCB length was 27.2 cm were higher than those observed under the other conditions, but the baseline resolutions for sertraline and fluoxetine at 27.2 and 36.3 cm were unacceptable. Hence, we set the injection length at 18.1 cm as an optimal condition to provide sufficient sensitivity and separation efficiency in our subsequent experiments. A few papers have sug-gested that inserting a plug of water after injecting the HCB zone can improve the sample stacking as a result of the different elec-tric field strengths accelerating the cations into the capillary. In our hands, however, this process did not have any obvious effect and, therefore, we did not adopt the injection of water in our subsequent experiments.
3.1.5. Optimizing the SDS concentration
We employed SDS at concentrations of 50, 100, and 150 mM to investigate the effectiveness of the second on-line concentra-tion sweeping step. Upon increasing the SDS concentraconcentra-tion, we observed an increase in the peak intensity; a slight decrease in the resolution occurred, however, when using 150 mM SDS. The negatively charged SDS micelles entered the capillary under an applied negative polarity, passed through the interface of the sample stacked zone and the HCB, and then interacted with the cationic sample to perform a second on-line concentration. Based on the following equation, lsweep= linj[1/(1 + k)], where k is the
retention factor and lsweep and linj are the sweeping and
injec-tion lengths, respectively, an increase in the number of gathered SDS micelles should enhance the micelle–analyte interaction and, thereby, increase the retention factor. A shorter value of lsweep
pro-vided greater sweeping efficiency for the cationic samples, but the resolution became worse at high SDS concentrations. Thus, the optimal sensitivity enhancement and separation efficiency resulted when using 100 mM SDS as the micellar BGE.
3.1.6. Optimizing the sample injection time
In theory, increasing the time of electrokinetic injection would increase the amount of sample introduced into the capillary, which should increase the intensity of the detected signals.Fig. 4displays the effect of increasing sample injection time from 300 to 1200 s at 15 kV on the analyte signals’ intensities. The intensities of the
H.-L. Su, Y.-Z. Hsieh / J. Chromatogr. A 1209 (2008) 253–259 257
Fig. 4. Influence of the sample injection time on CSEI–sweeping-MEKC. (A) 300 s, (B) 600 s, (C) 900 s, and (D) 1200 s. Others conditions were the same as those used to obtainFig. 2.
detected signals increased until the injection time reached 900 s; beyond that time, the intensities did not increase any further and the resolution worsened. This behavior arose because the length of the sample zone injected was too long for sweeping. Therefore, a long injection length required greater sweeping power to provide satisfactory results. We found, however, that a sampling time of 900 s at 15 kV provided the optimal separation resolution and peak enhancement.
3.1.7. Optimizing the matrix effect
We tested the effect of preparing samples in solutions of var-ious conductivities, namely pure water and 1 and 5 mM citric acid/disodium hydrogenphosphate (pH 2.2) buffers.Fig. 5indicates that the sample prepared in pure water had the highest sensitiv-ity enhancement: 20-fold greater than that in the surroundings having the conductivity of a 1 mM buffer. When prepared in the buffer having a conductivity of a 5 mM buffer, the intensity of the detected signals was half of that obtained for the 1 mM buffer. These results indicate that a high-conductivity environment is unfavor-able for cationic analytes to undergo improved stacking. We suggest that a complicated matrix prevents the cationic sample from being introduced into the capillary during positive electrokinetic injec-tion. In addition, a more dilute solution having a lower conductivity would experience a stronger field, accelerating the cation’s mobil-ity and increasing the amount of sample introduced. Hence, to obtain improved sensitivity, the optimal method was to prepare the cationic samples in dilute, buffer-free surroundings.
3.2. Optimized conditions, calibration curves, detection limits
From the studies above, the optimized conditions for the CSEI–sweeping-MEKC method were a non-micellar BGE of 100 mM
Fig. 5. Influence of the sample matrix on the CSEI–sweeping-MEKC method. Sam-ples prepared in: (A) water, (B) 1 mM citric acid/disodium hydrogenphosphate (pH 2.2) buffer (ca. 210S/cm), and (C) 5 mM citric acid/disodium hydrogenphosphate (pH 2.2) buffer (ca. 580S/cm). Sample concentrations: (A) 5 ng/mL; (B and C) 10 ng/mL. Others conditions were the same as those used to obtainFig. 2.
citric acid/disodium hydrogenphosphate (pH 2.2) containing 22% IPA, an 18.1-cm length of the HCB (100 mM citric acid/disodium hydrogenphosphate), a micellar BGE of 50 mM citric acid/disodium hydrogenphosphate buffer containing 100 mM SDS and 22% IPA, and electrokinetic injection at 15 kV for 900 s of a sample prepared in pure water. Using these optimal conditions, we performed a quantitative analysis to obtain calibration curves. The linear range was within 0.5–7.5 ng/mL for the CSEI–sweeping-MEKC method. For the five SSRIs, the coefficients of determination (r2) were
greater than 0.9938 and the limits of detection (LODs; S/N = 3) ranged from 0.056 to 0.22 ng/mL. The LODs were much lower than those obtained when using published MEKC methods[8,9]. In terms of the reproducibility, the relative standard deviations of the migration times and peak height ratios were 2.3–3.1% and 1.3–3.2%, respectively.Table 1provides the regression equations of the five SSRIs and more detailed data. These results clearly indi-cate the superior linearity provided by the CSEI–sweeping-MEKC method and the acceptable relative reproducibilities of the five analytes.
3.3. Comparing MEKC, sweeping-MEKC, and CSEI–sweeping-MEKC
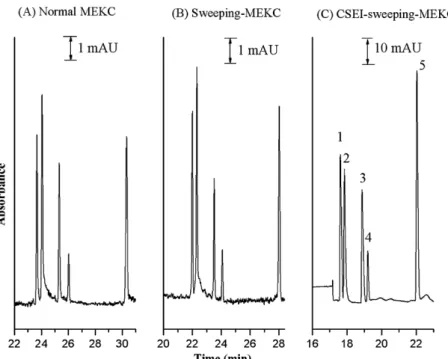
The chromatographs obtained using normal MEKC, sweeping-MEKC, and CSEI–sweeping-MEKC methods (Fig. 6) indicate the dramatically amplified efficiency of the latter method. The detailed data in Table 2 indicate that the sensitivity enhance-ment of the CSEI–sweeping-MEKC method was improved by a factor of between 5.7× 10⁴ and 1.2× 10⁵ relative to the
nor-mal MEKC ratio and by a factor of between 1.1× 10³ and
enhance-Table 1
Calibration lines, coefficients of determination, LODs, average migration times, and values of RSD for SSRIs using the CSEI–sweeping-MEKC
Sertraline Fluoxetine Paroxetine Fluvoxamine Citalopram
CSEI–sweeping-MEKC
Calibration line (y = ax + b) a = 4.98× 10³(±180) a = 4.84× 10³(±220) a = 4.27× 10³(±190) a = 2.41× 10³(±100) a = 1.00× 10⁴(±340)
b = 2.95× 10³ b = 2.29× 10³ b = 3.00× 10³ b = 5.90× 10² b = 3.52× 10³
Coefficient of determinationa 0.9961 0.9938 0.9940 0.9948 0.9965
LOD (S/N = 3, ng/mL) 0.10 0.10 0.12 0.22 0.056
Migration time (min, n = 4) 15.9 16.5 16.9 17.1 19.4
RSD (%; n = 4)
(a) Migration time 2.3 2.3 2.6 2.6 3.1
(b) Peak height 2.9 3.2 2.2 2.3 1.3
Sweeping-MEKC
LOD (S/N = 3, ng/mL) 28 22 44 110 27
Normal MEKC
LOD (S/N = 3,g/mL) 1.3 1.1 1.6 4.5 1.3
aCalibration line (0.5–7.5 ng/mL): peak height (arbitrary units) = slope× concentration (ng/mL) + y-intercept.
Fig. 6. Comparison between normal MEKC, sweeping-MEKC, and CSEI–sweeping-MEKC methods. (A) Normal MEKC conditions: separation buffer, 100 mM SDS in 50 mM citric acid/disodium hydrogenphosphate (pH 2.2) containing 30% IPA; sample concentration, 50g/mL in water; injection length, 1.5 mm. (B) Sweeping-MEKC conditions: separation buffer, 100 mM SDS in 50 mM citric acid/disodium hydrogenphosphate (pH 2.2) containing 22% IPA; sample concentration, 1g/mL in buffer (without SDS); injection length, 60 mm. (C) CSEI–sweeping-MEKC conditions: non-micellar BGE, 100 mM citric acid/disodium hydrogenphosphate (pH 2.2) containing 22% IPA; HCB, 100 mM citric acid/disodium hydrogenphosphate (pH 2.2); HCB length, 18.1 cm; micellar BGE, 100 mM SDS in 50 mM citric acid/disodium hydrogenphosphate (pH 2.2) containing 22% IPA; sample concentration, 5 ng/mL in water; electrokinetic injection, 15 kV for 900 s. Other conditions were the same as those used to obtainFig. 2.
ment factors obtained – up to 1.2× 10⁵-fold – for the peak
heights when using the CSEI–sweeping-MEKC method indicate that it is a powerful approach toward decreasing detection lim-its.
Table 2
Sensitivity enhancements of the five SSRIs
Compound SEhta× 10,000 SEhtb× 1000 Sertraline 7.3 1.3 Fluoxetine 5.7 1.1 Paroxetine 7.5 1.7 Fluvoxamine 11 1.8 Citalopram 12 2.3 aSE
ht= peak height of CSEI–sweeping-MEKC/peak height of MEKC (1.5 mm
injec-tion).
bSE
ht= peak height of CSEI–sweeping-MEKC/peak height of sweeping-MEKC
(60 mm injection).
3.4. Separating and determining SSRIs in plasma samples
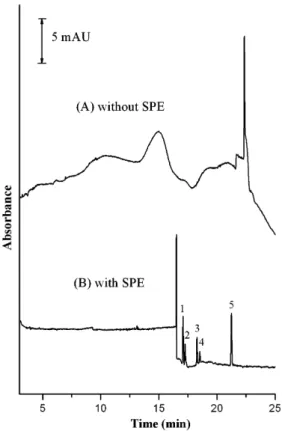
Biological samples have complexity that can make them diffi-cult subjects for analysis. To avoid a large matrix effect resulting from the use of real samples, we suspected that SPE would be a better choice, rather than liquid–liquid extraction, for the removal of interfering impurities and improving the recovery. In this study, we combined SPE with CSEI–sweeping-MEKC to determine the five SSRIs in human plasma samples.Fig. 7indicates that when the plasma samples were not pretreated through SPE, we could not detect any of the five analytes spiked into blank human plasma, presumably because the plasma samples contained many other impurities that interfered with the CSEI process. Using the opti-mized SPE method, we obtained recoveries of 76% for sertraline, 76% for fluoxetine, 78% for paroxetine, 90% for fluvoxamine, and 89% for citalopram; the reproducibilities (RSD; n = 3) of the extrac-tions were 11, 9.9, 8.8, 13, and 10%, respectively. Thus, use of SPE
H.-L. Su, Y.-Z. Hsieh / J. Chromatogr. A 1209 (2008) 253–259 259
Fig. 7. Comparison of the effects of pretreatment through SPE (A) without and (B) with pretreatment. The analyte in a spiked sample had concentration of 2.5 ng/mL. Other conditions were the same as those used to obtainFig. 6C.
for pretreated plasma samples resulted in satisfactory recover-ies.
Another factor that had the potential to affect the analyses was the matrix effect from the plasma samples. Even if SPE could remove most of the impurities, the conductivities of the final treated sam-ples would not be the same as those of the samsam-ples prepared in pure water. Strictly speaking, the conductivities of plasma sam-ples cleaned through the use of SPE should be higher than those prepared in pure water. To develop a system that would imitate the surroundings of real samples, we prepared a new calibration curve for the spiking method, in which various concentrations of the five SSRIs were added to a blank human plasma sample that had undergone pretreatment with SPE. The linearity of this method was reflected in the coefficients of determination (r2) of 0.9948
for sertraline, 0.9962 for fluoxetine, 0.9977 for paroxetine, 0.9964 for fluvoxamine, and 0.9914 for citalopram; the detection limits (S/N = 3) were 0.71, 0.90, 0.88, 1.5, and 0.35 ng/mL, respectively; the working range was 2.5–8.5 ng/mL. Although these data suggest good linear relationships, the detection limits and working range were worse than those of the calibration curves of the samples prepared in pure water. This situation arose because more dilute samples (i.e., those having low conductivity, exemplified by pure water) provided the best field-amplified sample stacking effect. The reproducibility (interday) of the peak heights (n = 4) was 6.4%
for sertraline, 8.9% for fluoxetine, 3.2% for paroxetine, 10% for flu-voxamine, and 6.6% for citalopram. These data indicate that the complicated matrices had a dramatic effect on the precision of the method.
4. Conclusion
We have demonstrated that a simple, rapid, and efficient CSEI–sweeping-MEKC technique may be used for on-line sample preconcentration and determination of five SSRIs. Under the opti-mized separation parameters, the enrichment factors for these five compounds when using CSEI–sweeping-MEKC fell within the range from 5.7× 10⁴to 1.2× 10⁵relative to the use of MEKC; relative to the
use of sweeping-MEKC, the gains were from 1.1× 10³to 2.3× 10³.
The LODs for the five SSRIs in pure water ranged from 0.056 to 0.22 ng/mL. We also successfully applied the CSEI–sweeping-MEKC method, in conjunction with SPE, to the analysis of these five SSRIs in a biological fluid (human plasma), providing LODs ranging from 0.35 to 1.5 ng/mL. The LODs of SSRIs in human plasma were higher than those analytes prepared in pure water, but still much sensitive than those obtained by the normal MEKC method. The reproducibil-ities of the analyses using this developed method were acceptable. Therefore, this technique should prove useful when examining the presence of SSRIs in human plasma samples at nanomolar levels. Acknowledgment
This study was supported by a grant (NSC 95-2113-M-009-033-MY3) from the National Science Council, Taiwan.
References
[1] R. Mandrioli, M.A. Raggi, Electrophoresis 27 (2006) 213–221.
[2] E.A. Khawam, G. Laurancic, D.A. Malone Jr., Clev. Clin. J. Med. 73 (2006) 351. [3] C. Salgado-Petinal, J.P. Lamas, C. Garcia-Jares, M. Llompart, R. Cela, Anal. Bioanal.
Chem. 382 (2005) 1351.
[4] G. Tournel, N. Houdret, V. Hédouin, M. Deveaux, D. Gosset, M. Lhermitte, J. Chromatogr. B 761 (2001) 147.
[5] K. Titier, N. Castaing, E. Scotto-Gomez, F. Pehourcq, N. Moore, M. Molimard, Ther. Drug Monit. 25 (2003) 581.
[6] A. Lucca, G. Gentilini, S. Lopez-Silva, A. Soldarini, Ther. Drug Monit. 22 (2000) 271.
[7] F.L. Sauvage, J.M. Gaulier, G. Lachâtre, P. Marquet, Ther. Drug Monit. 28 (2006) 123.
[8] L. Labat, M. Deveaux, P. Dallet, J.P. Dubost, J. Chromatogr. B 773 (2002) 17. [9] V. Pucci, S. Fanali, C. Sabbioni, M.A. Raggi, J. Sep. Sci. 25 (2002) 1096. [10] E. Lacassie, J.-M. Gaulier, P. Marquet, J.-F. Rabatel, G. Lachâtra, J. Chromatogr. B
742 (2000) 229.
[11] C. Sabbioni, F. Bugamelli, G. Varani, L. Mercolini, A. Musenga, M.A. Saracino, S. Fanali, M.A. Raggi, J. Pharm. Biomed. Anal. 36 (2004) 351.
[12] J.P. Quirino, J.-B. Kim, S. Terabe, J. Chromatogr. A 965 (2002) 357. [13] J.P. Quirino, S. Terabe, Science 282 (1998) 465.
[14] J.-B. Kim, K. Otsuka, S. Terabe, J. Chromatogr. A 932 (2001) 129. [15] L. Zhu, C. Tu, H.K. Lee, Anal. Chem. 74 (2002) 5820.
[16] J.P. Quirino, Y. Iwai, K. Otsuka, S. Terabe, Electrophoresis 21 (2000) 2899. [17] O. Nú ˜nez, J.-B. Kim, E. Moyano, M.T. Galceran, S. Terabe, J. Chromatogr. A 961
(2002) 65.
[18] C.-H. Lin, T. Kaneta, Electrophoresis 25 (2004) 4058. [19] J.P. Quirino, S. Terabe, Anal. Chem. 72 (2000) 1023.
[20] C. Fang, J.-T. Liu, S.-H. Chou, C.-H. Lin, Electrophoresis 24 (2003) 1031. [21] H.-Y. Chiang, S.-J. Sheu, Electrophoresis 25 (2004) 670.