!"#$%&'
()*+,-.'
/012'
' ' ' ' '3456789:;<=>?@AB
!
Morphology-controlled synthesis of
barium titanate nanostructures
' ' ' ' '
,-CDEFG'
HIJKDL2M'JK'
' 'NOP!QRSTUV'
3456789:;<=>?@AB
!
Morphology-controlled synthesis of
barium titanate nanostructures
' '
,-CDEFG''
'
'
'''Student: Kuan-Chih Huang'
HIJKDL2M'JK'
'
'''Advisor: Prof. Wen-Feng Hsieh
' ' '
!"#$%&'
()*+,-.'
/012'
' A ThesisSubmitted to Institute of Electro-Optical Engineering College of Electrical Engineering and Computer Science
National Chiao Tung University In Partial Fulfillment of the Requirements
for the Degree of Master
in
Electro-Optical Engineering June 2007
Hsinchu, Taiwan, Republic of China
I! !
Morphology-controlled synthesis of
barium titanate nanostructures
Student: Kuan-Chih Huang Advisor: Prof. Wen-Feng Hsieh
Institute of Electro-optical Engineering
National Chiao Tung University
Abstract
Morphology-controlled BaTiO3 nanostructures such as spherical, cube-shaped
and rod-shaped BaTiO3 were synthesized by using molten-salt synthesis method.
The products were all synthesized by reaction of BaO/BaCO3 and TiO2 with a eutectic
mixture of NaCl-KCl flux at 700 °C for 1 h. Powder X-ray diffraction device, field emission scanning electron microscope and transmission electron microscope were used to investigate the structure and morphology of the products. The proposed synthetic mechanism of BaTiO3 in the molten salt was also provided to illustrate
in-situ transformation mechanism of BaTiO3 nanostructures in the reaction. It
reveals that the initial shape of the titania and the dissolution rate of the initial precursors critically determine the shapes of the final products.
II! !
!"#$%&'()*+,-./0
!
1 123456781111111111111111111111119:;<5=>?1;<1
1@ABCDEFGHI23J1
1KL1
1111111MNOPQR./0S./T"# BaTiO3*+,-&$%UVWXAY
WZ[W*+,-\]^_`aJb&cdefgh BaO/BaCO3 i jklmn
NaCl-KCl opQq.d`rst 700 °CX1 uv&wx/y\z{aMN|P
}~ X F•€•‚ƒX„…€†‡ˆG‰Š‹Œr•Ž•ˆG‰Š‹Œ•‘’
“”&*+,-•$%\•–aMN—˜TOP BaTiO3*+,-nQR`&™
’./š#S›œBaTiO3*+,-n•ž`&Ÿ 4yš#aT¡¢£˜TiO2
III! !
-=1
1 ®¯&BD234°±²n³´µ¶·a¸¹&fºº»»&¼½\¾¿À ÁÂÃÄÅÆ^_Ç&ȉaÉÊËÌÍÍ…4ÎÏa^_Ç&ÐјÒZÓÔ ˜ÒaÕeÖÖn×aUØÙLÚÛ·aÜ`ÝfÞßBà\1 nᮯÁ`a•âL==&fá^_Ç&Dãy=>?;<aäåæÜ& ;:Zçèéê&ëtaìMnáíîÀïðnñòa¾¿ÀóôõZäåö paper &v÷aÝ&føùeçúapaper Åûû&ü>ZdýaÝ&fìþÿç!a"fghäå#Ü ;:U$%paper &u&'r•dý()&*+aìM
,n%paper Ý&f-.º»aÝ&L==äå&/˜\1
z{aÁ0L==1M&62a3óôõ&4556k 78 9:;•–ôõ&<= 9:a3óôõ;>?@^_;•–P&QR0aÝ&L==Eyᮯ&AB
r•CDaÕLEFß=GHᮯSSEM I’&DJKLaM¦ôNn=O
PaJr“”QRSTeUV»&aEyçèéê&KWÝ&fìMXY&ß=\1 Z[\ᮯ&]^4°aÁ0Lß=ô¤_J&8`Zabac0dfb ef»&gÛar•zhÎS&i`i~j=a"fMNeô¤_J ôôk laméfQÁi`i~&v÷aen^_ÇK n K ;ïoapq¾Lr¤j =aá“&ȉM–žsçªYt;·uvçîawÀxy&fDãez,&ï ç{aô¤|}&ß~Ý&ïÊ\1
IV! !
•–¾L==u•Z€•‚1Mƒ„…†‡š&ˆ‰a,nŠ‹žs»Œb ƒ•ôŽ·uv•‚EyZu•n^_Å‘’M&ô“”•&a–a6—˜n™
VÅšM&›œ;Eac0M&…V•žïŸa"¾Ýf O¡vn Bogi ¢Ç
£q•¤&ô“g_Za–a¡¥n`¦df§¨ ©àÿªr•ô“«ª&¬ -a®¯°M–Éf±²þ³vqÝe´&uµ¶df·¸¹af^_Ç&ºÜ »a¼½M–^_¾Oa¿À&ÁÂÃÄZÅ•aM–ðƾfLÇÈ ÉÃÄ\1 •–aMÕLß=_JÊËM&ÌÌÍÍX3u;D·ÏÐ&HHr•ô NnMÄíABM&ÑÒÓaÔÕb°N&Ö×ZØÙaÌÚìMï¾O&Û/ EÛa==°N\1 ß=@ܪÝÞNSC-96-2628-M-009-001-MY3 &Ö×1 1 1 1 1 1 1 mßßàáßâámã1äHåæ çèé^_Ç
V! !
Table of Contents
Abstract (in English)...I
Abstract (in Chinese)...II
Acknowledgements...III
List of Figures...VII
List of Tables...VIII
Chapter 1 Introduction...1
1-1 Ferroelectric materials...1
1-1-1 BaTiO
3(BTO) bulk...1
1-1-2 BaTiO
3nanostructures...2
1-1-3 BaTiO
31D nanostructures...2
1-1-4 Historical processes...2
1-1-5 Brief mechanism of molten-salt synthesis...3
1-2 Perovskite...4
1-3 Motives...6
1-4 Organization of the thesis...8
Chapter 2 Theoretical Background...9
2-1 Growth mechanism of molten-salt synthesis...9
VI! !
2-3 X-ray diffraction...14
2-4 Scanning electron microscopy...18
2-5 Transmission electron microscopy...21
Chapter 3 Experimental Section...24
3-1 Sample preparation...24
3-2 Characterization...28
3-2-1 X-ray diffraction……...28
3-2-2 Scanning electron microscopy...28
3-2-3 Transmission electron microscopy...29
3-3 Refinement procedures...30
Chapter 4 Results and Discussion...34
4-1 Results of SEM, XRD and TEM...34
4-2 Comparison between BT-1 and BT-3...39
4-3 Comparison between BT-2 and BT-3...39
4-4 Refinement by using two-peak fit...39
4-5 Proposed mechanism of molten-salt synthesis...42
Chapter 5 Conclusion...45
5-1 Conclusion...45
VII! !
VIII! !
List of Figures
Figure 1.1 Perovskite structure………...4
Figure 1.2 ABO
3structure………..4
Figure 1.3 Phases of BaTiO
3………..5
Figure 2.1 Flowchart illustrating factors influencing the molten-salt
synthesis of transition-metal oxide materials………...11
Figure 2.2 Mechanisms of dissolution-precipitation and in-situ
transformation………...13
Figure 2.3 Diffraction of X-ray………15
Figure 2.4 Equivalence of a second-order 100 reflection and a first-order
200 reflection.……….………..17
Figure 2.5 Schematics of closed circuit TV and scanning electron
microscope………...……….20
Figure 2.6 Schematic showing electrons and electromagnetic waves
emitted from a specimen as a result of elastic and inelastic scattering of
the incident electron waves………...22
Figure 2.7 Schematic ray diagrams for a three-lens imaging microscope
operated for imaging and selected area electron diffraction………….…23
IX! !
Figure 3.1 SEM images of the spherical TiO
2, rod-shaped K
2Ti
4O
9and
rod-shaped TiO
2and powder XRD patterns of the rod-shaped K
2Ti
4O
9and rod-shaped TiO
2………..26
Figure 3.2 Flowchart of the growth of the rod-shaped TiO
2………….27
Figure 3.3 Flowchart of the growth of BT-1, BT-2 and BT-3…………..27
Figure 4.1 SEM images of the spherical TiO
2, rod-shaped K
2Ti
4O
9and
rod-shaped TiO
2and powder XRD patterns of the rod-shaped K
2Ti
4O
9and rod-shaped TiO
2……….………35
Figure 4.2 SEM images of the three-series products: BT-1, BT-2 and
BT-3……….………….36
Figure 4.3 Powder XRD patterns of the three-series products and JCPDS
Card for BT-1, BT-2 and BT-3………..…...37
Figure 4.4 TEM image, HRTEM image with SAED pattern, and EDS
spectrum of BT-3………..38
Figure 4.5 Two-peak fit of the powder XRD patterns at (200) and (002)
peaks of the three-series products: BT-1, BT-2 and BT-3….…………..41
Figure 4.6 Proposed schematic diagram of the synthetic mechanism of
X! !
List of Tables
Table 3.1 The indications of barium and titanium precursors used in the
synthesis of the three-series products………...26
Table 4.1 The refinement results of BT-1, BT-2 and BT-3………41
1
Chapter 1 Introduction
1-1 Ferroelectric materials
Ferroelectricity is a phenomenon, of which the material possesses spontaneous polarization, ferroelectric domains, ferroelectric hysteresis loop, and so on when it is cooled below the Curie temperature (Tc). Ferroelectric ceramics were produced in
the early 1940s with the discovery of the phenomenon of ferroelectricity with the high dielectric constant in barium titanate (BaTiO3).
1-1-1 BaTiO
3Bulk
Over the past decade, ferroelectric nanomaterials have attracted much attention due to their potential applications1-3. Among various ferroelectric ternary transition-metal oxides, BaTiO3 is a paramount material, which possesses a perovskite
structure with Tc of about 132 C, and has drawn major interest for ferroelectric
applications. It exhibits large nonlinear optical coefficient and large dielectric constant, which can be found in widespread applications in the manufacture of multilayer capacitors, thermistors, electro-optical devices, transducers, high-k dielectrics, dynamic random-access memory and field effect transistors4-6. Nowadays, much effort has been made for the morphology-controlled synthesis of crystalline ferroelectric oxide materials because the aforementioned properties, large nonlinear optical coefficient and large dielectric constant, are highly dependent on the size and shape7.
2
1-1-2 BaTiO
3nanostructures
Of various nanostructures, low-dimensional nanostructures, such as nanoparticles, nanowires, nanocubes and nanorods, have especially received colossal interest from the scientific and engineering communities8-9 because these structures exhibit distinct physical and chemical properties from bulk materials due to their smaller particle sizes and larger surface-to-volume ratios. Thus, considerable works have been performed to probe the optical10, electronic11 and magnetic12 properties of these nanostructures.
1-1-3 BaTiO
31D nanostructures
One-dimensional (1D) structures, nanorods and nanowires, are expected to provide new alternatives for the realization of the devices by the recent theoretical studies with the first principles and the experiments of ferroelectric nanowires primarily because the size-dependent ferroelectricity of 1D structure could preserve to much smaller diameter than that of 0D structure (nanoparticle) could and Tc is
reduced as the diameter of 1D structure is reduced13-15. A method for researching the axial poling and switching in one-dimensional BaTiO3 nanowire by using
piezoresponse force microscopy (PFM) was also reported16.
1-1-4 Historical processes
So far, there are many methods for synthesizing BaTiO3 1D structures, and the
major methods can be approximately separated into two groups. The first and also the earliest process is molten-salt synthesis; the second process is hydrothermal
3
process, which has to perform under high pressure17-19. In the first group, Hayashi et
al.20 reported the synthesis of rod-shaped BaTiO3 powder particles by rod-shaped
TiO2·nH2O and BaCO3 in molten chloride. Mao et al.21 produced single-crystalline
BaTiO3 nanorods and SrTiO3 nanoparticles by using a large-scale and facile
solid-state reaction with nonionic surfactant. Recently, Deng et al.22 obtained the 1D BaTiO3 nanostructure by using a surfactant-free approach in nonaqueous molten salt
media.
1-1-5 Brief mechanism of molten-salt synthesis
Molten-salt synthesis is a simple method to prepare ceramic products. The molten salt is the critical role in the whole process and is used as a reaction medium—solvent—for reactants to dissolute and precipitate inside. The features of this synthesis method are related to the surface and interface energies between the constituents and the salt, resulting in a tendency to minimize the energies by forming a specific morphology23. The morphology and characteristics of the products are influenced by the initial particle size and shape, the type and amount of salt, the precursor composition, the reaction temperature and the dissolution rate of the constituents in the molten salt23. In this work, we used rod-shaped TiO2 as the
source of titanium due to the highly anisotropic nature of growth in molten salt24 to successively synthesize anisotropic BaTiO3 nanostructures such as cube-shaped and
rod-shaped nanostructures, which is realized by means of the distinct dissolution rates of selected barium precursors and titanium precursor in the molten salt.
4
1-2 Perovskites
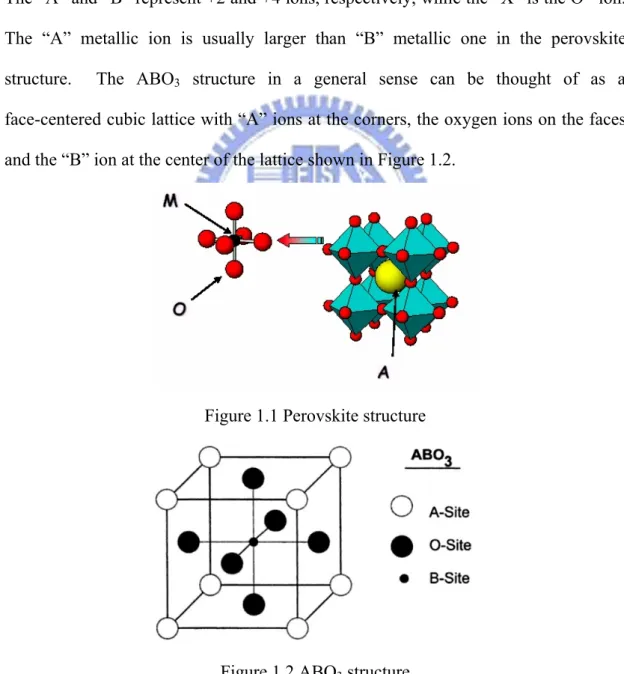
The perovskite compounds are an extremely important group of ferroelectric materials. Perovskite-type structured materials exhibit useful properties and have a variety of crystal structure. The general formula of perovskites is ABX3 shown in
Figure 1.1, which is composed of three distinct chemical elements in the ratios of 1:1:3. The “A” and “B” are metallic elements and the “X” is a non-metallic element. The “A” and “B” represent +2 and +4 ions, respectively, while the “X” is the O-2 ion. The “A” metallic ion is usually larger than “B” metallic one in the perovskite structure. The ABO3 structure in a general sense can be thought of as a
face-centered cubic lattice with “A” ions at the corners, the oxygen ions on the faces and the “B” ion at the center of the lattice shown in Figure 1.2.
Figure 1.1 Perovskite structure
5
As a stronger electric field is applied to the ABO3-type perovskite, the “B”
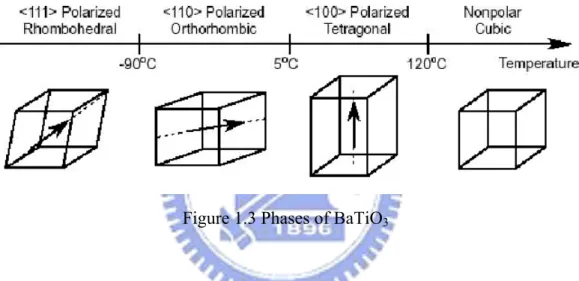
cation will displace from the original octahedron. Shifting of this “B” cation due to the applied electric field causes the change of structure, in turn induces electric dipole. The atomic structure of perovskite is very sensitive to the alteration in the factor of temperature. As the temperature changes, the crystallographic dimensions change due to distortion of the octahedral. The crystal structures of ABO3 include cubic,
tetragonal, orthorhombic, and rhombohedral shown in Figure 1.3.
Figure 1.3 Phases of BaTiO3
All of the ferroelectric materials have a transition temperature called the Curie temperature (Tc). When the crystal temperature goes above the Curie temperature, T
> Tc, the crystal does not exhibit ferroelectricity, while for T < Tc the crystal exhibits
ferroelectricity. Decreasing the temperature around Tc, a ferroelectric crystal
undergoes a phase transition from a non-ferroelectric phase to a ferroelectric phase. As a result, the distorted octahedral are coupled together, and a very large spontaneous polarization can be achieved. This large spontaneous polarization will lead to a large dielectric constant highly sensitive to the distorted structure.
The ferroelectric state is when the crystals contain a spontaneous reversible electric dipole moment; the paraelectric state is when the dipoles in neighboring cells
6
are randomly oriented relative to each other. The change from paraelectric to ferroelectric state occurs at Tc and corresponds to the change in dielectric constant.
Therefore, many perovskite materials are used for applications in electronics (e.g., nonvolatile memories, transducers, actuators, and capacitors) based on their special electronic properties.
1-3 Motives
Understanding the behavior of ferroelectric materials at the nanoscale is important to the development of random-access memory and logic circuitry. Most technologically important ferroelectrics are oxides with a perovskite structure, because this structure has a wide capacity characterized by a tolerance factor. These oxides, including BaTiO3, exhibit large nonlinear optical coefficients and large
dielectric constants, which are responsible for their widespread applications in the manufacture of multilayer capacitors, thermistors, electro-optical devices, transducers, high-k dielectrics, dynamic random-access memory and field effect transistors.
The synthesis of BaTiO3 nanostructures has attracted much attention because of
the aforementioned properties, large nonlinear optical coefficients and large dielectric constants, are shape- and size-dependent. For instance, the ferroelectric Tc of
zero-dimensional (0D) BaTiO3 nanoparticles decreases progressively with size,
resulting in room temperature stabilization of the paraelectric cubic phase25-26, 1D BaTiO3 nanowires of 10 nm diameter still retain their ferroelectric properties, and
nonvolatile polarization domains with dimensions as small as 100 nm2 can be induced in these nanowires.
1D ferroelectric perovskite oxides puissantly arouse our attention because they possess significant potential to address the requirements for reducing the scale of
7
devices on which the interests about optical, magnetic, and electronic properties depend. Also, the 1D ferroelectric nanostructures, including nanorods or wires, nanotubes, and nanobelts, have been expected to contribute to improving performance of electronic devices with ultrahigh density of data bits, lower manufacturing cost, high operation speed, and less power consumption9-27-30. We therefore progressively find out the possible ways to fulfill the realization of BaTiO3 1D nanostructures.
So far, the major methods for synthesizing BaTiO3 1D nanostructures can be
approximately separated into two groups: molten-salt synthesis and hydrothermal process, which has to perform either under high pressure or with template and the productivity is extremely low and nonuniform. Because BaTiO3 1D nanostructure is
difficult to obtain due to the isotropy of BaTiO3 tetragonal crystal structure and the
anisotropy of the 1D structure, the control of nucleation and growth of 1D nanostructure materials is still a big challenge31. As a result of these limitations, we think the more reliable and prolific method for synthesizing BaTiO3 1D nanostructure
in ambient atmosphere is using rod-shaped titania for acting as the anisotropic media on where the barium precursors stick in the molten salt.
As a matter of fact, according to the reproductive results of the methods provided by journal on our own, we consider some of them are the misleading methods. Furthermore, based on the results of X-ray diffraction device and scanning electronic microscope, we doubt the BaTiO3 nanowires shown in the paper is CO2
nanowires. Therefore, we finally reason that the more warranted and credible method for synthesizing BaTiO3 1D structure is molten-salt synthesis in company
8
1-4 Organization of the thesis
In this thesis, there are five chapters including introduction, theoretical background, experimental section, results and discussion, and conclusion. In Chapter 1, we introduce ferroelectric material, perovskite, as well as motive. In Chapter 2, we first describe the related theoretic background such as growth mechanism of molten-salt synthesis and dissolution-precipitation and in-situ transformation mechanisms. In Chapter 3, we expatiate the experimental details including sample preparation by molten-salt synthesis method and the equipment setups for measuring the characteristics of the products. In Chapter 4, we exhaustively give the results and discussion about the three-series products and the proposed synthesis schematic diagrams for describing the growth mechanism of the three-products in the molten salt respectively. In the final chapter, we conclude the investigations on the BaTiO3 products and proposed several topics worthy of further
9
Chapter 2 Theoretical Background
2-1 Growth mechanism of molten-salt synthesis (MMS)
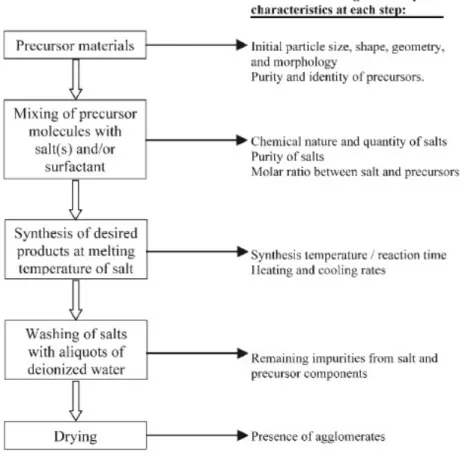
The MSS method is one of the simplest, most versatile, and cost-effective approaches available for obtaining crystalline, chemically purified, single-phase powders at lower temperatures and often in overall shorter reaction times with little residual impurities as compared with conventional solid-state reactions. The environmental appeal of this technique arises from its intrinsic scalability, generalizability, and facility as well as its fundamental basis on the use of salt as the reaction medium. In fact, 1) the identity as well as the size of the anion associated with the salt, 2) the solubilities/dissolution rates of the constituent components within the molten salt itself, 3) the precise melting point of either the salt or complex salt mixture used, 4) the heating temperature and duration, as well as 5) the unique morphological (e.g., shape) and chemical composition of the precursors involved are all important, readily controllable factors that influence the growth rate as well as the resultant structural characteristics (i.e., size, shape, and crystallinity) of the as-prepared particles. The main processing stages associated with the MSS method are schematically illustrated in Figure 2.1. Essentially, oxides and/or other appropriate precursors corresponding to the desired compound are mixed with either the desired salt (e.g., NaCl) or a eutectic mixture of salts (e.g., NaCl-KCl; NaNO3-KNO3) and then fired at a temperature above the melting point of the salt
medium to form a molten flux. At this temperature, precursor molecules disperse, dissociate, rearrange, and then diffuse rapidly throughout the salt. Upon further heating, particles of the desired metal-oxide phase are formed through an initial
10
nucleation step followed by a growth process that is very much dependent upon the identity of the salt species, the quantity of salt used in the reaction medium, the magnitude of the temperature at which the reaction is run, and the reaction duration. After cooling, the salt itself can be typically and rather simply eliminated by washing with deionized water. Upon drying, unagglomerated powders can be routinely obtained after appropriate processing. While bulk materials have long been prepared using the MSS method, the preparation of uniform nanostructures using this technique has only arisen relatively recently, that is, within the current century. Antonietti et
al.32 first described a convenient route for the synthesis of nanoparticulate salts, metals, and metal oxides using concentrated salt solutions and block-copolymer surfactants. Research groups in Asia33-37 demonstrated the high-yield preparation of smooth single-crystalline Mn3O4, SnO2, and CuO one-dimensional nanostructures
through the MSS method using NaCl in the presence of a surfactant (such as Tween 80 or Triton X-100), and found that an Ostwald ripening mechanism (namely the dissolution of fine particles and redeposition onto larger particles) was primarily responsible for the nanowire growth observed. A few years later, Qian et al.38 successfully synthesized Mn5Si3 nanocages and nanotubes through a molten-salt
reaction between MnCl2 and Mg2Si at 650 C by controllably altering reactant molar
ratios as well as reaction temperatures. In 2006, Wang and co-workers demonstrated the feasibility of a composite-hydroxide-mediated approach to the synthesis of single-crystalline complex oxide nanostructures of various structural and compositional motifs, based on a reaction between a metallic salt and a metallic oxide39. In addition, Ren and co-workers used a molten-salt-assisted thermal evaporation process to prepare aligned ultralong ZnO nanobelts, with an average length of 3.3 mm and widths up to 6 mm, stretching over a large area with the intention of creating electron sources with enhanced fieldemission properties40.
11
Furthermore, Jiao and co-workers were able to prepare a series of dispersed, crystalline La1-xSrxMnO3 nanoparticles using a molten-salt reaction in the presence of
2-pyrrolidone41. Over the years, our laboratory has applied this generalized methodology to the fabrication of transition-metal oxide nanostructures.
Figure 2.1 Flowchart illustrating factors influencing the molten-salt synthesis of transition-metal oxide materials42
12
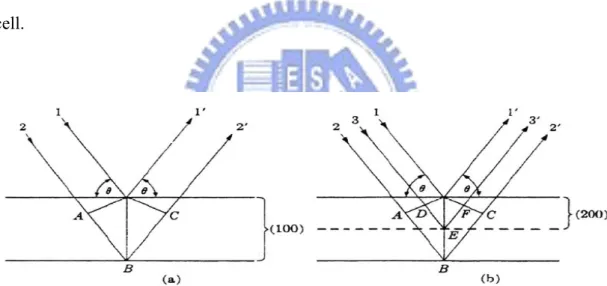
2-2 Dissolution-precipitation and in-situ transformation mechanisms
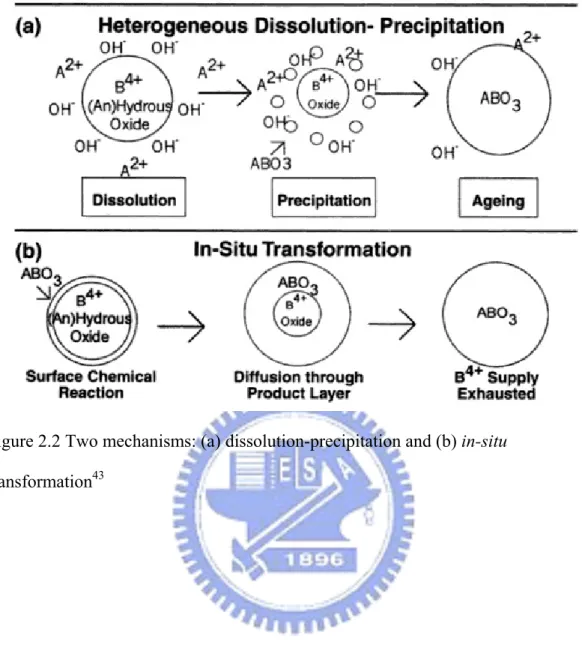
Dynamic interactions between barium precursor, titanium precursor, and the surrounding solution during reaction lead to the crystallization of barium titanate. Two main mechanisms or a combination of these mechanisms are suggested as rate determining for the reaction of ferroelectric powders: dissolution-precipitation and
in-situ transformation mechanisms.
A dissolution-precipitation mechanism occurs when soluble reactants are heated over time. As a result, the concentration in the solution increases. When there is sufficient dissolution of the ions, supersaturation is achieved and the product is formed. The nucleation can occur either homogeneously from bulk solution or heterogeneously at the surface of crystalline titanium precursor, TiO2, or related
amorphous phases. Since homogeneous nucleation requires relatively high supersaturation conditions, it is more likely to occur when highly reactive and relatively soluble titanium precursor is involved. On the other hand, heterogeneous nucleation, in which a solid surface locally dissolves and reacts with barium precursor, will predominate when a sparingly soluble, crystalline titanium precursor is used in the synthesis.
An in-situ transformation mechanism assumes a surface reaction of cations (i.e., Ba2+) with a less soluble species (i.e., TiO2) in solvent. The reaction proceeds by the
diffusion of cations through the structure of insoluble species inwardly until the completion of the reaction, in the meanwhile resulting in an outside layer of BaTiO3
with an unreacted TiO2 core. Furthermore, two growth regimes are observed,
depending whether the limiting step is the reaction at the interface or the diffusion of the barium ions through the existing barium titanate layer.
13
Figure 2.2 Two mechanisms: (a) dissolution-precipitation and (b) in-situ transformation43
14
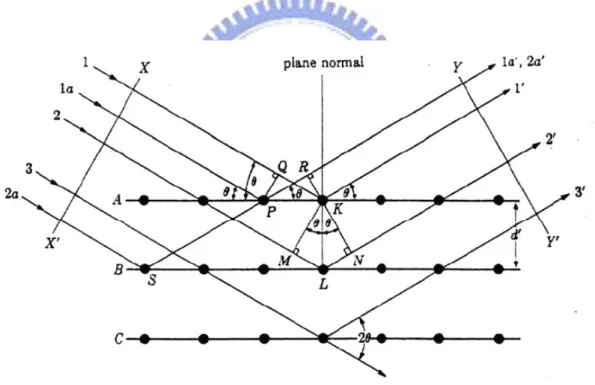
2-3 X-ray diffraction (XRD)
For the particular condition described by Figure 2.3, the only diffracted beam form is that shown, namely one making an angle of reflection ! equal to the angle of incident !. We will show this, first, for one plane of atoms and, second, for all the atoms making up the crystal. Consider rays 1 and 1a of the incident beam, they strike atoms K and P on the first plane of the crystal and are scattered in all directions. While in the directions 1´and 1a´ of the scattered beams are completely in phase capable of reinforcing each other; because the path difference between the wave fronts XX´and YY´ is equal to
QK ! PR = PK cos! ! PK sin! = 0. (2.1)
Similarly, the scattered rays from all the atoms on the first plane to the directions parallel to 1´ are in phase contribute to the diffracted beam. This will be true for all of the planes, and it remains to find the condition of rays scattered by atoms on the different planes. Consider parallel lattice planes spaced d' apart. Rays 1 and 2, for example, are scattered by atoms K and L, and the path difference of the rays 1K1´ and 2L2´,
ML + LN = d" sin! + d" sin! (2.2)
is equal to the path difference of the overlapping rays scattered by S and P in the same direction shown in Figure 2.2, since in this direction there is no path difference between rays scattered by S and L or P and K. The scattered rays 1´and 2´will be
15
completely in phase if the path difference is equal to an integer number n of wavelengths # , i.e.,
n# = 2d´ sin!. (2.3)
This relation was first formulated by Bragg and is known as the Bragg’s law. Assuming n = 1, we can consider a reflection of any order as a first-order reflection from planes, real or fictitious, spaced at a distance 1/n of the previous spacing. This turns out to be a real convenience, so we set d = d´/n and write the Bragg law in the form # = 2d sin!.
Figure 2.3 Diffraction of X-ray
What determine the possible directions, referring to Figure 2.4, we see that various diffraction angles 2!1 , 2!2, 2!3 , … can be obtained from the (100) plane by
using a beam incident at the correct angle !1, !2, !3,… and producing the first-,
16
planes, the (111) planes, the (213) planes, and so on. We obviously need a general relation which predicts the diffraction angle for any set of planes. This relation is obtained by combing the Bragg’s law and the plane-spacing equation.
For example, the value of d, the distance between adjacent planes in the set (hkl), if the crystal is cubic, then
# = 2d sin! (2.4) and 1 d2 ! (h2" k2" l2) a2 (2.5)
where a is the lattice constant. Combing these equations, we have
sin 2
#
!$
2 4a2(h 2" k2" l2) (2.6)This equation predicts, for a particular incident wavelength # and a particular cubic of the unit cell size a, all the possible Bragg angle at which diffraction can occur from the planes (hkl). For (110) plane, for example, Eq. (2-6) becomes
sin
2
#
110 !$
22a2 .
If the crystal is tetragonal, with axes a and c, then the corresponding general equation is
17 sin 2
#
!$
2 4 ( h2" k2 a2 " l2 c2) (2.7)and similar equations can readily be obtained for the other crystal systems. These examples show that the directions, in which a beam of given wavelength is diffracted by a given set of lattice planes, are determined by the crystal system to which the crystal belongs to and its lattice parameters. In short, diffraction directions are determined solely by the shape and size of the unit cell. This is an important point and so is its converse: all we can possibly learn about an unknown crystal by measurements of the directions of diffracted beams are the shape and size of the unit cell.
Figure 2.4 Equivalence of (a) a second-order 100 reflection and (b) a first-order 200 reflection.
18
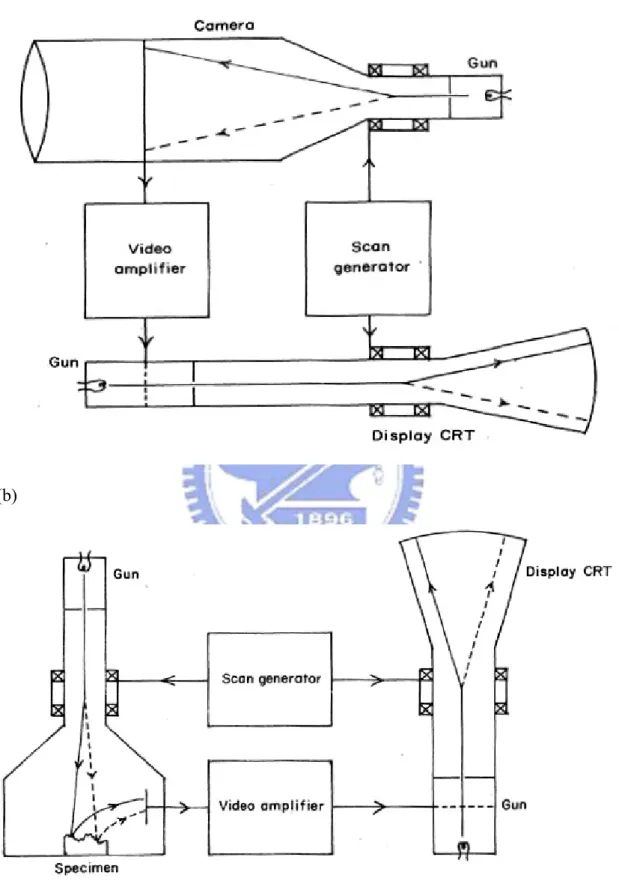
2-4 Scanning electron microscopy (SEM)
The principle of SEM used for examining a solid specimen in the emissive mode is closely comparable to that of a closed circuit TV system shown in Figure 2.5. In the TV camera, light emitted from an object forms an image on a special screen, and the signal from the screen depends on the intensity of image at the point being scanned. The signal is used to modulate the brightness of a cathode ray tube (CRT) display, and the original image is faithfully reproduced if (a) the camera and display raster are geometrically similar and exactly in time and (b) the time for signal collection and processing is short compared with the time for the scan moving from one picture point to the next.
In the SEM the object itself is scanned with the electron beam and the electrons emitted from the surface are collected and amplified to form the video signal. The emission varies from point to point on the specimen surface, and so an image is obtained. Many different specimen properties cause variations in electron emission, thus, although information might be obtained about all these properties, the images need interpreting with care. The resolving power of the instrument cannot be smaller than the diameter of the electron probe scanning across the specimen surface, and a small probe is obtained by the demagnification of the image of an electron source by means of electron lenses. The lenses are probe forming rather than image forming, and the magnification of the SEM image is determined by the ratio of the sizes of raster scanned on the specimen surface and on the display screen.
For example, if the image on the CRT screen is 100 mm across, magnifications of 100X and 10000X are obtained by scanning areas on the specimen surface 1 mm and 10 $m across, respectively. One consequence is that high magnifications are easy to obtain with the SEM, while very low magnifications are difficult. This is
19
because large angle deflections are required which imply wide bore scan coils and other problem parts, and it is more difficult to maintain scan linearity, spot focus and efficient electron collection at the extremes of the scan.
20
(a)
(b)
21
2-5 Transmission electron microscopy (TEM)
TEM is an analytical imaging technique whereby a beam of electrons is focused onto a specimen causing an enlarged version to appear on a fluorescent screen or layer of photographic film. Like all matter, electrons have both wave and particle properties, and their wave-like properties mean that a beam of electrons can in some circumstances be made to behave like a beam of radiation. The wavelength is dependent on their energy, and so can be tuned by adjustment of accelerating fields, and can be much smaller than that of light, yet they can still interact with the sample due to their electrical charge. Electrons are generated by a process known as thermionic discharge in the same manner as the at the cathode in a cathode ray tube; they are then accelerated by an electric field and focused by electrical and magnetic fields on to the sample. Details of a sample can be enhanced in light microscopy by the use of stains; similarly with electron microscopy, compounds of heavy metals such as lead or uranium can be used to selectively deposit heavy atoms in the sample and enhance structural detail, the dense electron clouds of the heavy atoms interacting strongly with the electron beam. The electrons can be detected using a photographic film, or fluorescent screen among other technologies.
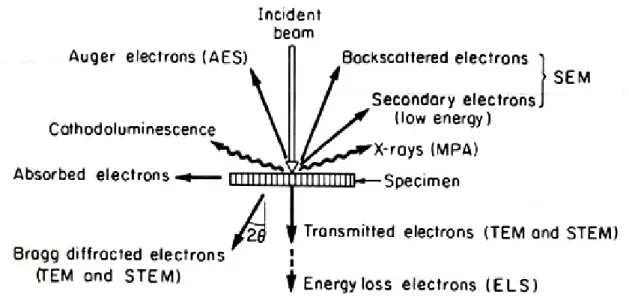
Figure 2.6 illustrates the principal results of electron scattering by a sample and, as a result, the principal sources of information that can be obtained. The operating modes are as follows: TEM, SEM, scanning transmission electron microscopy (STEM), and microanalysis (by X-ray and/or energy loss analysis or Auger analysis of surfaces).
22
Figure 2.6 Schematic showing electrons and electromagnetic waves emitted from a specimen as a result of elastic and inelastic scattering of the incident electron waves.
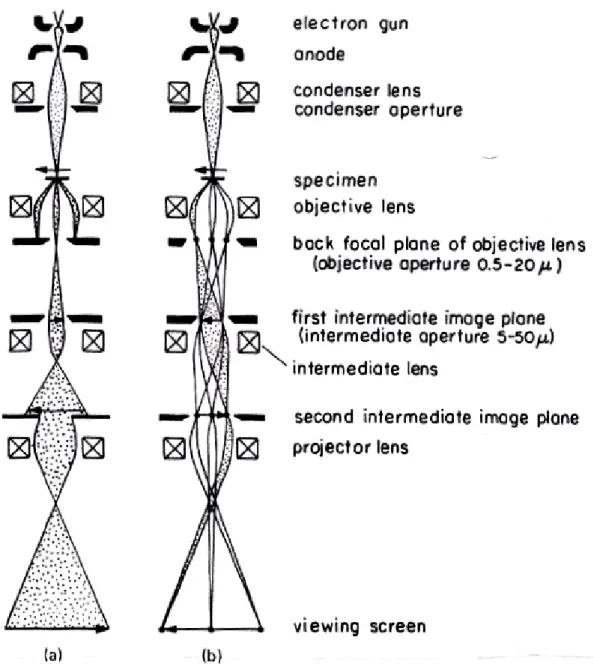
In the TEM mode, which is the one most often encountered, the microscope is operated Figure 2.7(a) to form images by bright field, dark field, or lattice image phase contrast modes and Figure 2.7(b) to form diffraction patterns by using selected area apertures and focusing the intermediate lens on the diffraction pattern formed in the back focal plane of the objective lens. Simple ray diagrams to illustrate these two modes are shown in Figure 2.7. In the following sections the specially important methods of dark field imaging, selected area diffraction, and lattice imaging are discussed. As the collimated beam of electrons passes through the crystalline specimen, it is scattered according to Bragg’s law (Eq. 2.3). The beams that are scattered at small angles to the transmitted beam are focused by the objective lens to form a diffraction pattern at its back focal plane (Figure 2.7). When the intermediate and projector lens system is properly focused, a magnified image of the back focal plane of the objective lens will be projected on the viewing screen. An intermediate aperture may be inserted at the first intermediate image plane to limit the field from which the diffracted information is obtained. The intermediate selected area electron
23
diffraction (SAED) aperture makes it possible to obtain diffraction patterns from small portions of the specimen. This technique is very useful, since a direct correlation can be readily made between the morphological and crystallographic information of very small areas. It is also necessary for establishing the diffracting and contrast conditions in the image. The technique is of particular importance when more than one phase is present in the specimen.
Figure 2.7 Schematic ray diagrams for a three-lens imaging microscope operated (a) for imaging and (b) for selected area electron diffraction.
24
Chapter 3 Experimental Section
3-1 Sample preparation
The three-series products (BT-1: spherical BaTiO3, BT-2: cube-shaped BaTiO3
and BT-3: rod-shaped BaTiO3) were synthesized with different barium and
multi-shaped titanium precursors. BT-1 was synthesized by using BaCO3 as the
barium precursors reacted with the spherical TiO2 in a eutectic mixture of NaCl-KCl
flux. BT-2 and BT-3 were synthesized by using BaO and BaCO3 (BaCO3 will
transform into BaO when heating over about 1450 C which is much higher than the reaction temperature we used.) as the barium precursors reacted with the rod-shaped TiO2 in NaCl-KCl flux, respectively. The reagents we used were BaO, BaCO3, TiO2,
KCO3, NaCl and KCl, which were of A. R. grade without further purification. The
rod-shaped TiO2 was synthesized and derived from rod-shaped K2Ti4O9 shown in
Figure 3.2. The mixture of K2CO3 and TiO2 in the molar ratio of 1:3 was heated at
1000 C for 18 h in the combustion boat (Al2O3 boat). Then, the as-synthesized
product was washed with hot deionized water several times to remove the K2CO3
phase entirely and finally dried at 60C overnight. The product in the meanwhile was rod-shaped K2Ti4O9 verified by field emission scanning electron microscopy
(FE-SEM, HITACHI S-4000) and powder X-ray diffraction (XRD, MAC Sience, MXP18) equipped with Cu K% radiation shown in Figures 3.1(b) and (d). The rod-shaped K2Ti4O9 powder then was washed with hot 1M HCl solution for 2 h to get
rid of K2O phase. The residue phase is TiO2·nH2O, which was heated at 700 C for 1
h for transforming into the rod-shaped TiO2 and the SEM image and powder XRD
25
To synthesize BT-1, BT-2, and BT-3, the detailed synthetic procedure is as follows shown in Figure 3.3. For starters, the mixture of barium precursor and titanium precursor in the molar ratio of 1:1 was wet-mixed in the ethanol solution at 50 C for 1 h with magnetic stirring and then dried at 50 C for 6 h. Second, the mixture was mixed with NaCl-KCl flux (50% mol NaCl and 50% mol KCl, m.p.: 657 C) acting as a reaction medium in the weight ratio of 1:1 by hand-grinding in a mortar and pestle for 0.5 h. Third, the as-synthesized mixture was placed into the combustion boat and heated at 700 C for 1 h in the furnace. The increasing rate was 5 C/min and the product was taken out of the furnace for cooling naturally after reaction. Finally, the as-synthesized product was washed with hot deionized water several times until no chloride ions were detected by silver nitrate solution to assure the residue of salt was removed exhaustively and then dried at 120 C overnight.
26
Figure 3.1 SEM images and powder XRD patterns of the titanium precursors: (a) SEM image of the spherical TiO2, (b) SEM image of the rod-shaped K2Ti4O9, (c)
SEM image of the rod-shaped TiO2, and (d) Powder XRD patterns of the rod-shaped
K2Ti4O9 and rod-shaped TiO2
Table 3.1 The indications of barium and titanium precursors used in the synthesis of the three-series products
Label Barium precursor Titanium precursor Morphology
BT-1 BaCO3 TiO2 Sphere
BT-2 BaO Rod-shaped TiO2 Cube-shape
27
Figure 3.2 Flowchart of the growth of rod-shaped TiO2
28
3-2 Characterization
3-2-1 X-ray diffraction
Phase analyses were examined by using powder XRD (model: MAC Sience, MXP18) at room temperature equipped with Cu-K% line of wavelength 1.5405Å in NSRRC, Taiwan. Data were recorded between the angle range of 20° < 2& < 60° with steps of 0.04°. The maximum voltage of the system is 30 kV with the maximum current 20 mA and rate of scanning is 4°/min. By comparing with the JCPDS data, the fitted peaks positions and corresponding reflection planes were used to calculate the lattice constants.
3-2-2 Scanning electron microscopy
The morphologies were investigated by using FE-SEM (model: HITACHI S-4000) in NDL.
29
3-2-3 Transmission electron microscopy
The morphologies and compositions were investigated by using TEM (model: Philips TECNAI 20) equipped with an energy-dispersive X-ray spectrometer (EDS) in NCTU office of research and development.
30
3-3 Refinement procedures
PeakFit is an automated nonlinear peak separation and analysis software package for scientists performing spectroscopy, chromatography and electrophoresis. It automatically finds and fits up to 100 peaks to a data set, at a time, enabling users to characterize peaks and find the best equation that fits their data. PeakFit can also enhance the data obtained from traditional numerical methods and lab instruments. PeakFit was originally developed by Ron Brown of AISN Software and distributed by Jandel Scientific Software in the late 1980’s but by January 2004, Systat Software acquired the exclusive worldwide rights from SPSS Inc. to distribute SigmaPlot and other Sigma Series products.
(1) Open PeakFit
Double-click the PeakFit icon ' Pop out the window
(2) Import the data
31
(3) Automatic Peak Detection and Fitting, Method III - Deconvolution
Click on the top of the window ' Pop out “AutoPlace and Fit Peaks” window
32
(4) Full Peak Fit with Graphic
Choose Peak Type ' Add or subtract the fitting peak points manually ' Click on the left-hand side of window ' Pop out “PeakFit Graphical Fitting” window ' Click Add Adjust ' Repeat 2nd to 4th steps until the r2 value is closest to 1
33
(5) Review Peak Fit
Click on the left-hand side of window ' Pop out review fit window
(6) Calculate lattice constant
Use 2dsin! = n" with ! is the degree derived from two peak fitting and " is the wavelength of the light source of powder XRD device to calculate d which is the lattice distance between a set of specific parallel planes
34
Chapter 4 Results and Discussion
4-1 Results of SEM, XRD and TEM
In the three-series products, BaO and BaCO3 were used as the barium
precursors and TiO2 with various morphologies were used as the titanium precursors.
The reaction time and temperature were all the same in the three-series synthesis processes, which were 1 h and 700 C, respectively. The SEM images shown in Figures 4.1 and 4.2 demonstrate that the shape of the products are related to that of the titanium precursors and the dissolution rate of both barium and titanium precursors extremely. The XRD patterns shown in Figure 4.3 verify that there are no detectable impurity peaks in the three-series products and each of them is tetragonal structure by fitting the overlapping (002) and (200) diffraction peaks. The high-resolution transmission electron microscope (HRTEM) image and selected-area electron diffraction (SAED) pattern shown in Figure 4.4 manifest that BT-3 was grown along the [001] direction and the lattice fringe shows the lattice constant a is about 4.01 Å.
35
Figure 4.1 SEM images and powder XRD patterns of the titanium precursors: (a) SEM image of the spherical TiO2, (b) SEM image of the rod-shaped K2Ti4O9, (c)
SEM image of the rod-shaped TiO2, and (d) Powder XRD patterns of the rod-shaped
36
37
Figure 4.3 Powder XRD patterns of the three-series products and JCPDS Card: (a) BT-1, (b) BT-2, (c) BT-3, and (d) JCPDS Card #81-2203
38
Figure 4.4 TEM image, HRTEM image with SAED pattern, and EDS spectrum of BT-3: (a) TEM image, (b) HRTEM image with SAED pattern, and (c) EDS spectrum
39
4-2 Comparison between BT-1 and BT-3
In the processes of BT-1 and BT-3, both of them used BaCO3 as the barium
precursors but the spherical TiO2 and rod-shaped TiO2 as the titanium precursors
respectively. According to the SEM images shown in Figures 4.1 and 4.2, the products have the same shapes as the used titanium precursors: The spherical TiO2
obtained the spherical BaTiO3; the rod-shaped TiO2 obtained the rod-shaped BaTiO3.
Hence, we can change the shape of the products by changing the shape of the precursors effectively. We can also change the size of the precursors to obtain the products with different sizes. Therefore, the larger the radii of the spherical TiO2
and rod-shaped TiO2 are, the larger the radii of the spherical BaTiO3 and rod-shaped
BaTiO3 are, and vice versa.
4-3 Comparison between BT-2 and BT-3
A prodigious result is that as we used BaO as our barium precursor that reacted with the rod-shaped TiO2 in the molten salt, we obtained BT-2 in contradiction with
the result of BT-3. Because of the “break-up” of the rod-shaped TiO2 when we
heated it individually in NaCl-KCl flux at 700 C for 1 h and the unchangeableness of BT-3 when we heated BT-3 in NaCl-KCl for another 1 h at 700 C, the shape change from rod-shape to cube-shape in BT-2 might be ascribed to the “break-up” of the rod-shaped TiO2 before or during the reaction.
40
We obtained the lattice constants a and c of BT-1, BT-2 and BT-3 in Table 4.1 by two-peak fit to the overlapping (002) and (200) diffraction peaks of Figure 4.5. The tetragonalities (c/a ratio) of BT-2 and BT-3, which are 1.00503 and 1.00443 respectively, are larger than that of the BT-1, which is 1.00366. All of their c/a ratios are larger than 1, which means!the unit cells of the three-series products are all in tetragonal structure, and obviously lower than that of bulk, which is 1.01128. This phenomenon may be attributed to the surface relaxation45. Since the particle sizes in a-direction of BT-1, BT-2 and BT-3 are all at the nanoscale and smaller than that of bulk, they will experience a surface relaxation and thus increase the a values. On the other hand, because the particle sizes in c-direction of both BT-1 and BT-2 are at the nanoscale and of BT-3 is at the microscale, which is similar to the microparticles (bulk), the behavior of the particle size in c-direction of BT-3 will be much like that of bulk and thus has the c value comparably closer to bulk, which is 4.035 Å, and larger than that of BT-1 and BT-2. Consequently, because all the three-series products have the larger a values and smaller c values than bulk has, the c/a ratios of BT-1, BT-2 and BT-3 will smaller than that of bulk. Furthermore, by comparing the separation between the (200) and (002) peaks with the c/a ratio, the closer the c/a value to unity, the shorter the separation between the two peaks is. As a result of the isotropic particle structure of BT-1 and BT-2, they would arrange randomly without dominant orientation on the substrate. Thus, the intensity ratio between the (200) and (002) XRD peaks would close to 1:2 due to the (200) and (020) peaks are inseparable shown in Figures 4.5(a) and (b). On the contrary, because BT-3 has the anisotropic particle structure, its (002) planes will lay on the substrate with the higher probability rather than standing erectly on the substrate. Therefore, the intensity of the (200) peak would much higher than that of the (002) peak in XRD measurement as shown in Figure 4.5(c).
41
Table 4.1 The refinement results of BT-1, BT-2 and BT-3
Label a(b) (Å) c (Å) c/a Vol. (Å3)
JCPDS (#81-2203) 3.990 4.035 1.01128 64.238
BT-1 4.00671 4.02138 100366 67.558
BT-2 4.00244 4.02256 1.00503 64.488
BT-3 4.01117 4.02892 1.00443 64.823
Figure 4.5 Two-peak fit of the powder XRD patterns at (200) and (002) peaks of the three-series products: (a) BT-1, (b) BT-2, and (c) BT-3
42
4-5 Proposed mechanism of molten-salt synthesis
Based on the above observations, the dissolution rate of the reactants in the molten salt plays an important role that affects the reaction rate and the morphologies of the products critically. For one thing, if both reactants are soluble in the molten salt, dissolution-precipitation mechanism may be the dominant mechanism—the product would be readily synthesized via precipitation from the salt containing the dissolved reactants—throughout the synthesis of BaTiO346; for another, if one reactant
is much more soluble than the other, in-situ transformation mechanism will be the dominant mechanism. The more soluble one would dissolve into the salt at the early stage of the reaction, then diffuse onto the surfaces of the less soluble reactant and finally react to form the product. According to this argument, we can infer that the dissolution rate in the molten salt of BaCO3 using in BT-3 is faster than BaO using in
BT-2 because the rod-shaped TiO2 can preserve the original morphology in BT-3 but
break up into several cube-shape in BT-2.
Being more precise to our synthetic mechanism of BaTiO3 in the molten salt,
the proposed synthesis schematic diagrams are provided and shown in Figure 4.6. The following are the details of the main steps: When the mixture of BaCO3, TiO2
and NaCl-KCl flux was put in the combustion boat at room temperature, the precursors existed in the solid form like the first illustration in the upper flow of the proposed schematic diagram (the dissolution rate of the barium precursor is faster than that of the titania). When we increased the temperature at a constant rate to the melting point (ca. 657 C) of NaCl-KCl flux, NaCl-KCl flux will transform into molten salt and act as a solvent where BaCO3 and TiO2 act as solutes dissolved inside.
Upon further heating, because of the faster dissolution rate of BaCO3 comparing with
43
readily to the periphery of TiO2 and then cover the entire surface of TiO2 to form the
BT-shell which was able to hinder the rod-shaped TiO2 from the break-up process.
Finally, BaCO3 would diffuse through the BT-shell and react with TiO2 completely
after heating. Thus, we derived the rod-shaped BaTiO3, which had the same
morphology as the used TiO2.
In the second flow of the proposed schematic diagram (the dissolution rate of the barium precursor is slower than that of the titanium precursor), the mixture of BaO, TiO2 and NaCl-KCl flux would experience the same processes like the first flow
before the transition of NaCl-KCl flux to the molten salt. Because the dissolution rate of BaO was lower than that of BaCO3, the rod shaped TiO2 would have the
chance to break up into several fragments from the grain boundaries in the molten salt before BaO dissociated and dissolved into the molten salt and formed a BT-shell outside the surface of the rod-shaped TiO2. As a result of the break-up process of
the rod-shaped TiO2 before the formation of BT-shell, we finally derived the
44
Figure 4.6 Proposed schematic diagram of the synthetic mechanism of BaTiO3 in the
molten salt: the upper flow is due to the faster dissolution rate of the barium precursor than that of the titanium precursor and the lower flow is due to the slower dissolution rate of the barium precursor than that of the titanium precursor.
45
Chapter 5 Conclusion
5-1 Conclusion
A simple synthetic process was developed for synthesizing morphology-controlled BaTiO3 nanostructures such as spherical, cube-shaped and
rod-shaped BaTiO3. It is shown that the initial shape of the titanium precursors can
critically determine the shape of the final products since the dissolution rate of the barium and titanium precursors play important roles in molten-salt synthesis. When we provided the spherical TiO2 as the precursor, we will obtain the spherical BaTiO3;
when we provided the rod-shaped TiO2 as the precursor, we will obtain the
rod-shaped BaTiO3 with BaCO3 as the barium precursor. However, when we used
another barium precursor, BaO, with slower dissolution rate, the rod-shaped TiO2
would break up into several cube-shaped TiO2 before reacting with BaO due to the
failure of forming the BT-shell to hinder the break-up of the rod-shaped TiO2 and thus
we obtained the cube-shaped BaTiO3. The powder XRD patterns show good quality
and crystallinity of BaTiO3 nanostructures and the SEM images show the
morphologies of the final products all match very consistently with the titanium precursors and the length of the rod-shaped BaTiO3 is about 20 $m.
5-2 Future works
Since we can synthesize BaTiO3 1D nanostructure using molten-salt synthesis,
the impending challenge for us to conquer is how to minimize its radius down to about 10 nm. The probable method is to lower the radius of rod-shaped titanium precursor and the heating temperature by choosing another appropriate eutectic
46
mixture of salt whose melting point is lower than NaCl-KCl flux. As a result, we can compare the size effect and the limit for retaining ferroelectricity of 0D with 1D nanostructure. Another topic worthy to study is to dope rare-earth ions into 1D nanostructure and observe the change in the phenomenon of up-conversion luminescence comparing with 0D nanostructure. It is likely that we have to choose the rare-earth ions whose dissolution rates are approximately similar to the used barium precursor in the molten salt. Therefore, the selective rare-earth ion will diffuse into the BT-shell with the used barium precursor simultaneously. In summary, the critical purpose for synthesizing 1D nanostructure is to study the difference between them and compensate the weakness of 0D structure. There are so many theoretical results have manifested some extraordinary properties of 1D nanostructure predominating over 0D structure but lack the proof of experiments. Consequently, we can first minimize the size of 1D nanostructure, control the homogeneity of the size in the same batch, and finally compare the properties of 0D with that of 1D nanostructure in the same size.
47
References
(1) Auciello, O.; Scott, J. F.; Ramesh, R., Phys. Today 1998, 51, 22.
(2) Scott, J. F. In Ferroelectric memories today, Prague, Czech Republic, Jul 12-16, 1999; Gordon Breach Sci Publ Ltd: Prague, Czech Republic, 1999; pp 247.
(3) Ahn, C. H.; Rabe, K. M.; Triscone, J. M., Science 2004, 303, 488. (4) Phule, P. P.; Risbud, S. H., J. Mater. Sci. 1990, 25, 1169.
(5) Kishi, H.; Mizuno, Y.; Chazono, H., Jpn. J. Appl. Phys. Part 1 - Regul. Pap.
Short Notes Rev. Pap. 2003, 42, 1.
(6) Scott, J. F., Science 2007, 315, 954.
(7) O'Brien, S.; Brus, L.; Murray, C. B., J. Am. Chem. Soc. 2001, 123, 12085. (8) Alivisatos, A. P., Science 1996, 271, 933.
(9) Hu, J. T.; Odom, T. W.; Lieber, C. M., Accounts Chem. Res. 1999, 32, 435. (10) Huang, M. H.; Mao, S.; Feick, H.; Yan, H. Q.; Wu, Y. Y.; Kind, H.; Weber, E.;
Russo, R.; Yang, P. D., Science 2001, 292, 1897.
(11) Thurn-Albrecht, T.; Schotter, J.; Kastle, C. A.; Emley, N.; Shibauchi, T.; Krusin-Elbaum, L.; Guarini, K.; Black, C. T.; Tuominen, M. T.; Russell, T. P.,
Science 2000, 290, 2126.
(12) Liang, W. J.; Bockrath, M.; Bozovic, D.; Hafner, J. H.; Tinkham, M.; Park, H.,
Nature 2001, 411, 665.
(13) Geneste, G.; Bousquet, E.; Junquera, J.; Ghosez, P., Appl. Phys. Lett. 2006, 88, 3.
(14) Hong, J. W.; Fang, D. N., Appl. Phys. Lett. 2008, 92, 3.
(15) Spanier, J. E.; Kolpak, A. M.; Urban, J. J.; Grinberg, I.; Lian, O. Y.; Yun, W. S.; Rappe, A. M.; Park, H., Nano Lett. 2006, 6, 735.
(16) Wang, Z. Y.; Suryavanshi, A. P.; Yu, M. F., Appl. Phys. Lett. 2006, 89, 3. (17) Urban, J. J.; Yun, W. S.; Gu, Q.; Park, H., J. Am. Chem. Soc. 2002, 124, 1186. (18) Joshi, U. A.; Lee, J. S., Small 2005, 1, 1172.
(19) Kang, S. O.; Park, B. H.; Kim, Y. I., Cryst. Growth Des. 2008, 8, 3180. (20) Hayashi, Y.; Kimura, T.; Yamaguchi, T., J. Mater. Sci. 1986, 21, 757. (21) Mao, Y. B.; Banerjee, S.; Wong, S. S., J. Am. Chem. Soc. 2003, 125, 15718. (22) Deng, H.; Qiu, Y. C.; Yang, S. H., J. Mater. Chem. 2009, 19, 976.
(23) Yoon, K. H.; Cho, Y. S.; Kang, D. H., J. Mater. Sci. 1998, 33, 2977. (24) Kimura, T.; Yamaguchi, T., Ceramics International 1983, 9, 13.
(25) Zhong, W. L.; Wang, Y. G.; Zhang, P. L.; Qu, B. D., Phys. Rev. B 1994, 50, 698.
48
(26) Pertsev, N. A.; Zembilgotov, A. G.; Tagantsev, A. K., Phys. Rev. Lett. 1998, 80, 1988.
(27) Cui, Y.; Wei, Q. Q.; Park, H. K.; Lieber, C. M., Science 2001, 293, 1289. (28) Peng, X. G.; Manna, L.; Yang, W. D.; Wickham, J.; Scher, E.; Kadavanich, A.;
Alivisatos, A. P., Nature 2000, 404, 59.
(29) Schrott, A. G.; Misewich, J. A.; Nagarajan, V.; Ramesh, R., Appl. Phys. Lett.
2003, 82, 4770.
(30) Ziemelis, K., Nature 2000, 406, 1021.
(31) Xia, Y. N.; Yang, P. D.; Sun, Y. G.; Wu, Y. Y.; Mayers, B.; Gates, B.; Yin, Y. D.; Kim, F.; Yan, Y. Q., Adv. Mater. 2003, 15, 353.
(32) Willert, M.; Rothe, R.; Landfester, K.; Antonietti, M., Chem. Mat. 2001, 13, 4681.
(33) Wang, W. Z.; Zhan, Y. J.; Wang, X. S.; Liu, Y. K.; Zheng, C. L.; Wang, G. H.,
Mater. Res. Bull. 2002, 37, 1093.
(34) Wang, Y.; Lee, J. Y., J. Phys. Chem. B 2004, 108, 17832.
(35) Wang, W. Z.; Xu, C. K.; Wang, G. H.; Liu, Y. K.; Zheng, C. L., Adv. Mater.
2002, 14, 837.
(36) Liu, Y. K.; Zheng, C. L.; Wang, W. Z.; Yin, C. R.; Wang, G. H., Adv. Mater.
2001, 13, 1883.
(37) Xu, C. K.; Zhao, X. L.; Liu, S.; Wang, G. H., Solid State Commun. 2003, 125, 301.
(38) Yang, Z. H.; Gu, Y. L.; Chen, L. Y.; Shi, L.; Ma, J. H.; Qian, Y. T., Solid State
Commun. 2004, 130, 347.
(39) Liu, H.; Hu, C. G.; Wang, Z. L., Nano Lett. 2006, 6, 1535.
(40) Wang, W. Z.; Zeng, B. Q.; Yang, J.; Poudel, B.; Huang, J. Y.; Naughton, M. J.; Ren, Z. F., Adv. Mater. 2006, 18, 3275.
(41) Tian, Y.; Chen, D. R.; Jiao, X. L., Chem. Mat. 2006, 18, 6088.
(42) Mao, Y. B.; Park, T. J.; Zhang F.; Zhou, H. J.; Wong, S. S., Small 2007, 3, 1122
(43) Byrappa K.; Ohachi T., Crystal growth technology 2002.
(44) Strohaver, R. A., A scanning electron microscope comparison of microfilied
fixed prosthodon 1987.
(45) Ishikawa, K.; Uemori, T., Phys. Rev. B 1999, 60, 11841.
(46) Eckert, J. O.; HungHouston, C. C.; Gersten, B. L.; Lencka, M. M.; Riman, R. E., J. Am. Ceram. Soc. 1996, 79, 2929.