行政院國家科學委員會專題研究計畫 成果報告
基於數位影像識別技術之結構健康監測系統之研究
研究成果報告(精簡版)
計 畫 類 別 : 個別型 計 畫 編 號 : NSC 98-2221-E-009-097- 執 行 期 間 : 98 年 08 月 01 日至 99 年 07 月 31 日 執 行 單 位 : 國立交通大學土木工程學系(所) 計 畫 主 持 人 : 洪士林 計畫參與人員: 博士班研究生-兼任助理人員:路勇奇 博士班研究生-兼任助理人員:林子軒 報 告 附 件 : 出席國際會議研究心得報告及發表論文 處 理 方 式 : 本計畫可公開查詢中 華 民 國 99 年 11 月 29 日
行政院國家科學委員會補助專題研究計畫
█ 成 果 報 告
□期中進度報告
基於數位影像識別技術之結構健康監測系統之研究
計畫類別:█ 個別型計畫 □ 整合型計畫
計畫編號:NSC98-2221-E-009-097-
執行期間: 98 年 8 月 1 日至 99 年 7 月 31 日
計畫主持人:洪士林
共同主持人:
計畫參與人員:陸勇奇、林子軒
成果報告類型(依經費核定清單規定繳交):█精簡報告 □完整報告
本成果報告包括以下應繳交之附件:
□赴國外出差或研習心得報告一份
□赴大陸地區出差或研習心得報告一份
□出席國際學術會議心得報告及發表之論文各一份
□國際合作研究計畫國外研究報告書一份
處理方式:除產學合作研究計畫、提升產業技術及人才培育研究計畫、
列管計畫及下列情形者外,得立即公開查詢
□涉及專利或其他智慧財產權,□一年□二年後可公開查詢
執行單位:國立交通大學土木工程學系
中 華 民 國 九十九 年 十 月 三十 日
中文摘要 傳統結構量測系統為接觸式之有線儀器設備,必須將儀器設備安裝於結構系統上,再 將各量測線材連接至數據擷取設備,並於安裝後試驗前進行各項檢測,需要大量的設備成 本與建置時間,而數位影像技術屬於非接觸式之量測技術,不需從結構試體上安裝相關設 備並佈置線材及連接設備,正逐漸被採用並進行相關研究。大多數的數位影像技術相關研 究採用一般之數位相機,雖然簡單方便,但普通數位相機或數位攝影機之動態錄影功能, 由於對普通使用者而言,其採樣頻率並不需要嚴格要求為固定,因此其影像之間隔時間並 無法達到較為準確之要求。故本研究採用價格較昂貴的高速相機,以使影像之間隔時間能 依據需求來設定,而獲得更準確的影像間隔時間。數位影像處理及分析一般應用在二維影 像,藉由電腦之高速計算,分析影格之間的變化,進而求得試驗結構之影像位移。數位影 像相關法計算影格區塊之間相關係數,以分析影格中試體相對位移像素,再搭配次像素分 析可進而求得次像素位移,以增加量測精度。本研究發展之數位影像量測系統,硬體配備 上包括高速數位相機、相機鏡頭、影像擷取卡、工業級電腦,軟體部份則包括高速數位相 機搭配之設定軟體、LabVIEW 8.5 以及 MATLAB 2007a,再搭配相關電腦程式,包括:動 態影像擷取程式、灰階影像轉存程式、影像強化程式、結構位移分析程式、邊緣偵測程式、 頻率分析程式等。本研究除了發展數位影像量測系統,也在本校結構大樓之小型震動臺及 大型震動臺分別做了多次實驗,甚至亦前往國家地震中心進行結構地震模擬實驗,除了獲 得許多地震中心提供的寶貴實驗資料,本系統亦同時獲得所需的影像資料,分析結果與地 震中心之LVDT 位移資料相當符合,也代表著本系統之確實可行。 關鍵字:數位影像相關法、次像素分析、頻率響應函數、結構健康監測
英文摘要
Conventional structural measurement system is based on contacted cable equipments installed on the structural system and many tests must be completed before experiment. Moreover, a large amount cost and build time were required for setting the traditional measurement system. In contrast, the digital imaging technology is non-contact scheme for measurement system and has been applied in diverse domains based on common purpose digital cameras. However, the shutter time for general digital cameras is not very accurate; hence, they can not reach the research needs. Herein, a high-speed digital camera which can set the exact shutter time is employed as measure requirements. In term of hardware, the proposed digital image measurement system includes high-speed digital camera, zoom lens, image capture card, and industrial computer. In term of software, application programs are developed based on LabVIEW 8.05 and MATLAB 2007a API. The scheme of digital image processing (DIP) can be utilized to rapidly calculate and analyze changes of corresponding pixels among frames and resolved the displacements of the measured structure. Also, the digital image correlation method is utilized to analyze the correlation coefficient of image blocks to estimate the displacement of structure. To improve the measurement accuracy, the approach of sub-pixel analysis is adopted for the integer displacement time history. Finally, the feasibility and robustness of the proposed digital image measurement system were assessed using a 1/8-scale three-storey steel-frame model in NCREE.
Meanwhile, an FRF-based damage detection approach was also employed to locate the damage location of the frame with different damage scenarios. The experiment results reveal that the proposed digital image measurement system is feasible and reliable non-contacted structural measurement system.
Keywords: digital image correlation method, sub-pixel analysis, frequency response function (FRF), structural health monitoring (SHM)
目錄 中文摘要 ... 1 英文摘要 ... 2 目錄 ... 3 一 前言 ... 4 二 研究目的 ... 7 三 文獻探討 ... 8 四 研究方法 ... 10 五 研究結果與討論 ... 16 六 結論 ... 27 參考文獻 ... 28
一 前言 現今的土木公共基礎建設,已遠比過去具有高度更高、跨度更大、斷面更小的特性, 而且材料之選用與使用,更是經濟節省,同時達到造型美觀上的要求;此時,監測系統之 有效性與靈敏性,將更加關係土木結構物之使用功能與服務品質。結構健康監測隨著日益 增加的地震、水災、風災、土石流等天然災害,也愈來愈突顯出其重要性。當自然災害造 成結構或生命財產的損失,才來進行後續的彌補或撫卹,是絕對無法被萬千民眾接受,因 此相關的結構監測系統,甚至是預警系統的需求,就是國內外學者所需致力研究之課題, 以及未來各領域之一致趨勢。 智慧建築與結構利用新型智慧材料,將其逐步應用在智慧感測系統(包含智慧結構健 康監測系統、智慧溫度空調控制系統、火災偵測系統等)、資訊通訊系統、電腦自動化控制 系統,可由圖一表示。結構健康監測系統屬於智慧感測系統之一部份,同樣亦是運用新型 而智慧之相關感測元件,來建構出一套適用之智慧監測系統。 Intelligent Sensor System Computer -Automation Control System
Intelligent Building and Structure
New and Smart Material Application
Information Communication
System
Structure Health Monitoring (SHM)
System Model
Sensor Unit Data Collection
And Transmission System Identification Damage Evaluation Appropriate Action Data process Unit 圖二 結構健康監測系統架構圖 智慧型結構健康監測系統一般由感測器單元、資料擷取與傳輸單元、資料處理單元、 系統識別與損壞評估單元所組成如圖二所示,主要用來評估結構物的健全度並監控與維護 結構物。結構監測系統主要利用透過長時間應力和勁度的衰減等來對結構物做出監測或是 判斷突發的事件對結構造成之損害程度。Kiremidjian 等學者(Kiremidjian et al.)並將結構監 測系統分為兩大類:(1)在結構上選擇某點量測其特徵值,比如說量測結構物的應變,再根 據其值對結構物的長期健康狀態做相關比對;(2)利用不同的參數以系統識別的方法判定結 構物的損害程度。智慧結構健康監測系統的最重要的就是前端的感測器,因為若是一開始 所獲得的資料不正確或是不能有效的感測到資訊,那對於後端系統識別與損壞評估而言就 失去意義,因此感測器對於結構監測系統來說是相當重要的一個因素。傳統的感測器主要 為將受測物體所擷取到的資訊轉換成電子訊號,此類感測器可以拆解為 3 個主要的部份 (Ruiz-Sandoval 2004):(1)感測元件(例如加速度計);(2)訊號狀態和處理(例如訊號放大、線 性化、補償、過濾等);(3)感測介面(例如用電線將其與其他電子裝置做連結)。而本研究主 要將傳統感測器,改由高速數位相機來取代,透過影像擷取卡將所擷取的影像儲存於電腦 中,再經過電腦程式分析數位影像,進而估算出結構物受力後之變形。而影像處理技術則 可以較低成本進行受測物體的變形量測,在日益精進的光學技術研發下,數位影像解析度
愈來愈高,使得量測精確度相對提高,因此採用數位影像處理技術已成為土木工程中日趨 成熟之應用。對於數位影像靜態的變形量測而言,只要二張變形前後的數位影像,藉由數 位影像處理分析,即可求得影像中特定位置之變形量。若要量測結構物的歷時變化,則可 由數位影片或連續影像中,逐步計算分析每二張數位影像之變化,進而繪出結構物之位移 變化歷時曲線。
二 研究目的 現今,智慧感測技術與資訊科技的進展使得結構智慧化監測變成可能,多數的結構已 建置有許多的先進的加速度計、速度計、光纖感測器等等的感測儀器。然而,在有限經費 的考量上,不可能在大範圍佈置大量的感測節點,且某些構件位置布設感測器也相當的不 易,而無線感測網路與數位影像的應用恰可補強這一部分的機能。因此,本研究將進一步 對影像處理技術於土木結構健康監測進行一系列之研究,發展數位影像識別技術之結構健 康監測系統,此系統將可以有效提高土木公共基礎建設之防災監測的能力。 傳統實驗量測系統需要大量的建置成本與建置時間,而採用數位影像技術之量測系統 有著省時快速、方便、非接觸式等優點,且光學技術日新月異,對於影像資料的解析度愈 見強大,得以更進一步提升效率及效能。只是對於動態影像錄影之快門,無法精確設定, 而本研究採用之高速數位相機,可自定所需之快門時間,以決定精確的影像取樣率。因此 本研究之目的將發展一個數位影像實驗量測系統,作為實驗量測位移之替代選擇,系統架 構如圖二所示。此系統運用高速數位相機搭配光學鏡頭,影像訊號由影像擷取卡抓取至工 業級電腦,經過電腦程式分析處理以獲得推估之位移歷時資料,若再配合其它分析軟體則 可進行結構健康狀態判別。因此,一個與傳統監測系統不同的數位影像結構健康監測系統 即可逐漸成形,不僅建置成本可以降低,同時建置時間也可大幅縮短,並能達到足夠的資 料精確度,以提供實際需要之應用。
三 文獻探討 目前國內外已有許多數位影像技術應用於各種不同領域之相關研究,除了應用在土木 工程結構,也包括天文監測、醫療檢測、產品品質控制及天氣預測等方面。同時由於奈米 科技的進步使得數位影像解析度愈來愈高,量測資料精確度得以更加提高。 Masanobu Shinozuka 等人(2000)針對數位影像處理技術應用於系統識別上,進行概念性 驗證(Proof-of-concept)之實驗,顯示出數位影像處理技術得以發展出有效的演算法進行系統 識別。Gongkang Fu 和 Adil G. Moosa (2001)以高解析度影像進行結構損壞檢測。A. Mazen Wahbeh 等人(2003)運用影像技術建立一個經濟而又強健的量測系統,直接而同時量測不同 位置之橋樑絕對位移歷時資料。Jong Jae Lee 和 Masanobu Shinozuka (2006)利用數位影像處 理技術即時量測橋樑位移。M. Meo 等人(2006)利用 GPS 即時量測橋樑運動位移,以小波模 態萃取技術(Wavelet Modal Extraction)分析橋樑之模態頻率及阻尼。Guobiao Yang 和 Kui Wu(2007)利用長焦距顯微數位相機取得樣本影像及目標影像,求解兩者影像區塊相關係數 之最大值,據以獲得位移量測數值。C. C. Chang 和 Y. F. Ji(2007)提出基於近景數位攝影及 電腦視覺原理之數位影像處理技術,利用二部數位攝影機量測二維或三維的振動響應,研 究結果可獲得相當準確之位移量測,使用之參考目標類似於西洋棋盤的四格黑白方格。施 明祥等人(2008)將數位影像相關法應用於橋樑動靜態變位之量測。
在結構監測應用方面的研究也相當的多(C. S. Fraser and B. Riedel,2000; G. Fu and A. G. Moosa,2001; G. De Schutter,2002; H. G. Sohn et al.,2005; H. G. Maas and U. Hampel,2006; Y. Ohnishi et al.,2006; T. Yamaguchi et al.,2008),Fraser 與 Riedel(2000)應用數位影像技術於鋼 梁溫度變化造成之變形量測,實驗環境從 1100 度的高溫回復到常溫。Fu 和 Moosa(2001) 提出使用高解析影像檢測結構損害之方法,使用機率損害指標進行交叉診斷識別結構勁度 損壞比率。Schutter(2002)使用顯微攝影機針對混凝土梁及版進行裂縫檢測試驗,並以一歷 史建築物實地檢測,與傳統檢測技術比較,該種結合數位影像及自動影像分析之方法,可 獲得很準確的結果。Hong-Gyoo Sohn 等人(2005)使用現成的數位相機為影像擷取設備,於 監測期間取得一系列不同時間點的數位影像,為了解決相機拍攝過程中造成的座標偏移, 該研究使用 modified iterated Hough transform (MIHT)演算法進行二維投影轉換,最後的結果 亦成功偵測裂縫變化及準確地數據。Hans-Gerd Maas 與 Uwe Hampel(2006)提出以影像處理
技術應用在工程材料實驗及大型結構監測最主要的優勢在於,可以同時針對大量的檢測點 進行高度自動化之量測。 Y. Ohnishi 等人(2006)提出以數位影像技術應用於邊坡監測,該 研究使用 Moore-Penrose generalized matrix inverse,由相機、量測點及數位影像的幾何關係, 在未設定任何控制點之下,求得量測點之間的距離。Tomoyuki Yamaguchi 等人(2008)提出 以影像為基礎之混凝土表面裂縫檢測方法,其檢測方式依據影像的亮度及形狀執行類似液 滲透現像之滲透處理程序,再執行雜訊處理,最後執行二元化得到純黑白之裂縫影像,由 量化分析之結果顯示該研究優於以往之方法。 一般而言,使用數位影像分析之硬體設備,可採用普通數位相機、數位攝錄影機,通 常都能擷取動、靜態數位影像,而在動態錄影方面,通常數位相機多以 30fps, 24fps 及 15fps, 就普通使用者而言,並沒有高速攝影之需求。然而,若需要量測高頻之訊號,以進行更複 雜的學術研究,則高速數位相機為一不可或缺之設備,同時其準確的快門時間設定,也提 供研究者更精確的量測數據。 在數位影像次像素估算研究方面,M. D. Pritt(1994)提出一個可以達到次像素層級之遙 測影像自動配準演算法。H. Shekarforoush 等人(1996)提出利用互功率頻譜,求出多相元件 之和即可估算出影像次像素偏移量。Kenji TAKITA 等人(2003)提出基於相位相關之高準確 次像素影像配準之演算法。Jun Zhang 等人(2003)提出一個高效率的以梯度為基礎之演算 法,結合廣泛使用的數位散斑相關法改善次像素配準。Murat Balci 和 Hassan Foroosh(2006) 提出在頻率域直接估算影像間次像素層級之偏移量。Li Fuwen 等人(2007)基於數位影像相 關法結合灰階值內插方法,以推估影像之次像素位移。
四 研究方法 本研究將發展一個蜂巢網格量測法之數位影像技術,應用於結構健康監測上,將六角 形蜂巢網格參考目標加諸於結構試體上,配合數位影像技術,擷取連續之數位影像進行分 析計算,以估算結構動態系統參數,並據此評估結構整體之健康程度及提供預警功能。 數位影像處理技術從 1960 年代開始萌芽,由於早期電腦系統尚未普及化,其計算處理 成本相對而言非常昂貴。到了 1970 年代開始,由於電腦硬體設備價格慢慢降低,使得數位 影像處理技術漸漸發展開來。而到了 2000 年以後,愈來愈快的電腦設備及訊號處理器讓數 位影像處理技術成為功能強大又非常便宜的處理工具。一般數位影像處理技術適用於影像 分類、影像特徵擷取、影像樣式識別、多尺度訊號分析…等,且已被廣汎應用許許多多不 同的學術領域。CCD 影像感測器由貝爾實驗室於 1960 年代末期研發初來,原本只是當成電 腦記憶元件使用,後來發現矽對於波長 1.1 微米以下的光具有高靈敏度,才轉為訊號處理 和擷取影像之技術。另一種 CMOS 的影像感測器架構在 1960 年代也已經具備,只是一直到 1993 年美國太空總署噴射推進實驗室的一批研究人員才研發出可供應用之元件。影像與圖 形辨識屬於資訊學門領域,而在數位光學技術日見成熟後,數位影像技術陸續被應用在其 它各個不同的學術領域,例如:醫學、農業、航太、機械、化學、土木…等。 本研究提出之蜂巢網格(圖三)量測法,此種六角網格之參考目標點之檢測,可以使 用影像處理技術中的邊線偵測找出各個網格的邊線,再由各邊線的交點決定其影像座標, 分別以 Pi,0 至 Pi,5 表示。比較二張數位影像的角點座標位置,即可快速決定各角點之位移, 分別以 di,0 至 di,5 表示,進而推估網格內各點位移及其應變。若分析高速擷取的連續數位 影像,則可求得各點之位移變化歷時曲線,進一步執行結構系統參數識別。
圖三 蜂巢網格參考目標 網格內部各點的位移數值估算簡述如下,若以蜂巢座標軸 u 及 w 為參考座標軸,並將 座標軸的界限設為 0~L,亦即將其長度限制在蜂巢邊長範圍內,則該參考座標軸將包含三 分之一個蜂巢網格平面,如圖四所示。另外三分之二則可分別由座標軸 v,w’以及 u’,v’予以 包含,這三組參考座標軸包含的三個平面的共同交點恰為蜂巢網格之中心點。對於 uw 座 標平面而言,其座標原點在 Pi,0的位置,將蜂巢角點位移調整如下: 0 , 5 , 5 0 , 4 , 4 0 , 3 , 3 0 , 2 , 2 0 , 1 , 1 0 , 0 , 0 0 i i i i i i i i i i i i d d d d d d d d d d d d d d d d d d 而蜂巢網格中心點的位移 dc則以下式估算之 6 5 0
i i c d d由 d1,dc,d4三點位移可繪製出二次拋物線,並推導出二次曲線方程式,再類推至 u 軸。 同理,亦可由 d2,dc,d5三點位移可繪製出二次拋物線,並推導出二次曲線方程式,再類推至 w 軸。由 uw 所形成的參考平面及加上位移維度即形成三維空間,求得空間上的曲面,即為 uw 各點之估算位移。 圖四 蜂巢座標軸與蜂巢關係圖,斜線部份表示座標軸涵蓋的平面 本研究為獲得更精細的影像變化,數位影像擷取設備使用影像擷取速率高達每秒 500 個影格之高速數位相機,如圖五,該機型為 Basler Vision Technologies 公司之 A504kc, 傳輸介面採用傳輸速率將近 2.4Gbps 的 Camera Link,搭配美商國家儀器的影像擷取卡 NI PCIe-1429。由於需要傳輸大量的影像資料並進行資料存取作業,因此亦需搭配高速儲存設 備,才能完全發揮其高速擷取之效能。由於高速的擷取速率,代表著相機曝光時間相對減 少,因此實驗過程中若能增加其它額外輔助光源,將可使獲得之數位影像品質予以提升, 進而提高資料分析準確度。
圖五 數位影像擷取設備 本研究主要利用蜂巢網格量測法於分析計算,以求得結構之準確位移,進而推估結構 動態系統參數,結合類神經網路及小波轉換,以判別結構系統之損壞程度。本研究擬以三 年的時間進行一系列數位影像技術於結構健康監測與遠端局部損壞檢測系統之相關研發工 作,以及實驗室模型動力試驗等相關研究工作。本研究之分析流程圖可見圖六。 圖六 研究流程圖
數位影像處理技術應用於結構位移量測時,常用的參考目標有圓點、方格、散斑等方 式,圓點參考目標只能決定單點位移,方格參考目標可決定四個角點位移,並進一步以線 性推估方格內其它點之位移。以隨機散斑的量測方式,則以兩張變形前後的數位影像中的 部份區塊內容進行相關係數計算或其它匹配演算法,找出其最大相關性以決定區塊之位 移,理論上可以找出影像對中所有點的位移,只是花費的計算時間成本較高。蜂巢網格量 測法則嘗試以六角網格為參考目標(如圖三),快速找出網格格點位移,再去推估網格內部 各點之位移。 圖五參考目標之實線部份表示實際塗佈於結構試體,虛線部份代表每個蜂巢網格的參 考座標軸。每個蜂巢網格以左下方為座標原點 p0,順時針方向分別為 p1~p5,假設已求得各 點 X 方向的位移 d0~d5,將各點位移減去 d0,使 p0點之位移為零。將各角點位移取其平均 當作網格中心點之估算位移 dc,以該中心點位移加上通過中心點直線的另外二點位移(例 如:d1,d4),由以下三點位移函數值,即可求得直線p1p4之位移二次曲線方程式 f(u)。 4 1 ) 2 ( ) ( ) 0 ( d L f d L f d f c 令 f(u)au2buc 將上述三點代入方程式求解未知數 a,b,c,即可求得 1 4 1 2 2 4 1 2 4 ) 3 ( 2 2 ) ( ) ( u d L d d d u L d d d u f c c 同理,直線p5p2之位移二次曲線方程式 f(w)如下 5 2 5 2 2 2 5 2 4 ) 3 ( 2 2 ) ( ) ( u d L d d d u L d d d w f c c 將 f(u)曲線方程式的曲率保留,重設一方程式如下 c bu u L d d d u g c 2 2 4 1 2 2 ) ( ) ( u 軸的兩點位移函數值如下 5 0 ) ( ) 0 ( d L f d f 將其代入方程式求解未知數 b,c,即可求得
0 4 1 0 5 2 2 4 1 2 2 ) ( 2 2 ) ( ) ( u d L d d d L d d u L d d d u g c c 又因為先前已經將 d0位移調整為零,因此上式可簡化如下 u L d d d L d u L d d d u g c c 2 2 ) ( 2 2 ) ( ) ( 2 5 1 4 2 4 1 上式即為 u 軸各點之估算位移方程式,同理,w 軸之方程式則如下 u L d d d L d u L d d d w g c c 2 2 ) ( 2 2 ) ( ) ( 2 1 5 2 2 2 5 利用 f(u),f(w),g(u),g(w)即可推算出 uw 座標軸涵蓋的三分之一個蜂巢網格的各點位移, 其它各個蜂巢網格亦可使用此法估算其位移。至於每個蜂巢網格周圍空白處,由於蜂巢角 點均勻分佈,故亦可取得正確適當的六個角點,估算出空白蜂巢網格之各點位移。因此, 只要在處於蜂巢網格涵蓋之表面,皆能使用此法估算出表面位移。
五 研究結果與討論 5.1 數位影像量測系統架構 本研究主要硬體設備包括:結構試體、高速數位相機、影像擷取卡、工業級電腦,整 體系統架構圖如下所示。首先於結構系統上佈設蜂巢網格標記做為參考目標,以地震模擬 振動臺施加模擬地震力於結構試體上,產生結構變位,藉由高速數位相機擷取數位影像, 透過訊號傳輸線至影像擷取卡,儲存於工業級電腦的高速儲存設備。影像資料蒐集完畢後, 再利用 Matlab 及 LabVIEW 等電腦軟體進行分析,產生結構試體之位移變化歷時曲線,並 利用快速傅立葉轉換及小波轉換,於頻率域中進行結構損壞分析。 圖七 數位影像處理技術於結構系統量測架構圖 5.2 數位影像漏失補償 本研究利用高速數位相機,由影像擷取卡將大量影像資料傳送至工業級電腦進行分 析,然而由於資料量龐大導致資料儲存過程當中,有部份影格資料會發生遺漏之情況。經 由程式記錄下所遺漏之影格編號,再於分析過程中,以內插法予以補償,不致於產生訊號 偏移之狀況,以提高後續訊號分析之準確度。以 1/8 比例三層樓剛構架實驗的結果,若不 管遺漏之影格,則所求得之頻率為 1.847654298 ,經過補償之後所求得之頻率則為
1.835517218 ,與 LVDT 所求得之頻率為 1.836330953 比較,發現確實可以提高識別的準 確度。
5.3 結構損害評估方法
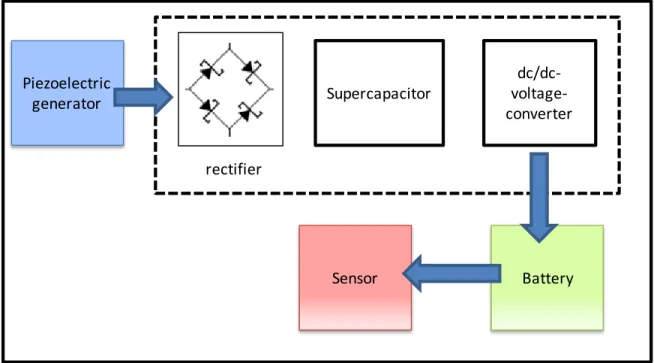
本研究採用研究團隊先期使用之頻率響應函數(Frequency Response Function, FRF)或是 頻率響應函數曲率(Frequency Response Function Curvature, FRFC),作為結構健康監測方 法,此法又稱為實驗模態法,主要的優點是不需要進行費時的系統識別來求出結構的模態 參數。 頻率響應函數與頻率響應函數曲率法:一個多自由度剪力屋架結構系統可以表示如式 (1)所示: (1) 其中 , 與 分別為 質量、阻尼與勁度矩陣。 與 分別為 的時變位移向量與外載重向量。 , 與 可以表示成 (2) (3) (4) 其中, mi, ci,與 ki 分別為第 i 個自由度的質量、阻尼與勁度。 而外力與解可以表示成以下形式: (5)
其中{f}與[1]為 為與時間無關的頻率域的振幅,則動力方程式可以改寫成 (6) (7) 其中 是 結構系統的位移響應矩陣,則多自由度的頻率響應函數通式 可以表示成 (8) 其中, 為外力 f 作用在 q 點時結構在 p 點的位移反應轉換成頻率域的振幅。基本上頻率
響應函數曲率法(Frequency Response Function Curvature (FRF curvature))是由模態曲率 (Mode Shape Curvature Method)延伸而來。頻率響應函數曲率法可以表示為:
(9) 式中 在位置 i 的 FRF 值對應每個外力輸入位置 j; h 為量測點 i 與 i+1 間 的距離。 FRF Curvatures 在量測點 i,依所選的頻率的絕對差值為式(10)。 (10) 如圖八所示,當結構在沒壞的狀況下其 FRF 的圖形幾乎是吻合的,而圖九明顯的指出 結構破壞前後的狀態。由圖上可以知道即使在不同的外力激勵下,還是可以得到好的偵測 結果,該法可以適合用在地震與颶風等天然災害上。
0 1 2 3 4 5 6 0 2 4 6 8 10 12 14 M agn it u d e of F R F Frequency el-50-undam-1F kobe-50-undam-1F 圖八 不同地震外力下三層樓模型的 FRF
0 1 2 3 4 5 6 7 0 2 4 6 8 10 12 14 M a g n it u de of F R F Frequency el-50-undam-1F kobe-50-damaged-1-1F 圖九 損壞與未損壞之結構之 FRF 利用(10)式,圖十(a)顯示不同外力激勵下完好結構的絕對差值,結果顯示,當結構沒 壞的時候即使外力不同,其圖形依然保持相似的狀態。比較圖十(a)和圖十(b)可以很明顯的 看到損害的差異。 圖十 (a) FRF 的絕對差值(結構未損壞) (b) FRF 的絕對差值(結構損壞) 5.4 實驗數據數值分析 本研究依據所發展之數位影像量測系統,進行各種相關實驗以驗證本系統之可行性與 效能,分述如下。 5.4.1 三層樓小型剛構架 為了初步檢測及驗證本系統,本研究採用一個 1/8 比例之三層樓剛構架,置於小型震 0 0.2 0.4 0.6 0.8 1 1.2 1 2 3 4 5 6 Ab so lu te FRF Di ff er en ce Node Excitation A Excitation B Excitation C 0 0.5 1 1.5 2 2.5 3 3.5 4 4.5 5 1 2 3 4 5 6 Ab so lu te FRF Di ff er en ce Node Unamaged Damaged (a) (b)
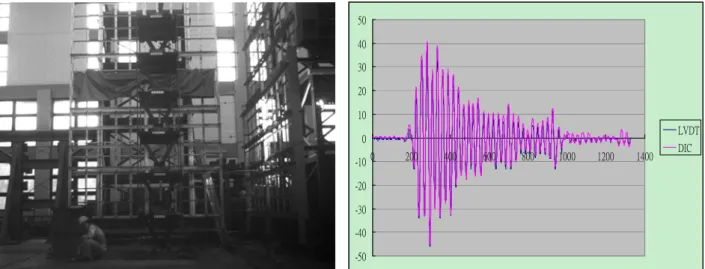
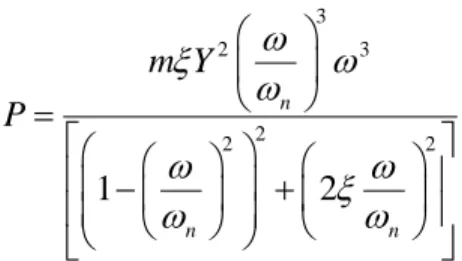
動平台來進行實驗測試。此實驗之振動平台為 Quanser 的 Shake Table II 振動平台,為一個 設計優良且具有良好控制界面的實驗震動平台,此剛構架每層質量為 3.8 kg,每一根梁柱 之斷面積為 0.8 cm2 ,每層樓高為 0.4m。圖十二為實驗構架二樓之 LVDT 量測之位移歷時曲 線及採用本系統所量測之位移歷時曲線。由圖中可以看出 LVDT 與本系統量測之位移資 料,不論是峰值與波形都相當的一致。表一為 LVDT 與本系統量測之各樓層前二個模態頻 率之比較,誤差顯示本系統量測結果與 LVDT 量測之模態頻率相當接近,可證明該數位影 像實驗量測系統之效能。本次實驗量測所得各樓層位移歷時曲線,顯示於圖十三,為模擬 結構損壞造成結構勁度改變,將層間柱變更為勁度較小的柱,量測所得位移歷時曲線如圖 十四所示。單純從位移歷時曲線來看,無法清楚判別結構之損壞,但若將訊號經由快速傅 立葉轉換後,從時間域的訊號轉換為頻率域的訊號,再利用上述結構損壞評估方法,即可 判別出結構已有損壞,而且是損壞在三樓的位置。 圖十一 三層樓剛構架(1/8 比例)
Displacement Time History -3 -2 -1 0 1 2 3 0 500 1000 1500 2000 2500 1sec/100 cm LVDT
Displacement Time History
-3 -2 -1 0 1 2 3 0 500 1000 1500 2000 2500 1sec/100 cm DIC 圖十二 LVDT 與數位影像技術量測之位移歷時曲線 表一 LVDT 與數位影像技術量測各樓層振態頻率比較 樓層別 LVDT DIC Error 1st Mode 1F - 1.846891 - 2F 1.836331 1.847582 0.6127% 3F - 1.847654 - 2nd Mode 1F - 5.495731 - 2F 5.427729 5.498102 1.2965% 3F - 5.498521 -
Displacement Time History (3F) -4 -3 -2 -1 0 1 2 3 4 0 500 1000 1500 2000 2500 1sec/100 cm DIC
Displacement Time History (2F)
-3 -2 -1 0 1 2 3 0 500 1000 1500 2000 2500 1sec/100 cm DIC
Displacement Time History (1F)
-2.5 -2 -1.5 -1 -0.5 0 0.5 1 1.5 2 2.5 0 500 1000 1500 2000 2500 1sec/100 cm DIC
Displacement Time History (BASE)
-2 -1.5 -1 -0.5 0 0.5 1 1.5 2 0 500 1000 1500 2000 2500 1sec/100 cm DIC 圖十三 正常結構所量測之位移歷時曲線
Displacement Time History (3F) -4 -3 -2 -1 0 1 2 3 4 0 500 1000 1500 2000 2500 1sec/100 cm DIC
Displacement Time History (2F)
-3 -2 -1 0 1 2 3 0 500 1000 1500 2000 2500 1sec/100 cm DIC
Displacement Time History (1F)
-2.5 -2 -1.5 -1 -0.5 0 0.5 1 1.5 2 2.5 0 500 1000 1500 2000 2500 1sec/100 cm DIC
Displacement Time History (BASE)
-2 -1.5 -1 -0.5 0 0.5 1 1.5 0 500 1000 1500 2000 2500 1sec/100 cm DIC 圖十四 三樓層間柱勁度減少所量測之位移歷時曲線 5.4.2 六層樓縮尺結構模型試驗 本研究將所發展的數位影像量測系統於國家地震中心的六層樓結構縮尺模型進行震動 台試驗,以確認本量測系統在較大型結構體上之可行性及效能。模型尺寸與蜂巢網格標記 佈置之實體構架照片如圖十五所示。結構損害的模擬作法是利用在柱子上切割裂縫,圖十 六為損害的斷面圖,損害案例則如表二所示。
圖十五 六層樓鋼構架及蜂巢網格標記佈置圖
(a) (b) (c)
(d) (e)
表二 損害案例
Damage scenario case Description
Undamaged scenario case1 Undamaged Structure excited by 100gal
El Centro earthquake input.
Undamaged scenario case2 Undamaged Structure excited by 50gal
El Centro earthquake input.
Damage scenario 1
Reduced 3.75 cm width in the medium height of each column at 1st floor excited by 100gal El Centro earthquake input.
Damage scenario 2
Reduced 7.5 cm width in the medium height of each column at 1st floor excited by 100gal El Centro earthquake input.
Damage scenario 3
Reduced 7.5 cm width and 6mm thickness in the medium height of each column at 1st floor excited by 100gal El
Centro earthquake input.
Damage scenario 4
Reduced 12 cm width in the medium height of each column at 3rd floor excited by 100gal El Centro earthquake input.
利用數位影像相關法量測各樓層受力後之位移歷時,採用 5.3 節的損害評估法可以有 效的識別出結構損害的位置。由圖十七可以看出,利用該評估方法可以有效的識別結構損 害的樓層,由圖中可以看出最高的指標值出現在 3 的位置,表示該結構於三樓發生損壞。 經由資料正規化之後,可以更加清表示損壞的樓層位置,如圖十八所示。
0 0.05 0.1 0.15 0.2 0.25 1 2 3 4 5 6 Index of substructure Su bF R FD I
Damage scenario 4(Damaged on 3rd floor)
圖十七 結構損害案例評估結果 0 0.05 0.1 0.15 0.2 0.25 1 2 3 4 5 6 Index of Substructure Su bF R FD I Damage scenario 4 圖十八 結構損害案例評估結果:正規化後
六 結論 本計畫為一年期之計劃,主要利用數位影相關法及蜂巢網格標記發展一實用之結構實 驗量測系統,以應用於結構健康監測之上。目前的研究結果為已可依據高速相機拍攝含蜂 巢網格標記之連續影像,分析估算實驗構架在模擬地震作用下所產生之各樓層位移,並能 推估至次像素精度以下。本研究採用之高速相機採樣率高達 500frame/sec,對於結構破壞瞬 間的檢測有一定之優勢,然而由於高速採樣對應的大量儲存資料,在資料傳輸速度有其瓶 頸存在,因此在高速採樣下只能盡量擷取較小之影像範圍,以求降低資料量,避免資料嚴 重遺漏。除此之外,高速採樣造成的結果是相機快門時間變短,也就是曝光時間變少,因 此必須提供足夠的光源於試體上,否則將會降低影像資料解析出來之精確度。初步獲得之 量測數據結果,與 LVDT 有線設備所量測進行比較,數值均方根誤差大約在 2%至 4%之間, 但若將時間序列資料經由 FFT 轉換至頻率域,在頻域峰值之識別上,則可達到相當高的準 確度。因此,本系統之結果確實能夠被應用在結構損壞的識別,進而整合為一套結構健康 監測系統。本研究可利用邊緣偵測程式找出蜂巢標記所在位置,以決定各樓層分析位移之 參考區塊位置及大小,配合數位影像相關法估算整數像素之位移,再利用像素切割及分析, 進一步推估次像素位移,以實現更準確之結構位移量測。此外,本研究已於國內外之結構 相關研討會,各發表一篇論文,後續當可持續發展,以求更深入研究數位影像在結構實驗 之應用,而在次像素之解析上亦可再強化,以改進實驗數據之精確度,除了加強精度外, 也可運用高速平行運算之技術,以進一步加快系統之計算時間。
參考文獻
1. A. Mazen Wahbeh, John P. Caffrey and Sami F. Masri (2003) “A vision-based approach for the direct measurement of displacements in vibrating systems”, Smart Materials and Structures 12 pp.785–794.
2. Castleman K. R. (1998). Digital Image Processing, Prentice Hall, Inc.
3. Clive S. Fraser, Bjorn Riedel (Vol.55 2000). "Monitoring the thermal deformation of steel beams via vision metrology", ISPRS Journal of Photogrammetry & Remote Sensing Vol.55 2000 pp.268-276.
4. G. De Schutter (2002). "Advanced monitoring of cracked structures using video microscope and automated image analysis", NDT&E International Vol.35 pp.209-212.
5. Gongkang Fu, Adil G. Moosa (2001). "Structural damage diagnosis using high resolution images", Structural Safety Vol.23 pp.281-295.
6. H. Nyquist (1928). “Certain Topics in Telegraph Transmission Theory”, AIEE Trans 1928 pp.617-644.
7. Hans-Gerd Maas, Uwe Hampel (2006). "Photogrammetric Techniques in Civil Engineering Material Testing and Structure Monitoring", Photogrammetric Engineering & Remote Sensing Vol.72 No.1 (2006).
8. John F. Haddon, Martin Schneebeli, Othmar Buser (1997). “Automatic Segmentaion and Classification Using a Co-occurrence Based Approach”, Imaging technologies : techniques and applications in civil engineering : proceedings of the second international conference pp.175-184.
9. Jong Jae Lee, Masanobu Shinozuka (2006). “A vision-based system for remote sensing of bridge displacement”, NDT&E International Vol.39 pp.425–431.
10. Jong Jae Lee, Masanobu Shinozuka (2006). “Real-Time Displacement Measurement of a Flexible Bridge Using Digital Image Processing Techniques”, Experimental Mechanics Vol.46 pp.105-114.
11. Jong-Jae Lee, Yoshio Fukuda, Masanobu Shinozuka (2006) “Dynamic Displacement Measurement of Bridges Using Vision-based System”, Smart Structures and Materials 2006. 12. Ken P. Chong, F.ASCE, Nicholas J. Carino, M. ASCE and Glenn Washer (2001). “Health
monitoring of civil infrastructures”, Health Monitoring and Management of Civil Infrastructure Systems, 2001 pp.1-16.
13. Kiremidjian, A. S., Straser, E. G., Meng, T., Law, K., and Sohn, H. (1997) "Structural Damage Monitoring for Civil Structures." Proc. Int. Workshop on Struc-tural Health Monitoring,Stanford, CA, 1997. pp.371-82.
14. M. Meo, G Zumpano, Xiaolin Meng, Emily Cosser,Gethin Roberts, Alan Dodson (2006). "Measurements of dynamic properties of a medium span suspension bridge by using the wavelet transforms", Mechanical Systems and Signal Processing Vol.20 pp.1112–1133.
15. M. S. Agbabian, et al. (1990), “A System Identification Approach to the Detection of Structural Change”, Journal of Engineering Mechanics Vol.117 No.2 pp.370-390.
16. Masanobu Shinozuka, Hung-Chi Chung, Jianwen Liang (2000) “Digital Image Processing for System Identification”, Smart Structures and Materials 2000.
17. Michel Kuntz, Marc Jolin, Josee Bastien, Fabien Perez, and Francois Hild (2006). "Digital image correlation analysis of crack behavior in a reinforced concrete beam during a load test", Can. J. Civ. Eng. Vol.33 pp.1418-1425.
18. Michel Kuntz, Marc Jolin, Josee Bastien, Fabien Perez, and Francois Hild (2006). "Digital image correlation analysis of crack behavior in a reinforced concrete beam during a load test", Can. J. Civ. Eng. Vol.33 pp.1418-1425.
19. P. Cawley, R. D. Adams (1979), “The location of defects in structures from measurements of natural frequencies”, The Journal of Strain Analysis for Engineering Design Vol.14 No.2 pp.49-57.
20. Ruiz-Sandoval (2004). "“SMART” SENSORS FOR CIVIL INFRASTRUCTURE SYSTEMS" University of Notre Dame, Indiana.
21. Sangwook Lee, Luh-Maan Chang , Miroslaw Skibniewski (2006). Automated recognition of surface defects using digital color image processing, Automation in Construction Vol.15 pp.540-549.
22. Tamal Bose (2004). Digital Signal and Image Processing, Wiley.
23. Tomoyuki Yamaguchi, Shingo Nakamura, Ryo Saegusa, Shuji Hashimoto (2008) “Image-Based Crack Detection for Real Concrete Surfaces”, IEEJ Trans 2008; 3: pp.128–135.
24. William K. Pratt (2007). DIGITAL IMAGE PROCESSING PIKS Scientific Inside,Wiley-Interscience.
25. Woodhouse N G, Robson S,Eyre R (1999). "Vision metrology and three-dimensional visualization in structural testing and monitoring", The Photogrammetric Record Vol.16(94) p.625-641. 26. 林金寶(2003). 影像處理及辨識理論與實務, 宏友. 27. 施明祥、童士恒、宋文沛、郭瑞昭(2008), “數位影像相關係數法在橋梁動靜態變位監 檢測之應用", 土木水利 Vol.35 Issue.5 pp.64-71. 28. 繆紹綱(2003). 影像處理—活用 Matlab , 全華. 國外研討會
[1] Shih-Lin Hung,and Yung-Chi Lu (2010), The study of combining hive-grid target with sub-pixel analysis for measurement of structural experiment, In Computing in Civil and Building Engineering, Proceedings of the International Conference, W. TIZANI (Editor), 30 June - 2 July, Nottingham, UK, Nottingham University Press.
國內研討會
[1] 陸勇奇、洪士林,「蜂巢網格標記結合數位影像相關法於結構實驗量測之應用」,98 年電子計算機於土木水利工程應用研討會,中華大學。
出席國際學術會議報告
報告人姓名 陸勇奇 報告日期 2010/07/07 系所及年級 土木所博五 核定文號 NSC 98-2221-E-0009-097 連絡電話 0922092686 電子信箱 [email protected] 會議期間 2010/06/30~2010/07/02 會議地點 英國 諾丁罕 UK Nottingham 會議名稱 (中文) 第十三屆電子計算機在土木工程國際研討會(英文) 13th International conference on Computing in Civil and Building Engineering
發表論文題目
(中文) 結合蜂巢網格標記與次像素分析於結構試驗量測之研究
(英文) The study of combining hive-grid target with sub-pixel analysis for measurement of structural experiment
(一)
參加會議經過:
2010 年第十三屆電子計算機在土木工程國際研討會在英國諾丁罕舉行, 會議期間為民國九十九年六月三十日至七月二日共計三天,來自世界各地,包括 四十個國家、五百三十二位不同的作者及三百零一篇論文,除了土木學術界,也 有業界人士及其它領域學者參加。這是我第一次出席國際研討會,也是第一次搭 乘十幾個小時的長途飛行旅途,所有交通行程都是自己預先上網查詢,並初略規 劃預計搭乘的交通工具及時間。本次旅程搭乘長榮航空飛往倫敦希斯洛機場,中 途經泰國曼谷轉機。出發時間為上午九點,加上轉機的時間,大約花費十七個小 時才到達倫敦,時差有七個小時,因此到達希斯洛機場的時間大約晚上七點鐘。 完成出關手續後,迅速前往地鐵站。由於希斯洛機場並沒有直達諾丁罕的火車, 因此必須搭地鐵前往 St. Pancras,再轉搭火車至諾丁罕車站。倫敦的地下鐵四通 八達,非常方便也相當快速。由機場到 St. Pancras 大約一個小時的行程,到達 St. Pancras 的地鐵站,即匆匆前往 St. Pancras 火車站購買火車票,英國的票價與 台灣非常不一樣。以 St. Pancras 到 Nottingham 而言,單程票價 49.3 英磅,來回 票價則是 50.3 英磅,只有相差 1 英磅。這段行程大約二個小時,到達諾丁罕火 車站時已經是十一點十五分,因此搭計程車直接前往諾丁罕大學,大約七、八公 里花費 8.8 英磅,整體而言英國的交通費用比台灣昂貴許多。後來才知道,如果 搭公車只要 1.6 英磅,只是時間已經太晚。計程車到達學校的招待所已經將近十 二點,櫃台人員即將下班,但仍順利完成 check-in 手續。本次研討會,主辦單位 有開放幾棟宿舍讓與會人員訂房,一個晚上 48 英磅,三天會議期間我都住在學 校提供的宿舍。第一天早上註冊後即舉行開幕會議,並由會議主辦單位致詞,及 學者論文報告。我是安排在第三天報告,由於第一次出國以英文報告論文,因此 一直利用空閒時間練習,以期順利完成英文口頭報告。會議中可以看到來自各國 的學生或者學者報告,各有優缺點,也提醒自己在報告時該注意的地方。由於是第三天的最後一個 session,我又擔心趕不及航班,因此有先行告訴主辦單位, 調整順序為第一個報告。報告過程順利完成,但是自己對於問題的回答,並不是 很滿意,我想自己還有很多進步的空間,也讓自己更有學習的衝勁,期待未來能 更加提昇自己的英語相關能力。這次研討會認識了一些其它學校的老師、學生, 像是大陸、日本、韓國不同地方,當然也包括台灣與會人士。在每天會議結束後 的晚上空閒時間,自行搭乘公車前往市區走走,看看當地有相當歷史的建築與建 設,在這裏似乎大家過得滿悠閒,而不像台灣總是行色匆匆。諾丁罕在英國不算 是大城市,因此並沒有看到什麼高樓大廈,路旁看到的小型社區幾乎都是二、三 層的傳統建築,即使是辦公大樓,也絕大部份沒有超過十層樓的建築,交通並不 會很擁擠,當行人要穿越馬路時,則自行按下紅綠燈按鈕,等待號誌變換,行車 規矩非常良好,綠燈的時候不用擔心會有車子衝過來。公車種類很多,從 Nottingham 到市區只要 1.6 英磅,比計程車便宜多了。大街上看起來都很乾淨, 相信是一般民眾都很守規矩,不會任意破壞環境,這是值得我們學習的地方。 (二)
與會心得:
這次參加這個會議,是我第一次於國外參加的會議,有蠻多心得的。我深深認為 多練習一定會較為順利的,這次的報告有一、兩頁不太平順,雖然表現的不是非 常完美,但是對於英文口頭報告有了一定的體驗,對於爾後的自信度有了相當的 提昇。因此不管有沒有信心講好,都應該有機會出國口頭發表論文,讓自己有機 會多增長見聞,除了可以認識各國的專家學者也可以加強自己的國際觀與英文表 達能力。另外,在會議中你可以看到各國所做的研究,可以看到有比你差有也比 你好的研究。在國外念書的學生,英文普遍來說都不錯,但也會覺得有些並不是 那麼的好,我想有可能也是常跟中國學生接觸而少練英文吧。這次出國大大增加 了國際觀,也給自己相當多的刺激,除了英文要加強之外,國外學者在學術研究 上的嚴謹與系統方法也是值得我們學習的。在與國外唸書的同學聊天後,發現,在國外的修課與研究壓力,比起台灣真是大蠻多的,更加深了我要更加用功與努 力的動力。這次難得的體驗讓我對未來研究更加充滿鬥志與熱情,在國際化時 代,有機會應當常常踏出國門,讓自己的視野更加的開闊,也可以讓本身的研究 與國際接軌。 (三)
攜回資料:
一. 論文摘要全集 二. 會議議程 三. 論文摘要及全文電子檔(隨身碟) (四)結論:
一. 電腦技術在土木工程的應用及整合已是國際土木界重視的研究,包括 Building Information Modeling、Industry Foundation Classes。
二. 此會議乃是資訊技術在土木工程應用交流的重要場合。 三. 此次會議給了學生許多寶貴的經驗,對當前電腦技術應用於土木 工程有更深切的體認。 四. 建議讓更多的同學能夠多參與國際學術會議進行報告,以提昇個 人國際觀及學術研究國際化。 五. 建議國科會能夠提高補助的金額,減輕學生負擔,以提高出國意 願。 六. 多出國報告可以增加國際視野與英文口語溝通能力。
Abstract
This study presents a digital image processing technique, by integrating sub-pixel analysis using digital image correlation method with a novel hive-grid target, for the measurement of structural experiment data. First, a numerical simulation of photography experiment at short range is employed to validate the feasibility of proposed approach. Herein, the simulation image caught from digital speckle and hive-grid target are compared, and the measured time-history displacement of simulation image is computed by the digital image correlation and edge detection methods. The results reveal that, via the digital image correlation method with hive-grid target, the measured time-history displacement at specific position can be analyzed accurately. Following, the experimental data gained from LVDT and digital camera for a six-storey steel frame at National Center for Research on Earthquake Engineering (NCREE) in Taiwan is used to verify the performance of the proposed approach. The measured time-history displacements of the steel frame are converted into frequency domain via Fourier Transform and Wavelet Transform schemes. The results revealed that the relative error between data from LVDT and analyzed data from digital image correlation is below 1% on frequency domain. Herein, the sampling rate of digital camera is lower than LVDT, because high sampling rate led to underexposure and large data storage. The frame rate of common digital camera is about 30 frames/sec nowadays, however the high speed digital camera can overcome this restriction. The limitation of high sampling rate is exposure time and data storage. The experimental results of numerical simulation and shaking table test revealed that digital image correlation method with hive-grid target is accurate in high resolution images.
Keywords: hive-grid target, digital image correlation method, sub-pixel analysis.
1
Introduction
In general, the measurement device is wired device which is installed on structural and connected to data acquisition. It spent much time at initial stage included setting up and configuration. After wireless technology is developed, the measurement work is easier. The measurement data was gained through radio waves, but packet loss and power usage is an issue to be overcome. Nowadays, the digital image analysis technology is used in many different domains and studied in a recent decade. The optical image facility has advanced year by year. The accuracy of image sensor could be improved in using telescope lens, and high frequency of structure could be measured by high speed digital camera.
The study of combining hive-grid target with sub-pixel analysis for
measurement of structural experiment
Shih-Lin Hung & Yung-Chi Lu
Professor ,Department of Civil Engineering, National Chiao-Tung University, TW Ph.D. Student ,Department of Civil Engineering, National Chiao-Tung University, TW
The digital image processing and analysis which solved alteration of images by computer is usually applied on two dimensional images. The specified target is painted on structure for the digital image processing, and no more things were installed on building or bridge. The digital camera or video recorder acquired images of structure from remote location. The digital image correlation is a common method for solving the variation of images. The image correlation coefficient was calculated, and image displacement was estimated. The sub-pixel analysis can improve the accuracy of result. At last, the measured time-history displacements are calculated and analysed.
2
Method
The study developed a digital image measurement system which included hardware, software and some programs coded by author.
2.1 Hardware
The hardware of the digital image measurement system comprises: high speed digital camera (Basler A504kc, sampling rate: 500Hz), camera lens, image acquisition card, high level computer. The digital camera is a color model whose image-type is Bayer Pattern, we need to decode and get suitable gray images. The high level computer equip with Gigabyte i-RAM expansion card for advancing access speed.
The processing and access speed is not fast enough, and the acquisition data will loss in 100Hz sampling rate. So, the lost data is interpolated linearly as compensation. In future, perhaps the array disk of Solid-state Drive can improve the access speed and advance the sampling rate.
2.2 Software
The software of the digital image measurement system comprises: the configuration software of digital camera, LabVIEW 8.5 of NI, MATLAB 2007a of Mathworks. The configuration software can deploy the sampling rate and exposure-time for the camera. The LabVIEW used for dynamic image acquisition, Bayer decode, and static image transformation. The MATLABE used for image enhancement, the digital image correlation, and sub-pixel analysis.
2.3 Coded Program
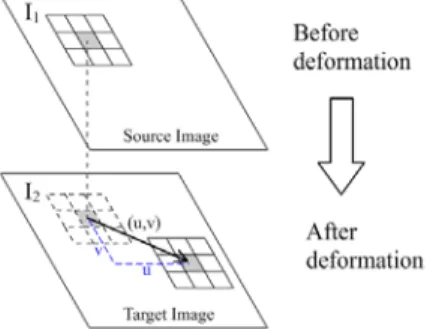
The major object of the digital image measurement system is that solving the displacement of structure by using the digital image correlation. The programs have dynamic image acquisition, gray image transformation, image enhancement, structural displacement analysis program, edge detection, frequency analysis program, and so on. The most important program is the structural displacement analysis program. The basic analysis theory is a based image whose displacement is zero. The system calculated the correlation coefficient with the based image(I1) and other image(I2) block.
The formulation of correlation coefficient has many kinds. The paper uses the below equation.
2 2
12
g g f f g g f f C (1)In equation (1), f represented the integer-pixel value of source image, and g indicated the pixel value of target image. Image displacement calculation based on digital correlation coefficient is a kind of searching method to locate target image according to one or more measurements. The precision of measurement unit is integer pixel value. The sub-pixel analysis could improve the precision which stands on the level of analysis. For example, one image block was assigned to f in source image, and another was assigned to g in target image. Assume the correlation coefficient calculated between f and g is 0.95. The block g was moved right 0.1 pixel location as block g’. Their relation between g and g’ show in below equation (2).
1 0.1
1, 0.1 , ' ,y xy x y x g g g (2)The correlation coefficient between f and g’ was calculated afresh. If the result value is greater than 0.95, a new displacement value was assigned. The searching direction kept on moving right to find suitable sub-pixel position. Because the range of gray pixel value belongs between 0 and 255, the precision of 0.1 pixel value was accepted and 0.01 pixel value was not accepted. The level of sub-pixel analysis was divided 0.1, 0.05, 0.025 and 0.0125 in the system.
3
Digital image measurement system
3.1 Image acquirement programmingThe LabView software was used in the system for acquiring digital images. The program could be configure sampling rate and stop frame. If the user needs to interrupt for reducing time-consuming, the stop button allowed this function. In order to avoid wasting computer processing time, so the data of images are not compressed and require large disk space. If image resolution is 1024x768 and sampling rate is 100Hz, the data size of 75MB is transferred in per second. The program will meet two problems: 1.data size too large, 2.sampling rate too high caused computing time insufficient. The program will record frames which lost in acquirement procedure. The interpolation method was used to improve the accuracy of time-history data.
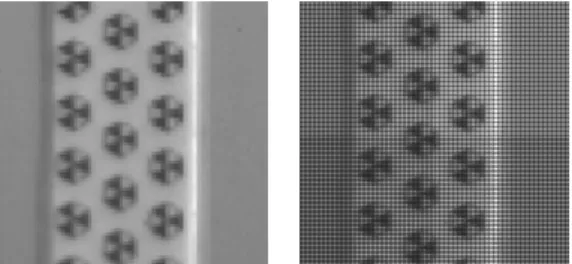
When the system completed the images acquirement process, the frames were stored with each single image file. The camera, which is a color machine, needs to decode image for Bayer pattern. Otherwise, the image will display grid line which showed in figure 2.
3.2 System post processing
The MATLAB software was used in this part. First, the image whose brightness is low will be process to enhance image quality. Then, the reference position was located at every floor in the source image. The image block included hive-grid was calculated correlation coefficient and the displacement was gained in 30 pixels. When the displacement was confirmed between integer pixel positions, the sub-pixel analysis was executed. If the correlation coefficient was not maximal between integer sub-pixel positions, the maximum value would be found in sub-pixel. In sub-pixel processing, the system tried to calculate from two directions. If no more maximal value was found, the integer pixel value was estimated as displacement. The sub-pixel analysis could not be segmented unlimited, because the grayscale image had only 256 different intensities.
The unit of image displacement was integer pixel value in the beginning. The calculation of actual structural displacement needed to multiply by a constant proportion s. Then, the measured time-history displacements would be estimated. The constant proportion s could be evaluated by using edge detection to find the edge of hive-grid target. The length of hive-grid target had known. The constant proportion s was calculated simply.
4
Results and analysis
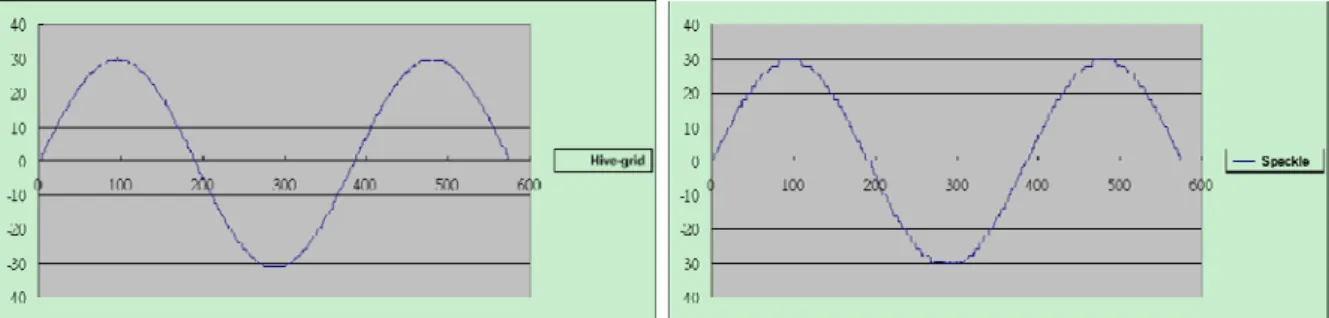
4.1 Numerical simulation resultThe study created a numerical simulation image which included digital random speckle and hive-grid target. The images generated from PHP web language had about 600 frames. The variation of images was similar to sine curve. These images were loaded into FLASH as animation. The animation was played in screen, and the time-history displacement was found. The results were shown in figure 3. The time-history displacement calculated by using hive-grid target was smoother than that calculated by using digital random speckle. In the example considered in this study, it shown that the result of using hive-grid target was better than digital random speckle.
Figure 3. The time-history displacement of the numerical simulation. 4.2 The result of small earthquake simulation
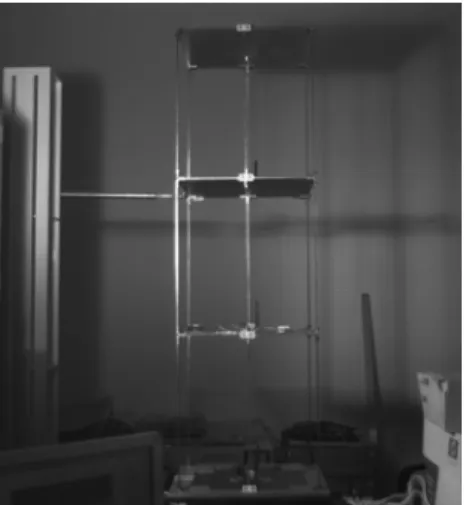
The structural sample, shown in figure 4, is a small three story frame. The experiment base was a small shaker and a LVDT was set on the second floor. The El Centro earthquake was generated from the small shaker, and the time-history displacement was estimated from the digital image measurement system. The results were shown in figure 5 and the curves were very similar. The peak value of frequency calculated in FFT was very approximate.
Figure 4. The configuration of small space frame.
Figure 5. The time-history displacement of small space frame. 4.3 The result of large earthquake simulation
The structural sample, shown in figure 6, is a six story steel frame. The specification of steel frame is: a)cross section of column is 150x25mm, b)column height is 1000mm, c)floor slab is 1000x1500x20mm, d)weight is 75kgw x 6, e)beam is 50x50x50mm. The experiment was tested at NCREE in Taiwan. The earthquake magnitude included 50, 100, 500, 1000, and 1500 gal. The displacement estimated by the digital image measurement system had higher error in low floor and low magnitude. The result, shown in figure 7, had better accuracy in high floor or high magnitude. The peak value of frequency calculated in FFT had about 1% error.
5
Conclusions
The digital image measurement system is a feasible option in this study. The time-history displacement estimated by the digital image system was very similar to LVDT in some experiment. The curves, shown in figure 5, overlapped almost in all period. The curves, shown in figure 7, had similar trend, but there are not accurate. The actual length of one pixel was presented in proportion value s. If s is large, the image is rough; if s is small, the image is detailed. By using sub-pixel analysis, the system would advance the accuracy to 0.1 pixel value. So, if s is smaller than 0.1mm, the
-3 -2 -1 0 1 2 3 0 200 400 600 800 1000 1200 LVDT DIC
accuracy will achieve 0.01mm easily. In this paper, three conclusions were made from these experiments.
1. In higher resolution, the time-history displacement shows very similar result. In lower resolution, the displacement trend is approximate, but the accuracy of displacement is too large. The digital image measurement system could be applied in estimating displacement of structural test in higher resolution.
2. The set-up of image measurement system is very easy, and it is very serviceable scheme.
3. The measurement of hive-grid target length could cause error, and therefore many hive-grid targets were measured to diminish error.
Figure 6. The configuration of six story steel frame.
Acknowledgements
The authors would like to thank the National Chiao Tung University and National Science Council of the Republic of China, Taiwan, for financially supporting this research under Contract No. NSC 98-2221-E-0009-097.
References
C. QUENTIN DAVIS, DENNIS M. FREEMAN, 1998, Statistics of subpixel registration algorithms based on spatiotemporal gradients or block matching, Optical Engineer, 37(4), 1613-1620.
D. AMODIO, G.B. BROGGIATO, F. CAMPANA, G.M. NEWAZ, 2003, Digital Speckle Correlation for Strain Measurement by Image Analysis, Experimental Mechanics, 43(4), 396-402.
H.-C. CHUNG, J. LIANG, S. KUSHIYAMA, M. SHINOZUKA, 2004, Digital image processing for non-linear system identification, International Journal of Non-Linear Mechanics, 39(5), 691-707.
MICHAEL A. SUTTON, STEPHEN R. MCNEILL, JEFFREY D. HELM AND YUH J. CHAO, 2000, Advances in Two-Dimensional and Three-Two-Dimensional Computer Vision, Topics in Applied Physics, 77, 323-372.
PENG ZHOU, KENNETH E. GOODSON, Subpixel displacement and deformation gradient measurement using digital image/speckle correlation(DISC), Optical Engineer, 40(8), 2001。
SHAOPENG MA, GUANCHANG JIN, 2002, New Correlation Coefficients Designed for Digital Speckle Correlation Method (DSCM), Optical Technology and Image Processing for Fluids and Solids Diagnostics, Proceedings of the SPIE, 5058, 25-33.
TAMAL BOSE, 2004, Digital Signal and Image Processing, John Wiley & Sons, INC.
-50 -40 -30 -20 -10 0 10 20 30 40 50 0 200 400 600 800 1000 1200 1400 LVDT DIC
出席國際學術會議報告
報告人姓名 林子軒 報告日期 2010/07/13 系所及年級 土木所博五 核定文號 NSC 98-2221-E-0009-097 連絡電話 0963354403 電子信箱 [email protected] 會議期間 2010/07/12~2010/07/14 會議地點 日本 東京 會議名稱 (中文) 第五屆世界結構控制和監測研討會(英文) 5th world conference on structural control and monitoring
發表論文題目
(中文) 能量擷取在結構健康監測上的應用
(英文) Study of Energy Harvesting Technology in Structural Health Monitoring
(一)
參加會議經過:
2010 年結構控制和監測研討會在日本東京舉行,會議期間為民國 2010 年 年 7 月 12-14 日。世界各國,共有上百人的學術界與業界人士參加。第一天就是 註冊與茶會,認識了一些老師與學生,第二天開始就是正式的會議發表,我是排 在第二天。由於我是第四次出國以英文報告論文,因此還蠻駕輕就熟,但是到日 本後,還是一直利用空閒時間練習,在會議中你可以看到各國的學生或是老師報 告,各有優缺點。在我報告的時候還算順利,別人的提問我也都還答得出來。表 現應該還算不錯了。可是自己知道,還有很大的進步空間,尤其是在發音與最後 的問答方面,還需要多加強。這次研討會也認識了蠻多大陸去的學者,感覺在大 陸在派遣學生或是學者出國參加研討會方面是相當的積極,台灣其實也應該更鼓 勵與贊助學者與學生出國參加國際研討會為台灣發聲,這也是我們需要再努力與 加油的。 (二)與會心得:
這次參加這個會議,是我第四次於國外參加的會議,有蠻多心得的。在會議中你 可以看到各國所做的研究,可以看到有比你差有也比你好的研究。在國外念書的 學生,英文普遍來說都不錯,但也會覺得有些並不是那麼的好。這次出國大大增 加了國際觀,也給自己相當多的刺激,除了英文要加強之外,國外做研究的嚴謹 與方法也是我要學習的。在與國外唸書的同學聊天後,發現,在國外的修課與研 究壓力,比起台灣真是大蠻多的,更加深了我要更加用功與努力的動力。這次的 經驗讓我對研究更加充滿鬥志與熱情,在國際化時代,有機會一定要常常踏出 去,讓自己的視野更加的開闊,也可以讓研究與世界接軌。 (三)建議
這次能夠參加這次的研討會,很感謝國科會的經費補助,讓我能夠到國外去發 表,建議國科會以後能夠讓更多的同學出去看看,相信對未來一定有相當的幫助。(四)
攜回資料:
論文摘要全集 會議議程 論文摘要及全文電子檔(隨身碟) (五)結論:
智慧結構健康監測已是國際土木界重視的研究。 此會議乃是結構健康監測在土木工程應用交流的重要場合。 此次會議給了學生許多寶貴的經驗。 建議讓更多的同學能夠出國報告。5th World Conference on Structural Control and Monitoring 5WCSCM-10329
Lin, Hung, Fujino and Nagayama
S
TUDY OFE
NERGYH
ARVESTINGT
ECHNOLOGY INS
TRUCTURALH
EALTHM
ONITORINGT. H. Lin
The National Chiao Tung University, Hsinchu 300, Taiwan [email protected]
S. L. Hung
The National Chiao Tung University, Hsinchu 300, Taiwan [email protected]
Y. Fujino
The University of Tokyo, Tokyo 113-8656, JAPAN [email protected]
T. Nagayama
The University of Tokyo, Tokyo 113-8656, JAPAN [email protected]
Abstract
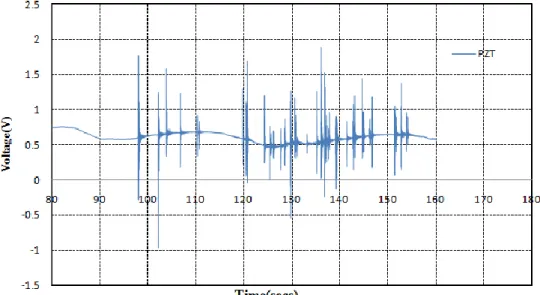
Structural health monitoring (SHM) of buildings and civil infrastructures has recently received increasing attention. Developing a real time monitoring system with low cost, high stability and robustness is important. The aims of SHM are to monitor health condition of structure long term using smart sensor system. Most existing SHM system use wired monitoring systems to collect structural response data from various locations in the structure for analysis. However, installing a large scale wired monitoring system is time consuming and often takes high maintenance and deployment costs. A wireless sensor network based monitoring system provides many benefits such as flexibility of deployment, low maintenance cost, low power, self-organization and wireless communication. Therefore, the wireless sensor networks based wireless monitoring system is considered an appropriate choice for developing an intelligent structural health monitoring system. However, power sources and power consumption are the critical issue if batteries have to be periodically replaced. This study introduced general theory of vibration-based energy harvesting method. An improved piezoelectric harvesting model with new energy harvesting IC, LTC3588-1 (LINEAR TECHNOLOGY) was also demonstrated. Experimental studies were conducted in both laboratory and full-scale structures. This study further proposed a windmill-magnet integrated piezoelectric energy harvesting system. Different piezoelectric materials were evaluated. Experimental results provide an evident that the proposed windmill-magnet integrated piezoelectric energy harvesting system gives high and regular output voltage. Hence the efficiency of energy harvesting in civil structure can be improved. This study will increase our understanding of the energy limitation on wireless sensor networks, and it provides the information of harvesting the ambient energy to wireless sensor device in structural health monitoring.
Introduction
To monitor and control the responses of buildings and civil infrastructures in real time has been increasingly more important. Therefore, to develop a low cost, high stability and more advanced monitoring system is important now. Due to many advantages like smaller size, low power, lower manufacturing costs, self-organization and wireless communication, the wireless sensor monitoring system become an appropriate choice for developing an intelligent civil infrastructures monitoring system (Akyildiz et al. 2002; Du et al. 2005; Mainwaring et al. 2002). Several researches have been devoted to apply wireless sensor network in civil infrastructures monitoring. For example, (Kurata et al. 2003) discussed using a smart sensor based MICA mote platform to monitor risk of buildings for natural and man-made hazards. The performance of the MICA mote was investigated through shaking table tests of a two story steel structure. Lynch et al.(Lynch et al. 2004) designed an active wireless sensing unit that could input excitations into a structural system and proposed a computational framework for analyzing piezoelectric based active sensor signals for indications of structural damage. Wisden (Paek et al. 2005) that was designed for structural health monitoring, can measure tri-axial structural vibration data reliably across multiple hops with low latencies for sampling rates up to 200Hz.