國
立
交
通
大
學
資訊科學與工程研究所
碩
士
論
文
對 靜 態 二 元 碼 轉 譯 之 驗 證
Verification for Static Binary Translation
研 究 生:李原嘉
對靜態二元碼轉譯之驗證
Verification for Static Binary Translation
研 究 生:李原嘉 Student:Yuan-Jia Li
指導教授:楊武 Advisor:Wuu Yang
國 立 交 通 大 學
資 訊 科 學 與 工 程 研 究 所
碩 士 論 文
A ThesisSubmitted to Institute of Computer Science and Engineering College of Computer Science
National Chiao Tung University in partial Fulfillment of the Requirements
for the Degree of Master
in
Computer Science
August 2012
對靜態二元碼轉譯之驗證
學生:李原嘉
指導教授
:楊武 博士
國立交通大學資訊科學與工程研究所碩士班
摘
要
對於程式移植來說,二元碼轉譯是一個很重要的技術,它可以讓某平 台的應用程式在其他平台上執行,這樣的技術也廣泛應用在虛擬機器和 模擬器上。無論如何,由於發展一個二元碼轉譯器有許多繁瑣的細節必 須小心的處理,像是函式呼叫慣例 (Calling conventions)、系統呼叫 (System calls),所以它是一個棘手的工作。因為一個程式裡包含非常多 的指令,我們必須耗費很大的精力去找出轉譯錯誤的指令。因此,開發 一個自動化工具來驗證轉譯後的程式並且找出轉譯錯誤的指令是有必要 的。我們提出一個可適用於靜態二元碼轉譯的驗證機制,它會在轉譯後 程式的執行過程中檢查其所模擬的架構之狀態 (Architecture state)。另 外,我們也在驗證工具中加入一些設計,這些設計可用來加快驗證的速 度並且依然可以正確找出轉譯錯誤的指令。
Verification for Static Binary Translation
Student:Yuan-Jia Li
Advisor:Dr. Wuu Yang
Institute of Computer Science and Engineering
National Chiao Tung University
ABSTRACT
Binary translation is an important technique for porting programs as it allows applications for one platform to execute on another. The technique is widely used in virtual machines and emulators. However, developing binary translators is tricky because many delicate details need be handled carefully, such as calling conventions and system calls. Because of the huge number of instructions in a program, it requires much effort to identify the mistranslated instructions. Therefore, it is necessary to develop an automatic tool to verify the translated programs and to identify the mistranslated instructions. We propose a new verification mechanism for static binary translation, which checks the emulated architecture state (the state of the emulated architecture) from time to time during program execution. In our verification tool, there are additional designs that can speed up the verification and accurately identify the mistranslated instructions.
誌
謝
這篇論文得以完成,首先必須感謝我的指導教授楊武老師,論文撰寫 的過程中,老師不厭其煩反覆校閱每一版的論文草稿,並且提醒我內文 不足之處。研究方面,老師幽默風趣的指導風格不斷地激發我們對研究 問題的想法,一步一步教導我們如何進行研究,我很感謝老師的耐心。 另外也要感謝我的口試委員徐慰中老師、李政崑老師和單智君老師,以 及 group meeting 的游逸平老師,老師們在每次的 meeting 中所給的建 議往往都可以突破思考邏輯上的盲點,口試時的建議也擴大了我的視 野,使得這篇論文更完整。 同時也要感謝 PLASLAB 的成員們,特別是柏曄學長與俊宇學長在論 文與研究上給予我許多幫助與建議,還有實驗室的冠翬、政錡同學、家 倫學弟,聊天、討論的過程也使得我對於一些研究上的細節更加清楚。 感謝我在 NCTU 認識的每一位,讓我研究生涯過得更加充實。 最後,感謝我的家人一直在背後支持我,讓我得以專心於研究上並完 成這篇論文。
The work reported in this paper is partially supported by National Science Council, Taiwan, Republic of China, under grants NSC 100-2218-E-009-010-MY3 and NSC 100-2218-E-009-009-MY3.
Contents
摘要 i Abstract ii 誌謝 iii List of Figures vi 1 Introduction 1 2 Background 5 2.1 Overview of QEMU . . . 6 2.2 Overview of LLBT . . . 7 3 Challenges of Verification 94 Design and Implementation 12
4.1 Allocating Identical Virtual Memory . . . 13 4.2 Performance of Verification . . . 18
5 Speed Up Verification 19
5.1 Coarse Instruction . . . 19 5.2 Quick Verification . . . 26
6 Experimental Evaluation 31
6.1 The Bugs in LLBT Discovered by the Verifier . . . 32 6.2 The Number of Times Instrumentation Code Is Executed . . . 34 6.3 Execution Time . . . 36
7 Conclusion 40
List of Figures
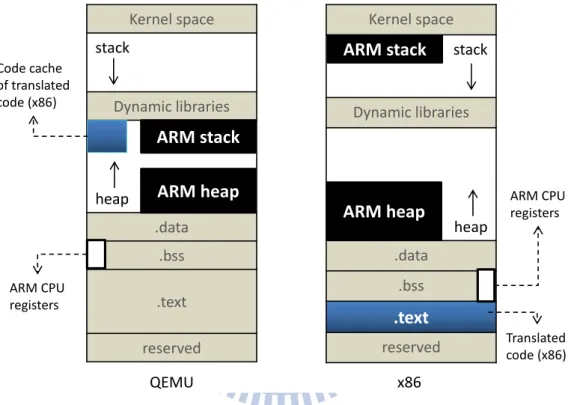
2.1 The left figure is the virtual memory layout of QEMU emulat-ing an ARM program, and the right figure is the virtual mem-ory layout of the translated x86 program which was translated from an ARM program by LLBT. . . 8 4.1 The overall structure of the verification consists of the offline
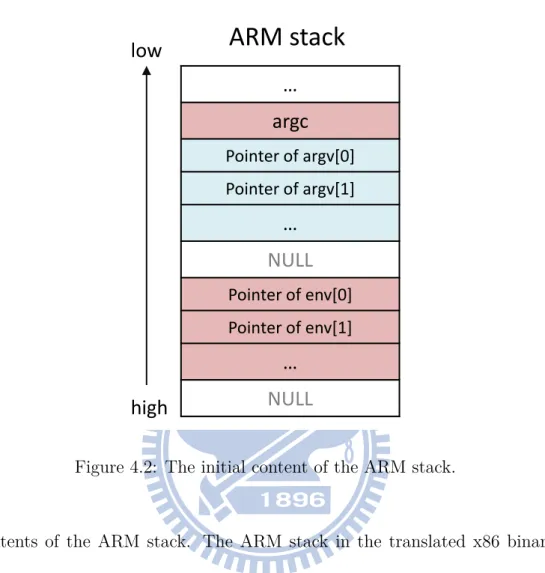
phase and the runtime phase. The translated x86 program, the register-defining list, and the results of coarse-instruction analysis are prepared during the offline phase. At runtime, three processes cooperate to perform verification. . . 14 4.2 The initial content of the ARM stack. . . 15 5.1 An example coarse instruction. The colored registers in the
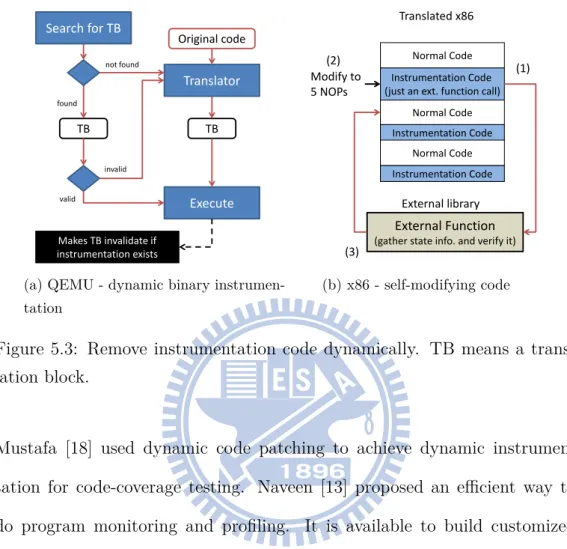
right are the registers defined by the coarse instruction. . . 20 5.2 The algorithm for coarse-instruction analysis . . . 24 5.3 Remove instrumentation code dynamically. TB means a
6.1 The number of times instrumentation code is executed in
coarse mode and in branch mode relative to that in full mode. 35 6.2 Execution time when verifying EEMBC applications in the
branch, coarse, and full modes. The base line is the execution
time of emulated ARM programs without verification. . . 38 6.3 Execution time when verifying EEMBC applications in the
coarse quick and full quick modes. The base line is the
Chapter 1
Introduction
Binary translation [17, pp. 49-52] is an important technique for porting programs as it allows applications for one (software/hardware) platform to execute on another. The technique is widely used in virtual machines and emulators, such as VMware Workstation [5], Microsoft Hyper-V [3], and QEMU [7]. Based on the translation time, there are two broad categories of binary translation: static binary translation, which translates code offline, and dynamic binary translation, which translates code at run time. UQBT [10] is a static binary translator while FX!32 [9], Aries [20], and QEMU are dynamic.
Developing binary translators is challenging because many issues need be handled carefully, such as calling conventions, system calls, and the code
discovery and code location problems [17, pp. 52-55]. The translated
correctness of a translated program, machine state is manually checked after each instruction is executed. The manual approach consumes a lot of time and is error-prone. It would be advantageous to have an automatic tool that can verify the translated programs and identify the errors produced by the translator.
Traditional verification methods fall in two categories. The first com-pares the execution results of the original and the translated programs. The concept is similar to black-box testing of software testing. This strategy is simple but unsuitable since it is difficult to accurately compare the results since there are many kinds of results, such as creating a new file or initiating a system operation. Moreover, this strategy would produce little information to help debugging.
The second performs verification based on the control flow of the pro-grams. This strategy is widely applied in the validation of optimizing com-pilers [15, 19]. Because the target addresses of the indirect branches cannot be resolved completely, it is difficult to build an accurate control flow graph from binary code. The constraint makes this strategy difficult to be applied in the verification of binary translation.
We propose a new mechanism to verify programs produced by a static bi-nary translator. This mechanism is based on the first method but comparing the architecture states instead of the program outputs. In our verification mechanism, the emulated architecture state is checked after each translated instruction is executed. Instrumentation code, called a checkpoint, is
in-serted after each translated instruction. Instrument must be done on both the emulated ARM binary and the translated x86 binary at exactly the same places. The original ARM programs and the translated x86 programs run side by side. When the instrumentation code is executed, the emulated ar-chitecture state, including the emulated CPU registers and condition flags, is compared against the corresponding architecture state in the original pro-gram. This strategy seems simple and intuitive, but there are many chal-lenges to overcome. One challenge is the inconsistency of the placement of the code and data in the virtual memory. Different placements result in different values in the architecture state. This makes comparison difficult.
In this research, we developed a verifier which can indicate the mistrans-lated instruction if it discovers the program is transmistrans-lated incorrectly. The verifier uses QEMU to produce the run-time architecture states of the orig-inal program and then compares it against the corresponding emulated ar-chitecture states of the translated program to ensure the translated program behaves exactly as the original program. The verifier also helps the devel-opers to identify mis-translation problems in a static binary translator. In addition, we invented several techniques that speed up the verifier without losing the precision in verification.
The remainder of this thesis is structured as follows. Chapter 2 sketches the binary translator LLBT and the emulator QEMU. Chapter 3 describes the challenges of verification. Chapter 4 illustrates the implementation de-tails and shows how to overcome the problem of different memory address.
Chapter 5 details the method to speed up verification. Chapter 6 discusses the experimental results, and this research is summarized in chapter 7.
Chapter 2
Background
In this research, we attempt to verify the static binary translator LLBT (LLvm-based Binary Translator) [16]. We use LLBT to translate an ARM binary into an x86 binary and compare the architecture states during the execution of the ARM and x86 binaries. We also need QEMU to emulate the ARM binary on our hardware platform (which is a x86 architecture). Two reasons let us to use QEMU to emulate the ARM binary instead of directly execute it on a real ARM machine. The first reason is performance. In this research, the two architecture states should be compared. It needs network communication to send information for verifying. The overhead of network communication is more than communication between two processes in the same machine. The second reason is decreasing the developing effort, we use QEMU to help us deal with the placement of data in the virtual memory rather than duplicate the function of memory management. The details of
implementation will be described in chapter 4. Thus, it is recommended to have basic knowledge about QEMU and LLBT. The overview of QEMU and LLBT are given in the remainder of this chapter.
2.1
Overview of QEMU
QEMU is a generic machine emulator and virtualizer created by Fab-rice Bellard. Two modes of emulation are supported by QEMU: process virtual machines and system virtual machines. A process virtual machine can make programs executable on platforms of different Instruction Set
Ar-chitectures (ISAs). Thanks to the technique of binary translation, process
virtual machines for different ISAs could be implemented on the same hard-ware platform. For example, an ARM program can be executed on an x86 architecture. On the other hand, a system virtual machine makes it possible to emulate a whole system including I/O devices, memory space, etc. An-other operating system or environment, called guest, can be built on top of the current system, called host.
In this research, we use the process mode of QEMU. When a original program is emulated by QEMU in the process mode, QEMU first loads the original code, sets the base address of the emulated heap, and initializes the emulated CPU registers in memory. Then it allocates memory space for the code cache and the emulated stack. Finally, QEMU translates the original code and then executes the translated code. Note that the translated code
is stored in the code cache temporarily, the emulated architecture state is represented by the emulated CPU registers, and the emulated heap and em-ulated stack are the heap and stack used by the translated code, respectively. The left side of Figure 2.1 shows the overall memory layout of QEMU em-ulating an ARM program. Currently QEMU is used in many applications such as the Google Android Emulator [2].
2.2
Overview of LLBT
LLBT is a static binary translator based on LLVM (Low Level Virtual Machine) [6]. Unlike QEMU, LLBT translates code offline, but it does not offer the function of system virtualization. LLBT translates ARM machine code into LLVM IRs (an intermediate representation in LLVM), and then uses the LLVM backend to generate target machine code. LLBT takes an ARM binary program as input and it outputs a new binary program for another ISA (Instruction Set Architecture), such as ARM, x86 and MIPS.
The right side of Figure 2.1 shows the overall memory layout of a trans-lated program in the x86 platform. It is important to note that the emutrans-lated architecture state is maintained by the translated x86 program and the ARM stack is allocated in the stack of the process by default rather than in the heap. In general, the performance of a program translated by a static binary translator would be better than that by a dynamic binary translator because the translation time can be ignored.
Kernel space stack Dynamic libraries heap .data .bss .text reserved QEMU x86 ARM stack ARM heap Kernel space stack Dynamic libraries heap .data .bss .text reserved ARM stack ARM heap ARM CPU registers Code cache of translated code (x86) ARM CPU registers Translated code (x86)
Figure 2.1: The left figure is the virtual memory layout of QEMU emulating an ARM program, and the right figure is the virtual memory layout of the translated x86 program which was translated from an ARM program by LLBT.
Chapter 3
Challenges of Verification
When an ARM program is emulated by QEMU, the process’s virtual ad-dress space is managed by the QEMU memory management instead of the host operating system. In other words, QEMU not only emulates the pro-cessor but also emulates the memory. On the other hand, when executing a translated program (translated by LLBT), the emulated stack and heap could be placed at any location allocated by the host operating system. Fig-ure 2.1 shows the virtual memory layouts in QEMU (left) and the translated x86 program (right), respectively. In QEMU, both the ARM stack and the ARM heap are emulated in the heap; while in the translated x86 program, the ARM heap is emulated in the heap but the ARM stack is emulated in the stack section. This causes the differences in the memory layout of two programs.
emulated by QEMU) and of the translated x86 program in Figure 2.1, we compare their architecture states at various steps during program execution. The architecture state includes the contents of the registers and the four condition flags (NZCV ). The contents of a register could be either a value or an address. When the contents of a register, say R1, is a value, R1 in the original ARM program and R1 in the translated x86 program should have identical values. When the contents of a register, say R2, is an address, R2 in the original ARM program and R2 in the translated x86 program could have different contents if memory allocation is done differently in the two programs.
ARM is a register-based load-and-store architecture. All memory oper-ations are performed by load or store instructions. Before an instruction accesses the memory, the address of the memory cell must be saved in the registers. For example, when a program operates on the process stack, the stack-pointer register SP holds the address of stack’s top cell. During ver-ification, the contents of the stack-pointer registers in the emulated ARM program and in the translated x86 program registers may be different even if they actually point to the same stack-top cell. Similar situations may happen to other registers.
In comparing architecture states, there are two approaches: (1) We may allow different memory allocations and adjust the addresses in registers ac-cordingly. (2) If we always allocate the ARM stack and heap at the same virtual addresses, all corresponding registers in the emulated ARM program
and in the translated x86 program must always hold the same contents, be it a value or an address. In the former solution, adjusting the addresses in the architecture states is cumbersome because it is difficult to track the contents of registers. Therefore, we adopts the later approach. We are careful to al-ways make the same memory allocation in both the emulated ARM program and the translated x86 program. This makes comparing architecture states simple.
In a straightforward verification, we compare the architecture states after every instruction is executed. This increases the overhead of verification significantly. In some cases, the overhead might be up to 60 times the actual running time. The poor performance makes the straightforward verification infeasible. We propose a new method that reduces the number of comparisons without sacrificing the accuracy of verification.
Chapter 4
Design and Implementation
This chapter illustrates the various methods that are used to ensure that memory allocation in the translated x86 program is exactly the same as that in the emulated ARM program. Figure 4.1 shows the overall structure of the verifier. Before program execution, the translated x86 program is generated from the original ARM program by LLBT. LLBT also produces a
register-defining list from the generated LLVM intermediate form (IR). For
each ARM instruction, the register-defining list contains the registers that are modified by that ARM instruction. In order to verify the LLVM IR generated by LLBT, we use another register-defining analyzer, which also produces a register-defining list from the original ARM binary code. The two register-defining lists should be identical otherwise there are problems in LLBT.
could help to reduce the checkpoints and will be described in chapter 5. Note that the coarse-instruction analysis is performed in LLBT for gener-ating instrumentation code in the translated x86 programs. At runtime, QEMU will initialize the emulated ARM stack and consult the result of the coarse-instruction analysis for code instrumentation in QEMU. In our imple-mentation, QEMU will fork two new processes. The original QEMU process continues performing the normal actions in QEMU. The first spawned pro-cess loads the x86 binary translated by LLBT as a shared library and jumps to the main function of the library to execute the translated code. The second spawned process works as a verifier which compares the architecture states obtained from the two other processes.
4.1
Allocating Identical Virtual Memory
In order to simplify the comparison of the architecture states, all variables and dynamic memory in the translated x86 program are allocated in the same virtual addresses as those in the emulated ARM program.
When QEMU emulates the original ARM binary, it first allocates a block of memory that will serve as the stack of the ARM binary. When the trans-lated x86 binary executes, it also needs to allocate a block of memory that will serve as the stack of the ARM binary. Moreover, when a program is executed, the program loader will push the addresses of the system argu-ments and environment variables into the stack. Figure 4.2 shows the initial
Offline
Runtime
ARM program (original program)
Register-defining analyzer LLBT
Register-defining list Register-defining list Translated x86 program
QEMU
Allocate and initialize ARM stack
Load shared object (Translated program)
Execute QEMU translate code
Execute
Bind syscall wrapper and ARM stack
Emulated states Verifier Emulated states
(compare states) fork IPC IPC process process process Compare Coarse-instruction analysis
Figure 4.1: The overall structure of the verification consists of the offline phase and the runtime phase. The translated x86 program, the
register-defining list, and the results of coarse-instruction analysis are prepared during
the offline phase. At runtime, three processes cooperate to perform verifica-tion.
…
argc
Pointer of argv[0] Pointer of argv[1]…
NULL
Pointer of env[0] Pointer of env[1]…
NULL
ARM stack
low
high
Figure 4.2: The initial content of the ARM stack.
contents of the ARM stack. The ARM stack in the translated x86 binary should be located at the same virtual memory address and should have the same content as the ARM stack in the emulated ARM binary.
When QEMU forks the first new process, the new process automatically copies the entire virtual memory from the original QEMU process. Then the translated x86 code is loaded as a shared library and starts execution. The translated x86 binary can use the ARM stack directly.
The ARM heap is handled similar to the ARM stack. The ARM heap in the translated x86 binary is located at exactly the same virtual memory address as the ARM heap in the emulated ARM binary because the new
process is forked from the original QEMU process. Memory in the heap is allocated piece by piece. Since memory allocation is done with system calls, such as brk or mmap, we may intercept such system calls in order to control memory allocation.
In order to make the two ARM heaps (one in emulated ARM code and one in the translated x86 code) identical, it is necessary to modify all the system calls which are related to memory allocation. But we cannot change the kernel code when we modify the system calls because other programs unrelated to verification would be influenced as well. Therefore, a user-level’s solution should be adopted.
Before explaining the solution, we describe the system-call mechanism in ARM architecture. There are two steps in a system call in an ARM program:
1. Store a system call number in the register R7.
2. Raise a software interrupt by swi (or svc) instruction. The brk system call is implemented as follow:
mov R7, #45 svc 0x00000000
The first mov instruction stores the constant 45 into the register R7. 45 is the system-call number of the brk system call. The second instruction svc raises a software interrupt. In handling the software interrupt, the OS will switch to the kernel mode, allocate the required memory, and store the address of the allocated memory into the register R0.
In our solution, LLBT translates the svc instruction into a function call to a wrapper which performs the system call according to the value of R7. The wrapper uses mmap to allocate a block of memory at a specific address. In fact, the QEMU memory management is implemented in a similar way.
Although adapting the system-call wrapper can avoid modifying the ker-nel code, it still needs a memory management utility that behaves exactly the same as the QEMU memory management. This is achieved automatically when a new process is forked from the original QEMU process. The QEMU memory management automatically sits on the virtual memory of the new process. Because the translated program is loaded into the process (which is forked from QEMU) as a shared library, the code sections in QEMU and translated x86 code exist in the same memory space. It is possible for the translated x86 code to use QEMU memory management. So, we initialize a function pointer which points to the code of QEMU memory management and then the system-call wrapper of the translated x86 program can adopt the memory management by calling through the function pointer.
Therefore, the strategy, executing the translated x86 code by loading it into the new process, which forked from QEMU, as a library, is a good solution with less development effort to makes the ARM stack and ARM heap identical.
4.2 Performance of Verification
The performance of the straightforward verification is a serious challenge. In the straightforward verification, the instrumentation code is inserted im-mediately after every translated ARM instruction. This means that the instrumentation code is executed once for every ARM instruction that is ex-ecuted. The instrumentation code will collect and deliver the architecture state to the verifier. The cost of the instrumentation code is much more than that of a single ARM instruction. In our experiment, the execution time with verification was 27 times that without verification.
The instrumentation code needs to deliver the architecture state to the verification. We use the shared memory for the delivery, which is the fastest IPC strategy because no memory copy between user space and kernel space needed.
Chapter 5
Speed Up Verification
In this chapter, we proposed two methods to speed up the verification. The first, coarse instructions, reduces the number of instrumentation code and indicates the mistranslated instruction without losing the precision. The second, quick verification, attempts to verify each ARM instruction at most once even if that instruction is executed several times.
5.1
Coarse Instruction
A coarse instruction is a sequence of instructions. It consists of one or more adjacent machine instructions in a program. We called the group-ing method as coarse-instruction analysis. Figure 5.1 shows an example coarse instruction. The first instruction add r5, sp, #40 defines the regis-ter R5. The remaining instructions define {R6}, {R1, R2, R3}, {R0}, {IP}, respectively.
R0
R1
R2
R3
R4
R5
R6
R7
R8
R9 R10 FP
IP
SP
LR
PC
Modify regs. Instructions
R5
add
R5, SP, #40
R6
mov R6, #0
R1, R2, R3
ldm
R5, {R1, R2, R3}
R0
ldr
R0, [SP, #32]
IP
ldr
IP, [SP, #228]
Processor registers
Figure 5.1: An example coarse instruction. The colored registers in the right are the registers defined by the coarse instruction.
A coarse instruction is a longest sequence of consecutive instructions that satisfy the following conditions: (1) If one instruction is executed, all the following instructions in the coarse instruction will be executed; and (2) No two instructions define the same registers; and (3) Every machine instruc-tion belongs to exactly one coarse instrucinstruc-tion. (4) It is possible to jump to the middle of a coarse instruction. The first condition implies only the last machine instruction of coarse instructions can be a jump instruction. The second condition implies every register is modified at most one time in a coarse instruction. We add the instrumentation code after each coarse instruction, instead of after each machine instruction. When any register goes wrong during verification, we can still trace the offending machine in-struction. The reduces the instrumentation code by 80% in the example in Figure 5.1.
instructions. We will show a simple algorithm that can identify coarse in-structions later.
A coarse instruction can be represented as C = (I1, I2, . . . , In) where each Ii is a machine instruction in the program. The registers defined by C is D = (D1, D2, . . . , Dn) where Di is the set of registers defined by Ii. Note that Di∩ Dj =∅, when i ̸= j.
We may analyze a program and identify the coarse instructions. The instrumentation code is added after each coarse instruction. As shown in Figure 4.1, the register-defining analysis and coarse-instruction analysis are performed offline.
A coarse instruction is not a basic block for two reasons: A basic block has exactly one entry point and one exit point. In contrast, a coarse instruction can have multiple entry points and one exit point. It is allowed to jump into the middle of a coarse instruction. This definition could potentially enlarge a coarse instruction. Hence there are fewer coarse instructions (and less instrumentation overhead). Different instructions in the same basic block can define the same registers. This is not allowed in a coarse instruction because we need to trace the offending instruction in a coarse instruction once a register goes wrong.
In order to group coarse instructions, we analyze the instructions to collect the registers and condition flags defined by each instruction and to find all jump instructions. The analysis is performed and the instrumentation code are inserted during translation. A condition flag is treated like a register for
our purpose. All instructions that may change the straightline control flow are considered as jump instructions.
In the ARM architecture, there are three types of jump instructions: 1. The branch instructions such as b (branch), which accepts a signed
offset as the relative address of the next instruction, and bl (branch and link), which saves the program counter PC in the linkage register LR before jumping to the target address. These instructions can be identified by opcode of the instructions.
2. The instructions that define the program counter PC such as mov PC, LR. These instructions can be identified easily.
3. In the ARM architecture, some of instructions such as cmp may set the condition flags (NZCV ) of the processor. The N flag is set when the result is negative; the Z flag is set when the result is zero; the
C flag is set when the result of an unsigned operation overflows; and V flag is set when the result of a signed operation overflows. Some
ARM instructions could be conditionally executed. We called these instructions are predicated instructions.
A predicated instruction is considered as a conditional branch. How-ever, in order to make a coarse instruction as large as possible, a sequence of predicated instructions with the same predicate will be grouped into a single coarse instruction. For example, the following sequence of instructions is divided into 5 coarse instructions:
add R1, R2, R3 ;---addlt R0, R1, #-1 ;---addeq R2, R2, R1 addeqs R4, R4, #-1 ;---addeq R5, R5, R4 addeq R6, R6, R4 add R7, R7, R4 add R8, R8, R4 add R9, R9, R4 ;---addeq R3, R1, R2
Certain instructions may change the condition flag, for example, in addeqs, the suffix s means the condition flag will be modified accord-ing the result of the add operation. A coarse instruction will stop immediately after such an instruction. Certain instructions do not carry a flag. These instructions will always be executed. A sequence of non-predicated instructions could be appended to the end of the previous predicated coarse isntruction.
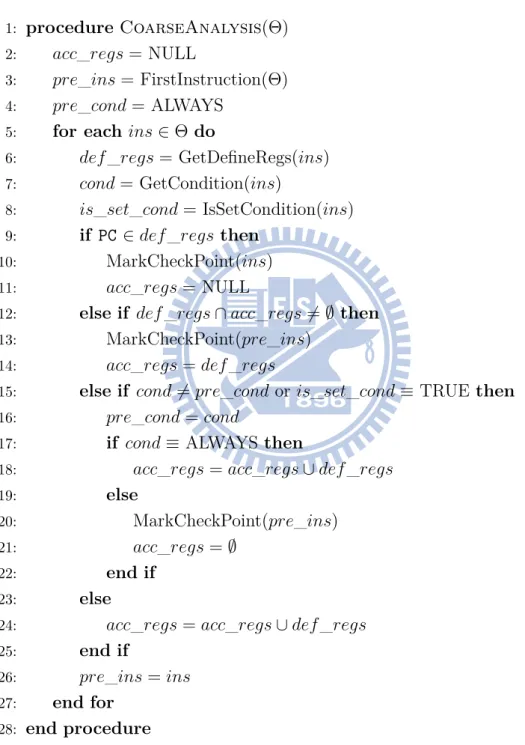
The algorithm for coarse-instruction analysis is shown in Figure 5.2. This algorithm will group the coarse instructions by marking the last machine instruction of each coarse instruction as a checkpoint. Lines 9 to 11 identify the first two kinds of jump instructions. Lines 12 to 14 ensure that no register is defined more than once in a coarse instruction. Lines from 15 to
Input: Θ is a sequence of instructions ordered by virtual addresses.
Output: Group the instructions to coarse instructions and mark the last
instruction in a coarse instruction as a checkpoint.
1: procedure CoarseAnalysis(Θ)
2: acc_regs = NULL
3: pre_ins = FirstInstruction(Θ)
4: pre_cond = ALWAYS
5: for each ins∈ Θ do
6: def _regs = GetDefineRegs(ins)
7: cond = GetCondition(ins)
8: is_set_cond = IsSetCondition(ins)
9: if PC∈ def_regs then
10: MarkCheckPoint(ins)
11: acc_regs = NULL
12: else if def _regs∩ acc_regs ̸= ∅ then
13: MarkCheckPoint(pre_ins)
14: acc_regs = def _regs
15: else if cond̸= pre_cond or is_set_cond ≡ TRUE then
16: pre_cond = cond
17: if cond≡ ALWAYS then
18: acc_regs = acc_regs∪ def_regs
19: else
20: MarkCheckPoint(pre_ins)
21: acc_regs =∅
22: end if
23: else
24: acc_regs = acc_regs∪ def_regs
25: end if
26: pre_ins = ins
27: end for
28: end procedure
22 handle predicated instructions. The instrumentation code for verification is inserted after the instructions marked as checkpoints.
We use an example to demonstrate the coarse-instruction analysis algo-rithm. i = ary [1]; j = ary [2]; k = ary [3]; m = ary [4]; if ( i == 0 ) { i += 100; j += 200; } else { k += 200; m += 100; } i += k; i -= m; print (i); return ;
The above code segment is compiled into the following ARM assembly code. Note that the code from lines 5 to 9 is compiled from if-else block. 1: ldr R1 , [R0 , # -4] 2: ldr R2 , [R0 , # -8] 3: ldr R3 , [R0 , # -12] 4: ldr R4 , [R0 , # -16] 5: cmp R3 , #0 6: addeq R1 , R1 , #100 7: addeq R2 , R2 , #200 8: addne R3 , R3 , #200 9: addne R4 , R4 , #100 10: add R1 , R1 , R3 11: sub R1 , R1 , R4 12: bl <print > 13: mov PC , LR
Initially, the value of variable acc_regs is NULL. When the instruction in line 1 is analyzed, the value of variable acc_regs becomes {R1}. Because the defined registers are different from line 1 to line 5, the value of acc_regs is {R1, R2, R3, R4, CPSR} when the instruction in line 5 is analyzed. When the instructions in line 6 is analyzed, because its condition code is dif-ferent from the previous instruction, the previous instruction (line 5) should be marked as a checkpoint and the variable acc_regs is set to {R1}. The instruction in line 8 is similar to the one in line 6 so the instruction in line 7 should be marked as a checkpoint. Note that when line 10 is analyzed, line 9 is not a checkpoint because the condition code in line 10 is AL. However, line 11 should be a checkpoint because the defined register is the same as the one in line 10. Line 12 and line 13 both would change the program flow so they are marked as checkpoints. In the example, the checkpoints are in line 5, line 7, line 10, line 12 and line 13.
5.2
Quick Verification
The coarse-instruction technique reduces the number of checkpoints to one third of the number of instruction. However, the resulting instrumented program is still 9 times slower than the original program. Note that certain code in a program may be repeatedly executed. The code will be also be verified repeatedly. In order to speed up the verification, we adopt the
code-coverage technique in our verifier. In short, each instruction will be verified
code is executed, it is turned off so that it will not be executed for the second time.
Code coverage is a measure of the degree that the source code of a program has been tested. It has been used in white-box software testing widely [11,12]. In practice, many coverage criteria can be adopted, which are a trade-off between the performance and the accuracy in testing.
• Function coverage: There is instrumentation code in each function to indicate whether it has been tested.
• Statement coverage: There is instrumentation code in each block of code compiled from a statement in source code to indicate whether it has been tested.
• Decision coverage: There is instrumentation code in each decision (or edge) to indicate whether it has been tested.
• Instruction coverage: There is instrumentation code in each in-struction to indicate whether it has been tested.
In order to offer the instruction-level coverage, we adopt the instruction cov-erage criterion.
According to the 80/20 rule, 80 percent of the execution time is spent on 20 percent of the code. For long-running programs, most of the 20 percent of code is contained in loops. If the code in loops is verified at most once, the time spent in the instrumentation code is extremely less than that in the normal code. Hence, the performance of verification is improved significantly. We use a short example to illustrate the quick verification.
; add R4 , R4 , #1
L_00000062 : ; no need to check condition code br label % L_00000062_NI
L_00000062_NI :
% tmp_op1_39 = load i32* % ARM_r4
% tmp_result_int_80 = add i32 %tmp_op1_39 , 1 store i32 % tmp_result_int_80 , i32* % ARM_r4 call @helper_trace (...)
br label % L_00000063
The above code is the LLVM IR which are generated by LLBT from the ARM instruction add R4, R4, #1. The line call @helper_trace(…) is the instrumentation code which calls an external function for verifica-tion. The last line br label %L_00000063 transfers control to the next instruction. When the code from br label %L_00000062_NI to store i32 %tmp_result_int_80, i32* %ARM_r4 is executed, the function helper_trace should be executed and it could record that the code have been tested.
According to our experimental results, total execution time (including normal program execution and verification) in this verify-once strategy is only 1.4 to 1.9 times the execution time of the original program. This verify-once strategy is faster but may produce less accurate results.
In the quick verification mode, all instrumentation code is executed at most one time. We use dynamic binary instrumentation in QEMU (a dy-namic binary translator) and self-modifying code (SMC) [8] for the pro-grams translated by LLBT (a static binary translator) to remove the instru-mentation code dynamically. Many research focused on the similar issues.
TB Translator Original code Search for TB TB found not found Execute invalid valid Makes TB invalidate if instrumentation exists Normal Code Instrumentation Code (just an ext. function call)
Normal Code Instrumentation Code
Normal Code Instrumentation Code
External Function
(gather state info. and verify it) Translated X86 External library Modify to 5 NOPs (1) (3) (2)
(a) QEMU - dynamic binary instrumen-tation TB Translator Original code Search for TB TB found not found Execute invalid valid Makes TB invalidate if instrumentation exists Normal Code Instrumentation Code (just an ext. function call)
Normal Code Instrumentation Code
Normal Code Instrumentation Code
External Function
(gather state info. and verify it) Translated x86 External library Modify to 5 NOPs (1) (3) (2) (b) x86 - self-modifying code
Figure 5.3: Remove instrumentation code dynamically. TB means a trans-lation block.
Mustafa [18] used dynamic code patching to achieve dynamic instrumen-tation for code-coverage testing. Naveen [13] proposed an efficient way to do program monitoring and profiling. It is available to build customized program analysis tools with dynamic instrumentation by PIN [14]. Most research used dynamic code patching or dynamic binary instrumentation to add or remove instrumentation. However, in our research, the instrumenta-tion code is added during binary translainstrumenta-tion and would be removed later.
Figure 5.3 illustrates the process of removing dynamic instrumentation code. In QEMU (shown as Figure 5.3a), the basic unit of the translated code is a translation block (TB). When an ARM instruction is executed, QEMU would search for the corresponding TB first. If the TB is found
(this implies the instruction has been translated) and is valid, the TB is executed; otherwise, QEMU translates the instructions, generates a TB, and then executes it. In our implementation, each TB would contain one or more pieces of instrumentation code. After a TB is executed, it will be marked as invalid. When the TB is encountered the next time, QEMU would check whether the TB is valid. If the TB is invalid, the TB will be generated again; however, instrumentation code will not be included this time.
On the other hand, for x86 code that is generated by LLBT (shown as Fig-ure 5.3b), we cannot use the validate/invalidate mechanism in QEMU. Thus, a strategy based on self-modifying code is adopted. The steps are shown as follows: (1) When an ARM instruction is executed, the corresponding in-strumentation code will be executed. (2) Because the inin-strumentation code is essentially a function call, the caller will obtain the function return value, which is the address of next instruction. Before the caller returns, it modi-fies the CALL instruction (i.e., the instrumentation code which is 5 bytes in length) to five NOP (no operation which is 1 byte in length) instructions. (3) Finally, the program execution continues to the next instruction. When the ARM instruction is executed the next time, the instrumentation code is just NOPs.
Chapter 6
Experimental Evaluation
Our verifier operates in five modes:
1. Full mode: Verify after each ARM instruction. 2. Coarse mode: Verify after each coarse instruction. 3. Branch mode: Verify only when the branch occurs.
4. Full quick mode: Verify after each instruction is executed the first time.
5. Coarse quick mode: Verify after each coarse instruction is executed the first time.
Note that, the first two modes are accurate verification which guarantee all the inconsistent states would be found. The remaining three modes are inaccurate.
Our verifier is a good debugging tool. Several hidden bugs in the well developed LLBT1 were found with our verifier. We also conducted two
exper-iments on the verifier. The first experiment showed that coarse instructions
can significantly reduce the number of checkpoints. The second experiment showed the execution time when verifying the translated programs in the five modes.
The experimental environment is an x86 machine equipped with four 12-core AMD Opteron 6172 processors, and 45 GB memory. The operating system is Linux x86-64 with kernel 3.2.0. The benchmark is EEMBC 1.1 [1] which is compiled as ARM statically linked binaries by arm-eabi-gcc 4.4.6 and linked with µClibc library 0.9.30.2 [4]. The version of QEMU underlying the current verifier is 0.14.0.
6.1
The Bugs in LLBT Discovered by the
Ver-ifier
The verifier discovered three bugs in the 4-year-old LLBT before writing this thesis. The three bugs were fixed and listed below.
• Load and store double words:
This bug was found when verifying the math program which is a test case for the math library. In the ARM architectue, two categories of base-register addressing mode can be used in load and store operations. (1) Pre-indexed addressing mode. Consider the two instructions: ldr R0, [R1, #4] and ldr R0, [R1, #4]!. In both instructions, the value in the word whose address is R1 + 4 would be loaded into the register R0, but in the second instruction, the notation ! means to increment
the base register R1 by 4, that is R1 + 4. The second instruction is equivalent to two instructions: ldr R0, [R1, #4] and then mov R1, R1, #4. (2) Post-indexed addressing mode. For example, ldr R0, [R1], #4 loads the value in the word whose address is R1 to the register R0, and then increments the value of register R1 by 4.
This bug occurred in the instruction ldrd (load double words) and strd (store double words) on pre-indexed addressing mode with up-dating base register (!). When upup-dating a double word data, two registers would be used to store the value in memory address Addr and Addr + 4. The cause of the bug is that the value of base register is updated to Addr + 4 rather than Addr. For example, after executing the instruction strd R0, [R6, #4], the value of R0 and R1 are stored into mem[R6 + 4] and mem[R6 + 8], and the value of R6 should be updated to R6 + 4. In the mistranslated x86 code, the value of R6 would be updated to R6 + 8.
• BLX:
This bug was found when verifying the benchmark djpeg in EEMBC’s consumer test suit. It was a bug in translating blx instruction and occurred when the operand was the register FP (blx FP). LLBT would regard the operand FP as an immediate value when translating. The misunderstanding made the instruction blx FP be translated incor-rectly.
This bug was found when verifying the cast program which is a test case for casting floating points to integer numbers. The value of the carry flag (C) was wrong after executing SBC (subtract with carry) instruction. The C flag shall be set when a carry occurred in the add operations or “no borrow occurs” in subtract operations, but the code translated from the SBC instruction set the C flag when “a borrow occurs”. However, this bug was solved by using LLVM
over-flow intrinsics, which are intrinsics for some arithmetic with overover-flow
operations provided by LLVM, instead of the old one to update the condition flags.
6.2
The Number of Times Instrumentation
Code Is Executed
Figure 6.1 shows the number of times instrumentation code is executed in the coarse mode and branch mode relative to that in the full mode. The result of the data shows the consequent of coarse instructions in coarse mode. In coarse mode, the ratio is lower for programs with fewer conditional and
branch instructions. In our experiment, the ratio is between 22% and 52%.
The average ratio is 36%. In other words, it can eliminate 64% cost in executing instrumentation code. In branch mode, the average ratio is 21%. The ratios in full quick mode and coarse quick mode are too small, so they are not be shown in our experiment.
0% 10 % 20 % 30 % 40 % 50 % 60 % 8_16-bit/b itmnp816 8_16-bit/can rdr816 8_16-bit/m em acc81 6 8_16-bit/p ntrc h8 16 8_16-bit/p uw mo d8 16 8_16-bit/rs pe ed 816 8_16-bit/t tsp rk816 auto mo tive /a2time 01 auto mo tive /aifftr0 1 auto mo tive /aifirf 01 auto mo tive /aiiff t01 auto mo tive /bas efp 01 auto mo tive /bitm np 01 auto mo tive /cach eb 01 auto mo tive /can rdr0 1 auto mo tive /id ctrn 01 auto motiv e/i irflt01 auto mo tive /mat rix01 auto mo tive /pn trch01 auto mo tive /pu wm od 01 auto mo tive /rsp ee d01 auto mo tive /tbloo k01 auto mo tive /ttsp rk01 consu me r/cjp eg consu me r/d jpe g consu me r/rgb cmy01 consu me r/rgb hp g01 consu me r/rgb yiq 01 netw ork ing/os pf netw ork ing/p ktflow b1 m netw ork ing/p ktflow b2 m netw ork ing/p ktflow b4 m netw ork ing/p ktflow b5 12k netw ork ing/rou telooku p off ice/b ezie r01fixe d off ice/b ezie r01floa t off ice/d ither01 off ice/ro tate01 off ice/text01 tele com/au tcor00d ata_1 tele com/au tcor00d ata_2 tele com/au tcor00d ata_3 tele com/con ven 00dat a_1 tele com/con ven 00dat a_2 tele com/con ven 00dat a_3 tele com/f bita l00d ata _2 tele com/f bita l00d ata _3 tele com/f bita l00d ata _6 tele com/f ft00d ata_1 tele com/f ft00d ata_2 tele com/f ft00d ata_3 tele com/v iterb00dat a_1 tele com/v iterb00dat a_2 tele com/v iterb00dat a_3 tele com/v iterb00dat a_4 Avera ge The n u mb e r of time s in strume n ta tio n c od e is ex e cu te d Coa rs e m o d e Bran ch m o d e Figure 6.1: The n um b er of times instrumen tation co de is executed in co arse mo de and in br anch mo de relativ e to that in ful l mo de .
6.3 Execution Time
Figure 6.2 and Figure 6.3 show the execution time for EEMBC applica-tions in the five modes. All the execution time are normalized by adjusting the execution time of the original benchmarks emulated by QEMU (i.e., ones without the instrumentation code) as 1. From Figure 6.2, we can see the ex-ecution of a naive implementation of the instrumentation can be 59 times that of the original program.
In Figure 6.2, two observations are listed.
• The execution time is between 10 and 59 in the full mode. The reason for the large variation the difference of program behaviors. For a CPU-intensive program, the execution time of the instrumentation code is huge relative to the CPU-computation operations. For a memory-intensive process, the execution time of the instrumentation code is relatively small.
• The overhead of verification is very huge so that the execution time decreases significantly when we reduce the number of times instru-mentation code is executed. In the Figure 6.1, it shows the executed instrumentation code in coarse mode is approximately one-third, and the Figure 6.2 also shows the execution time is approximately one-third compared to full mode in average.
On the average, the execution time is 26.7 in the full mode and 9.5 in the coarse mode. In other words, the performance of verification in the coarse
mode is about 3 times better than in the full mode. The fastest verification is in the branch mode, in the execution time is 5.3. However, the branch mode is less accurate in that it does not guarantee to identify the mistranslated instructions.
The experimental results of the full quick mode and the coarse quick mode are shown in Figure 6.3. As shown in the figure, the execution time of the verification with the coarse-instruction mechanism is smaller than that of the one without coarse-instruction mechanism. The verification time are 0.3 for the coarse quick mode and 0.8 for the full quick mode on average.
0 10 20 30 40 50 60 8_16-bit/b itmnp816 8_16-bit/can rdr816 8_16-bit/m em acc81 6 8_16-bit/p ntrc h8 16 8_16-bit/p uw mo d8 16 8_16-bit/rs pe ed 816 8_16-bit/t tsp rk816 auto mo tive/a2 time01 auto mo tive/aif ftr0 1 auto mo tive/aif irf0 1 auto mo tive/aii fft0 1 auto mo tive/b ase fp 01 auto mo tive/b itmn p0 1 auto mo tive/c acheb 01 auto mo tive/c anrd r01 auto mo tive/i dctrn 01 auto motiv e/i irflt01 auto mo tive/m atrix01 auto mo tive/p ntrch 01 auto mo tive/p uw mo d01 auto motiv e/rs pee d01 auto mo tive/tb look01 auto mo tive/tt sp rk01 consu me r/cjp eg consu me r/d jpe g consu me r/rgb cmy01 consu me r/rgb hp g01 consu me r/rgb yiq 01 netw ork ing/os pf netw ork ing/p ktflow b1 m netw ork ing/p ktflow b2 m netw ork ing/p ktflow b4 m netw ork ing/p ktflow b5 12k netw ork ing/rou telooku p off ice/b ezie r01fixe d off ice/b ezie r01floa t off ice/d ither01 off ice/ro tate01 off ice/text01 tele com/au tcor00d ata_1 tele com/au tcor00d ata_2 tele com/au tcor00d ata_3 tele com/con ven 00dat a_1 tele com/con ven 00dat a_2 tele com/con ven 00dat a_3 tele com/f bita l00d ata _2 tele com/f bita l00d ata _3 tele com/f bita l00d ata _6 tele com/f ft00d ata_1 tele com/f ft00d ata_2 tele com/f ft00d ata_3 tele com/v iterb00dat a_1 tele com/v iterb00dat a_2 tele com/v iterb00dat a_3 tele com/v iterb00dat a_4 Avera ge Exec tuio n t im e Ex e cu tion time t o v e rify tr ans la te d EEM BC b e n ch mark s Fu ll Coa rs e Bran ch Figure 6.2: Execution time when verifying EEMBC applications in the br anch , co arse , and ful l mo des. The base line is the execution time of em ulated ARM programs without verification.
0 0.5 1 1.5 2 2.5 3 3.5 8_16-bit/b itmnp816 8_16-bit/can rdr816 8_16-bit/m em acc81 6 8_16-bit/p ntrc h8 16 8_16-bit/p uw mo d8 16 8_16-bit/rs pe ed 816 8_16-bit/t tsp rk816 auto mo tive/a2 time01 auto mo tive/aif ftr0 1 auto mo tive/aif irf0 1 auto mo tive/aii fft0 1 auto mo tive/b ase fp 01 auto mo tive/b itmn p0 1 auto mo tive/c acheb 01 auto mo tive/c anrd r01 auto mo tive/i dctrn 01 auto mo tive/i irflt01 auto mo tive/m atrix01 auto mo tive/p ntrch 01 auto mo tive/p uw mo d01 auto mo tive/rs pee d01 auto mo tive/tb look01 auto mo tive/tt sp rk01 consu me r/cjp eg consu me r/d jpe g consu me r/rgb cmy01 consu me r/rgb hp g01 consu me r/rgb yiq 01 netw ork ing/os pf netw ork ing/p ktflow b1 m netw ork ing/p ktflow b2 m netw ork ing/p ktflow b4 m netw ork ing/p ktflow b5 12k netw ork ing/rou telooku p off ice/b ezie r01fixe d off ice/b ezie r01floa t off ice/d ither01 off ice/ro tate01 off ice/text01 tele com/au tcor00d ata_1 tele com/au tcor00d ata_2 tele com/au tcor00d ata_3 tele com/con ven 00dat a_1 tele com/con ven 00dat a_2 tele com/con ven 00dat a_3 tele com/f bita l00d ata _2 tele com/f bita l00d ata _3 tele com/f bita l00d ata _6 tele com/f ft00d ata_1 tele com/f ft00d ata_2 tele com/f ft00d ata_3 tele com/v iterb00dat a_1 tele com/v iterb00dat a_2 tele com/v iterb00dat a_3 tele com/v iterb00dat a_4 Avera ge Exec ution tim e Ex e cu tion time t o v e rify tr ans la te d EEM BC b e n ch mark s Fu ll q u ick Coa rs e q u ick Figure 6.3: Execution time when verifying EEMBC applications in the co arse quick and ful l quick mo des. The base line is the execution time of em ulated ARM programs without verification.
Chapter 7
Conclusion
We developed a verifier for binary translation which can indicate the mis-translated instruction if it discovers the program is mis-translated incorrectly. Furthermore, in order to speed up verification, we propose the coarse in-structions, which reduces the number of instrumentation code. The results also show the number of times the instrumentation code is executed in the coarse mode is only 36% of that in the full mode. Finally, the code-coverage technique enables the quick verification. The verification time is only 30% of the normal execution (i.e., without verification).
Bibliography
[1] EEMBC.
[2] Google android emulator. [3] Microsoft Hyper-V. [4] µClibc.
[5] VMware Workstation.
[6] Vikram Adve and Chris Lattner. The LLVM compiler infrastructure. [7] Fabrice Bellard. QEMU, a fast and portable dynamic translator. In
Proceedings of the annual Conference on USENIX Annual Technical Conference, pages 41–46, April 2005.
[8] Hongxu Cai, Zhong Shao, and Alexander Vaynberg. Certified self-modifying code. In Proceedings of the ACM SIGPLAN Conference on
Programming Language Design and Implementation, volume 42, pages
[9] Anton Chernoff, Mark Herdeg, Ray Hookway, Chris Reeve, Norman Rubin, Tony Tye, S. Bharadwaj Yadavalli, and John Yates. FX!32 a profile-directed binary translator. IEEE Micro, 18(2):56–64, March/ April 1998.
[10] Cristina Cifuentes and Mike Van Emmerik. UQBT: Adaptable binary translation at low cost. Computer, 33(3):60–66, March 2000.
[11] Sebastian Elbaum, David Gable, and Gregg Rothermel. The impact of software evolution on code coverage information. In Proceedings of
Inter-national Conference on Software Maintenance, pages 169–179,
Novem-ber 2001.
[12] Fabio Del Frate, Praerit Garg, Aditya P. Mathur, and Alberto Pasquini. On the correlation between code coverage and software reliability. In
Proceedings of the 6th International Symposium on Software Reliability Engineering, pages 124–132, October 1995.
[13] Naveen Kumar, Bruce R. Childers, and Mary Lou Soffa. Low over-head program monitoring and profiling. In ACM SIGSOFT Software
Engineering Notes, volume 31, pages 28–34, September 2005.
[14] Chi-Keung Luk, Robert Cohn, Robert Muth, Harish Patil, Artur Klauser, Geoff Lowney, Steven Wallace, Vijay Janapa Reddi, and Kim Hazelwood. Pin: building customized program analysis tools with dy-namic instrumentation. In Proceedings of the 2005 ACM SIGPLAN
conference on Programming language design and implementation, PLDI
’05, pages 190–200. ACM, 2005.
[15] George C. Necula. Translation validation for an optimizing compiler. In
ACM SIGPLAN Notices, volume 35, pages 83–94, 2000.
[16] Bor-Yeh Shen, Jiunn-Yeu Chen, Wei-Chung Hsu, and Wuu Yang. LLBT: an LLVM-based static binary translator. In International Conference on
Compilers, Architecture, and Synthesis for Embedded Systems, October
2012.
[17] James E. Smith and Ravi Nair. Virtual Machines: Versatile Platforms
for Systems and Processes. Morgan Kaufmann, June 2005.
[18] Mustafa M. Tikir and Jeffrey K. Hollingsworth. Efficient instrumenta-tion for code coverage testing. In Internainstrumenta-tional Symposium on Software
Testing and Analysis, July 2002.
[19] Jean-Baptiste Tristan, Paul Govereau, and Greg Morrisett. Evaluating value-graph translation validation for llvm. In Proceedings of the ACM
SIGPLAN Conference on Programming Language Design and Imple-mentation, June 2011.
[20] Cindy Zheng and Carol Thompson. PA-RISC to IA-64: Transparent execution, no recompilation. Computer, 33:47–52, March 2000.