E L S E V I E R Fuzzy Sets and Systems 81 (1996) 311-319
PU||'Y
sets and systems
Forecasting enrollments based on fuzzy time series
S h y i - M i n g C h e nDepartment of Computer and Information Science, National Chiao Tung University, Hsinchu, Taiwan, ROC Received March 1994; revised June 1995
Abstract
This paper presents a new method to forecast university enrollments based on fuzzy time series. The data of historical enrollments of the University of Alabama shown in Song and Chissom (1993a, 1994) are adopted to illustrate the forecasting process of the proposed method. The robustness of the proposed method is also tested. The proposed method not only can make good forecasts of the university enrollments, but also can make robust forecasts when the historical data are not accurate. The proposed method is more efficient than the one presented in Song and Chissom (1993a) due to the fact that the proposed method uses simplified arithmetic operations rather than the complicated max-min composition operations presented in Song and Chissom (1993a).
Kevwords: Fuzzy time series; Enrollments; Forecasting; Fuzzy set; Linguistic value; Linguistic variable
1. Introduction
In [3, 4], Song and Chissom presented the defini- tion of fuzzy time series and outlined its modeling by means of fuzzy relational equations and approx- imate reasoning [6, 9]. Fuzzy time series is a new concept which can be used to deal with forecasting problems in which historical data are linguistic values. In [3], Song and Chissom have applied the fuzzy time series model to forecast the enrollments of the University of Alabama, where a first-order time invariant model is developed and a step-by- step procedure is provided. In [3], they also pointed out that Bintley [1] has successfully ap- plied fuzzy logic and approximate reasoning to a practical case of forecasting, but the concept of fuzzy time series was not applied on the method
presented in [1]. The method presented by Song and Chissom [3] uses the following model for fore- casting university enrollments:
A i = A i - 1 o R, (1)
where Ai-1 is the enrollment of year i - 1 repre- sented by a fuzzy set [2, 7, 8], Ai is the forecasted enrollment of year i represented by a fuzzy set, " ° " is the m a x - m i n composition operator, and R is a fuzzy relation indicating fuzzy relationships be- tween fuzzy time series. However, the forecasted method presented in [3] requires a large amount of computations to derive the fuzzy relation R of (1), and the m a x - m i n composition operations of (1) will take a large amount of computation time when the fuzzy relation R o f ( l ) is very big. Thus, we must 0165-0114/96/$15.00 ~ 1996 Elsevier Science B.V. All rights reserved
312 S.-M. (~en Fuzzy Sets and ,~vstems 8l (1996) 311 319 develop a new method to forecast the enrollments
of the university in a more efficient manner. In this paper, we propose a new method to fore- cast university enrollments based on fuzzy time series [3,4]. The data of historical enrollments of the University of Alabama shown in [3, 5] are ad- opted to illustrate the forecasting process. The ro- bustness of the proposed method is also tested. The proposed method is more efficient than the one presented in [3] due to the fact that the proposed method uses simplified arithmetic operations rather than the complicated m a x - m i n composition operations presented in [3].
The rest of this paper is organized as follows. In Section 2, the concepts of fuzzy time series are reviewed from [3,4]. In Section 3, we propose an efficient method to forecast the university enroll- ments based on fuzzy time series. In Section 4, the robustness of the proposed method is tested. The conclusions are discussed in Section 5.
2. Fuzzy time series
In this section, we briefly review some concepts of fuzzy time series from [3, 4]. The main difference between the fuzzy time series and conventional time series is that the values of the former are fuzzy sets [7] while the values of the latter are real numbers. Roughly speaking, a fuzzy set is a class with fuzzy boundaries. Let U be the universe of discourse, U = [ul, u2, ..., u,}. A fuzzy set A of U is defined by A = f A ( U l ) / U l +f~I(U2)/U 2 -}- "'" +JA(Un)/Un, (2) where JA is the membership function of A, Ja: U--* [0, 1], and Ja(ui) indicates the grade of membership of ui in A, where fa(Ui)e [0, 1] and 1 ~< i ~< n. The definitions of fuzzy time series are reviewed as follows.
Definition 2.1. Let Y(t) (t . . . 0, 1, 2 . . . . ), a sub-
set of ~, be the universe of discourse on which fuzzy sets fdt) (i = 1,2 . . . . ) are defined and let F(t) be a collection offdt) (i = 1, 2 . . . . ). Then, F(t) is called a fuzzy time series on Y(t) (t . . . 0, 1,2 . . . . ).
From Definition 2.1, we can see that F(t) can be regarded as a linguistic variable [9] and f/(t)
(i = 1,2 . . . . ) can be viewed as possible linguistic values of F(t), where J~(t) (i = 1, 2, ... ) are repre- sented by fuzzy sets. We also can see that F(t) is a function of time t, i.e., the values of F(t) can be different at different times due to the fact that the universe of discourse can be different at different times. According to [3], if F(t) is caused by F(t - 1) only, then this relationship is represented by
F(t - 1) ~ F(t).
Definition 2.2. Let F(t) be a fuzzy time series. If for
any time t, F(t) = F(t - 1) and F(t) only has finite elements, then F(t) is called a time-invariant fuzzy time series. Otherwise, it is called a time-variant fuzzy time series.
In [4], Song and Chissom have used the follow- ing two examples to explain the concepts of fuzzy time series:
(1) Observe the weather of a certain place in North America, begin from the first day and ending with the last day of a year, where the common daily words (i.e., "good", "very good", "quite good", "very very good", "cool", "very cool", "quite cool", "'hot", "very hot", "cold", "very cold", "quite cold", '~very very cold", ..., etc.) are used to describe the weather conditions and these words are repre- sented by fuzzy sets.
(2) Observe the m o o d of a person with normal mental conditions during a period of time, where the mood of a person can be expressed according to his own feeling using fuzzy sets "good", "very good", "very very good", "really good", "bad", "not bad", "not too bad", ..., etc.
In [4], Song and Chissom also pointed out that the above two examples are dynamic processes and their observations are fuzzy sets; the conventional time series models are no longer applicable to de- scribe these processes. F o r more details, please refer to [3, 4].
3. A new method for forecasting enrollments with fuzzy time series
In [3], Song and Chissom applied the fuzzy times series model to propose a step-by-step procedure for forecasting the enrollments of the University of
S.-M. Chen / F u z z v Sets and Systems 81 (1996) 3 1 1 - 3 1 9 313
Alabama. The method presented in [3] uses the following model for forecasting the enrollments: A i = A i _ 1 ~ R ,
where Ai_ 1 is the enrollment of year i - 1 in terms of a fuzzy set and Ai is the forecasted enrollment of year i in terms of a fuzzy set, R is a fuzzy relation indicating fuzzy relationships between fuzzy time series, and '~ is the max min composition operator. However, the derivation of the fuzzy relation R is a very tedious work, and the m a x min composition operations will take a large a m o u n t of time when the fuzzy relation R is very big. F o r example, let A~ ~ ,4~+~ denote the fuzzy logical relationship "If the enrollment of year i is Ai, then that of year i + 1 is A~+~", where A~ and A~+~ are fuzzy sets, and let us consider the following fuzzy logical relationships shown in
[3]:
A1 ~ A 1 , A1 ---~A2, A3 ~ A4, A4 ~ A 4 , A6 ~ A 6 , A 6 ~AT.
Az ~ A 3 , A3--*A3, A 4 ~ A3, A4 ~ A 6 , (3)The method proposed by Song and Chissom [3] for deriving the fuzzy relation R of (1) is sum- marized as follows. Firstly, Song and Chissom de- fined an o p e r a t o r " x " of two vectors. Let D and B be row vectors of dimension m and let C = (cij) = D v x B, then the element ci~ of matrix C at row i and column j is defined as clj = min(Di, Bj) (i,j = 1 . . . m), where D~ and Bj are the ith and the jth elements of D and B, respectively, and D T is the transpose of D. Then, based on the above fuzzy logical relationships and the " x " operator, the fol- lowing relations are obtained:
R 1 = A~ x Aa, R2 = A~ x A2, R 3 = A~ x A 3 , R4 = A~ x A 3 , R5 = A~ x A 4 , R 6 = A~ x A 4 , R7 = A T x A3, R8 = A T x A 6 , R9 = A~ x A 6 , Rio = A~ x AT. (4)
Finally, the fuzzy relation R is obtained by per- forming the following operations:
lO
R = / ) Ri, (5)
i--1
where " U " is the union operator. It is obvious that the derivation of the fuzzy relation R is a very tedious work, and the m a x - r a i n composition op- erations will take a large a m o u n t of time when the fuzzy relation R is very big. Thus, we must develop a new method to forecast university enrollments in a more efficient manner.
In the following, we propose a new method to efficiently forecast university enrollments with fuzzy time series based on [3, 4], where the data of historical enrollments of the University of A l a b a m a shown in [3, 5] are used to illustrate the forecasting process of the proposed method. The method is essentially a modification of the one presented in [3]. It is more efficient than the one presented in [3] due to the fact that it uses simplified arithmetic operations rather than the complicated m a x - m i n composition operations presented in [3].
Let Omi n and Dmax be the m i n i m u m enrollment and the m a x i m u m enrollment of known historical data. Based o n Omi n and D . . . . we define the uni- verse of discourse U a s [ D m i n - - D1,Dmax + D2], where D1 and O 2 a r e two proper positive numbers. According to the data of actual enrollments of the University of A l a b a m a shown in [5], we can see that Omi n = 13055 and Dma x = 19337. Thus, ini- tially, we let Da = 55 and D 2 ---- 663. Thus, in this paper, the universe of discourse U = [13000,20000]. The method for forecasting the university enrollments is presented as follows.
S t e p 1: Partition the universe of discourse
U = [Drnin - D1, Dmax -[- D 2 ] into even lengthy and equal length intervals ul, u2, . . . , urn. In this paper, we partition U = [13000,20000] into seven inter- vals Ul, u2, u3, u 4 , u s , u6, and uT, where ul = [13000, 14000], u2 = [14000, 15 000], u3 = 1-15000, 16000], u4 = [16000, 17 000], u5 = [17000, 18000], u6 = [18000, 19000], and u7 = [19000,20000].
S t e p 2: Let A 1 , A 2 , ... , A k be fuzzy sets which are linguistic values of the linguistic variable "en- rollments". Define fuzzy sets A1, A2 . . . Ak on the universe of discourse U as follows:
A 1 = a l l / / ~ 1 -~- a l 2 / U 2 -q- . . . ~ a l m / U m ,
A 2 = a 2 1 / u 1 -[- a 2 2 / u 2 q- . . . h- a2m/blm, (6)
314 S.-M. Chen / Fuzz)' Sets" a n d Systems 81 (1996) 311 319
where a i j e [ 0 , 1 ] , l<<.i<<.k, and 1 ~<j~<m. The value of aij indicates the grade of membership of uj in the fuzzy set A/, where ai~ e [0, 1], I <~ i <<, k, and 1 ~< j ~< m. Find out the degree of each year's enrollments belonging to each Ai (i = 1,2 . . . m). If the maximum membership of one year's enrollment is under Ak, then the fuzzified enrollment for this year is treated as Ak. Then, fuzzy logical relation- ships are derived based on the fuzzified historical enrollments. In this study, the following linguistic values A1 = ( n o t many), A2 = ( n o t too many),
A 3 = (many), A 4 = (many many), A5 = [very
m a n y ) , A 6 = ( t o o many), and A7 = ( t o o many
many) are adopted from [3], where
A1 = 1/ul + 0.5///2 4- O/bt 3
+ O/u4 + O/u5 + O/u6 + O/uT, A 2 = 0 . 5 / u I 4- l / u 2 + 0 . 5 / u 3
+ O/u4 + O/u5 + O/u6 + O/uT,
A 3 = O / U l + 0.5///2 + l / U 3
+ 0.5/u4 + O/u5 + O/u6 + O/uT, A4 = O/ul + O/u2 + 0.5/u3
+ 1///4 + 0.5/u5 + O/u6 + O/uv, (7)
A5 = O/ul + O/u2 + O/u3
+ 0.5/u,, + l/u5 + 0.5/u6 + O/uT,
A 6 = O/U 1 + 0 / / 1 2 At- O/U 3
4- O / u 4 + 0.5/U 5 4- l / u 6 4- 0.5/U7,
A7 = O/u1 + O/u2 + O/u3
+ O/u4 + O/u5 + 0.5/u6 + 1/uT.
The fuzzified historical enrollments of the enroll- ments of the University of Alabama are shown in Table 1 which are adopted from [5].
Then, the fuzzy logical relationships of the en- rollments can be obtained from Table 1 which are shown in Table 2, where the fuzzy logical relation- ship A i ~ A k means "If the enrollment of year i is
A.i, then that of year i + 1 is Ak", where Aj is called the current state of the enrollment, and Ak is called the next state of the enrollment (note: the repeated relationships are counted only once).
Table I
Fuzzified historical enrollments (data source: [5])
Year Actual enrollment Fuzzified enrollment
1971 13055 A1 1972 13563 At 1973 13867 At 1974 14696 A2 1975 15460 A3 1976 15311 A 3 1977 15603 A3 1978 15861 A3 1979 16807 ,44 1980 16919 A4 1981 16388 A4 1982 15433 A3 1983 15497 A3 1984 15145 A3 1985 15 163 A3 1986 15984 A3 1987 16859 A,, 1988 18 150 A 6 1989 18970 A~ 1990 19328 A7 1991 19337 Av 1992 18876 A~, Table 2
Fuzzy logical relationships of the enrollments
A l -s. A l A1 --* A 2 A2 ----, A 3 A3 ---~ A 3 A 3 --~ A 4 A ,t --* A 4 A 4 ---~ A 3 A., ---~ A 6 A~, --* A¢, A6 ~ A7 A7 ~ A7 Av ~ A6
Table 3
Fuzzy logical relationship groups
Group 1: Al ~,Ai A1 - ~ A 2 Group 2: A2 --* A3 Group 3: A3 + A3 A3 ~ A4 Group 4: A , , ~ A 4 A 4 - , A 3 Group 5: A6 ~ A6 A6 -~ A7 Group6 AT ~ A 7 Av--*A6 A 4 ~ A 6
Step 3: Divide the derived fuzzy logical relation- ships into groups based on the current states of the enrollments of fuzzy logical relationships. Thus, based on Table 2, we can obtain six fuzzy logical relationship groups shown in Table 3.
X-M. Chen / Fuzzv Sets and Systems 81 (1996) 311 319 315 Step 4: Calculate the forecasted outputs. The
calculations are carried out by the following principles:
(1) If the fuzzified enrollment of year i is At, and there is only one fuzzy logical relationship in the fuzzy logical relationship groups derived in Step 3 in which the current state of the enrollment is A t, which is shown as follows:
A j ~ ,4k,
where A t and A , are fuzzy sets and the maximum membership value of Ak occurs at interval Uk, and the midpoint of Uk is rag, then the forecasted enroll- ment of year i + 1 is rag.
(2) If the fuzzified enrollment of year i is A j, and there are the following fuzzy logical relationships in the fuzzy logical relationship groups derived in Step 3 in which the current states of the fuzzy logical relationships are A t, respectively, which is shown as follows:
A j ---r A k l ' A j --~ Ak2,
A j --.e, Akp.
where Aj,
Akl,Ak2
. . . Akp are fuzzy sets, and the maximum membership values of A k j , Ak2, . . . , Akp occur at intervals ul, u2, ... ,up, respectively, and the midpoints of Ux,U2 . . . up are m~,m2, ... ,mp, respectively, then the forecasted enrollment of year i + 1 is (ml + m2 + ... + mp)/p.(3) If the fuzzified enrollment of year i is A t, and there do not exist any fuzzy logical relationship groups whose current state of the enrollment is At, where the maximum membership value of Aj occurs at interval u j, and the midpoint of u i is mr, then the forecasted enrollment of year i + 1 is mr.
Thus, based on Tables 1 and 3, we can forecast the enrollments of the University of Alabama from 1972 to 1992 by the proposed method. In the fol- lowing, we only illustrate the forecasting process of the years 1972, 1975, 1976, 1980, 1989, and 1991. The same procedure can be applied on the years 1973, 1974, 1977, 1978, 1979, 1981 . . . . ,1988, 1990, and 1992.
[1972]: Because the fuzzified enrollment of 1971 shown in Table 1 is A1, and from Table 3, we can see that there are the following fuzzy logical rela- tionships in group 1 of Table 3 in which the current states of the fuzzy logical relationships are A l, respectively, which is shown as follows:
A1 ~ A I , A1 -*A2,
where the maximum membership values of the fuzzy sets A1 and A2 occur at intervals ul and u2, respectively, where u~ = [13 000, 14000] and u2 = [14 000, 15 000], and the midpoints of the intervals ul and u2 are 13 500 and 14 500, respectively. Thus, the forecasted enrollment of 1972 is equal to ½(13 500 + 1 4 5 0 0 ) = 14000.
[1975]: Because the fuzzified enrollment of 1974 shown in Table 1 is A2, and from Table 3, we can see that there is the following fuzzy logical relation- ship in group 2 of Table 3 in which the current state of the fuzzy logical relationship is A2, which is shown as follows:
A2 --* A 3 ,
and the maximum membership value of the fuzzy set A3 occurs at interval u3, where u3 = [15000, 16000], and the midpoint of u3 is 15500. Thus, the forecasted enrollment of 1975 is equal to 15 500.
[1976]: Because the fuzzified enrollment of 1975 shown in Table 1 is A3, and from Table 3, we can see that there are the following fuzzy logical rela- tionships shown in group 3 of Table 3 in which the current states of the fuzzy logical relationships are A3, respectively, which is shown as follows: A3 "* A3, A3 ~ A4,
where the maximum membership values of the fuzzy sets A 3 and A4 occur at intervals u3 and u4, respectively, where u3 = [15000,16000] and u4 = [16000, 17000], and the midpoints of the in- tervals u3 and u4 are 15500 and 16500, respect- ively. Thus, the forecasted enrollment of 1976 is equal to ½(15 500 + 16500) = 16000.
[ 1980]: Because the fuzzified enrollment of 1979 shown in Table 1 is A4, and from Table 3, we can see that there are the following fuzzy logical rela- tionships shown in group 4 of Table 3 in which the current states of the fuzzy logical relationships are
316 S.-M. Chen /' Fuzzy Sets and Systems 81 (1996) 311 319
Table 4
A comparison of the forecasted methods
Year Actual enrollment Forecasted enrollment Forecasted enrollment (data sources [5]): by Song and Chissom [3] by the proposed method 1971 13055 1972 13563 14000 14000 1973 13867 14000 14000 1974 14 696 14000 14000 1975 15460 15500 15500 1976 15311 16000 16000 1977 15603 16000 16000 1978 15861 16000 16000 1979 16807 16000 16000 1980 16919 16813 16833 1981 16388 16813 16833 1982 15433 16709 16833 1983 15497 16000 16000 1984 15145 16000 16000 1985 15163 16000 16000 1986 15984 16000 16000 1987 16859 16000 16000 1988 18150 16813 16833 1989 18970 19000 19000 1990 19328 19(100 19000 1991 19337 19000 19000 1992 18876 Not forecasted 19000
A4, respectively, which is shown as follows: A4 --* A 4 , A4 ---' A3, A4 - * A 6 ,
where the m a x i m u m membership values of the fuzzy sets A4, A3, and A 6 o c c u r at intervals Ua, u3, and u6, respectively, where u4 = [16000, 170001, u3 = [15000, 16000] and u6 = [18000, 190001, and the midpoints of u4, u3, and u6 are 16 500, 15 500, and 18 500, respectively. Thus, the fore- casted enrollment of 1980 is equal to ½(16500 + 15500 + 18500) = 16833.
[19891: Because the fuzzified enrollment of 1988 shown in Table 1 is A 6 , and from Table 3, we can see that there are the following fuzzy logical rela- tionships shown in group 5 of Table 3 in which the current states of the fuzzy logical relationships are
A6, respectively, which is shown as follows: A6 ~ A6, A6 ~ AT,
where the m a x i m u m membership values of the fuzzy sets A 6 and Av occur at intervals u6 and uv, respectively, where u6 = [18000, 19000] and uv = [19000,200001, and the midpoints of u6 and
u7 are 18500 and 19500, respectively. Thus, the forecasted enrollment of 1989 is equal to 1(18 500 + 19 500) = 19000.
[1991]: Because the fuzzified enrollment of 1990 shown in Table 1 is AT, and from Table 3, we can see that there are the following fuzzy logical rela- tionships shown in group 6 of Table 3 in which the current states of the fuzzy logical relationships are AT, respectively, which is shown as follows: A7 ---' A 7 , A 7 --~ A 6 ,
where the m a x i m u m membership values of the fuzzy sets A7 and A6 occur at intervals uv and u6, respectively, where u7 = [19000,20000] and u6 = [18000, 190001, and the midpoints of uv and u6 are 19 500 and 18 500, respectively. Thus, the forecasted enrollment of 1991 is equal to 1(19 500 + 18 500) = 19 000.
In summary, a comparison of the actual enroll- ments of the University of Alabama, the forecasted enrollments by S o n g - C h i s s o m method [3], and the forecasted enrollment by the proposed method is shown in Table 4.
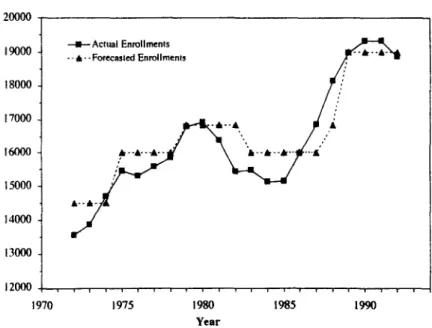
S.-M. Chen / Fuzzy Sets and Systems 81 (1996) 3 1 1 - 3 1 9 Number of StudenCs 20000 1900O 180OO 17000 16O00 15O00 14OOO 13OO0 12000 197
7"
, w i f i u n v i v i i " ' l I i I i 1975 1980 1985 19qO YearFig. 1. Forecasted enrollments and actual enrollments.
317
F r o m Table 4, we can see that the forecasted results of the.proposed method is very close to that of the Song-Chissom method presented in [3]. The curves of the actual enrollments and the forecasted enrollments of the proposed method are shown in Fig. 1, where the solid line is the actual enrollment and the dashed line is the forecasted enrollment. It is obvious that the proposed method is more effi- cient than the one presented in [-3] due to the fact that the proposed method uses simplified arith- metic operations rather than the complicated m a x - m i n composition operations presented in [3].
4. Robustness of the proposed method
In this section, we test the robustness of the proposed method to show the proposed method can still yield good forecasting results when the historical data are not accurate. In order to test the robustness of the proposed method, we adopted the example shown in [3,5] to increase a few year's enrollment data by 5% with the rest of the data unchanged, i.e., the university enrollments of 1974, 1978, 1985, and 1990 are increased by 5%. In this
Table 5
Fuzzy logical relationships derived from the changed historical enrollment data
A~ ~ A~ AI ~ A3 A3 --~ A3 A3 --, A 4 A4 -.-, A 4 A4 --, A3 A4 --+ A6 A6 ---~ A6 A6 --* A7 A7 ~ A7 A7 -'* A6
case, the fuzzy logical relationships obtained from the changed historical enrollment data are shown in Table 5.
By applying the proposed method, the forecasted enrollments from 1972 to 1992 can be evaluated. The curves of the actual enrollments and the fore- casted enrollments are shown in Fig. 2, where the solid line is the actual enrollment and the dashed line is the forecasted enrollment. The forecasting errors range from 0.10% to 9.07%, and the average error is 3.23%. The average error of the proposed method is smaller than the one presented in [3]. F r o m Fig. 2, we can see that as time increases, the forecasting error decreases. This shows that even if the historical data are not accurate, the proposed method can still make good forecasts.
318 S.-M. Chert / Fuzzy Sets and Systems 81 (1996) 311 319 N u m b e r of Students 2OOOO 19000 18OO0 17000 1600O 15000 14000 13000 12000 , 1970 • A c t u a l E n r o l l m e n l s - - i - - F o r e c a s l e d E n r o l l m e n l s . l - - - I I
/'/:;"
y ~ . - - i f i i i i , , i i ~ i i J v i w i v 1975 1980 1985 1990 YearFig. 2. Curves of forecasted enrollments and actual enrollments.
5. Conclusions
In this paper, we present a new method to fore- cast university enrollments based on fuzzy time series, where the data of historical enrollments of the University of Alabama are adopted from [3, 51 to illustrate the forecasting processes, and the robustness of the proposed method is tested. From the illustrative example, we can see that the proposed method not only can make good fore- casts of the university enrollments, but also can make robust forecasts when the historical enroll- ment data are not accurate. The proposed method is more efficient than the one presented in [3] due to the fact that the proposed method uses simplified arithmetic operations rather than the complicated max-min composition operations presented in [3].
Acknowledgements
The author would like to thank the referees for providing very helpful comments and suggestions. Their insight and comments led to a better pre- sentation of the ideas expressed in this paper. This
work was supported in part by the National Science Council, Republic of China, under Grant NSC 85-2213-E-009-123.
References
[1] H. Bintley, Time series analysis with REVEAL, Fuzzy Sets
and Systems 23 (1987) 97 118.
[2] A. Kaufmann and M.M. Gupta, Fuzzy Mathematical
Models in Enoineerin9 and Management Sciences (North-
Holland, Amsterdam, 1988).
[3] Q. Song and B.S. Chissom, Forecasting enrollments with fuzzy time series - part I, Fuzzy Sets and Systems 54 (1993)
1 9.
[4] Q. Song and B.S. Chissom, Fuzzy time series and its models, Fuzzy Sets and Systems 54 (1993) 269-277. [5] Q. Song and B.S. Chissom, Forecasting enrollments with
fuzzy time series - part II, Fuzzy Sets and Systems 62 (1994) 1-8.
[6] W. Wu, Fuzzy reasoning and fuzzy relational equations,
Fuzzy Sets and Systems 20 (1986) 67 78.
[7] L.A. Zadeh, Fuzzy sets, Inform. and Control 8 (1965) 338-353.
[8] L.A. Zadeh, Outline of a new approach to the analysis of complex systems and decision processes, IEEE Trans.
S.-M. Chen / Fuzzy Sets and Systems 81 (1996) 311-319 319
[9] L.A. Zadeh, The concept of a linguistic variable and its application to approximate reasoning, parts I-3, Inform.
Sci. 8 (1975) 199-249; 8 (1975) 301 357; 9 (1975) 43-80.
[10] Li Zuoyoung, Chen Zhenpei and Li Jitao, A model of weather forecast by fuzzy grade statistics, Fuzzy Sets and