Pergamon
Int. Comm. H e a t M a s s Transfer, Vol. 23, No. 1, pp. 79-90, 1996
Copyright © 1996 Elsevier Science Ltd Printed in the USA. All rights reserved 0735-1933/96 $12.00 + .00
0735-1933(95)00086-0
F I L M C O N D E N S A T I O N OF HCFC-22 ON H O R I Z O N T A L E N H A N C E D T U B E S
W.Y. Cheng, C.C. Wang and Y.Z. Robert Hu Energy Resources Laboratory Industrial Technology Research Institute
Hsinchu,Taiwan L.W. Huang
Department of Mechanical Engineering National Chiao Tung University
Hsinchu, Taiwan
( C o m m u n i c a t e d by J.P. Hartnett and W.J. Minkowycz) ABSTRACT
Experiments were conducted to study the condensation heat transfer characteristics of horizontal enhanced tubes. In the current experiment, six different enhanced tubes, including 26, 40 fpi low fin tubes and four three-dimensional-fin tubes, were tested. The working fluid used in the experiment was HCFC-22 Data were presented in the form of overall heat transfer coefficient at three working pressures, namely 1.32, 1.47 and 1.62 Mpa, In addition, the condensing heat transfer coefficients for the test tubes were obtained from the Wilson plot technique.
Introduction
Horizontal integral-fin tubing has been used for condensation of refrigerants and other low surface tension fluids since the early 1940s. Since then, integral-fin tubes have proved to be effective in condensing applications including refrigeration and process industries. An analytical model developed by Beatty and Katz [1] was often used for condenser design. Their analysis is based on the assumption that gravity dominates the condensate drainage. Since it neglects surface tension effects, their theoretical model lacks generality. Webb et al. [2] proposed an analytical model, taking surface tension effects into account. This model predicted their condensing heat transfer coefficients within _+20%. Honda et al. [3] developed a
80 W.Y. Cheng, C.C. Wang, Y.Z.R. H u and L.W. H u a n g Vol. 23, No. 1
complex model to predict the pcrfonnance of a column of horizontal low fin tubes.
Many
experiments have been conducted on the investigation of condensation heat transfer for integral-fin tubes, as reviewed by Marto [4], who provided a chronological listing of relevant references that provide cxperimental heat transfer data for horizontal low fin tubes. Recently, Webb and Murawski [5] and Honda et al. [6] measured the row-by-row heat transfcr coefficients for R - l l and R-113 condensing on the vertical columns of horizontal tubes. Both sets of experimental data indicated that the row effect was relatively small for low fin tubing. Meanwhile, their test results also indicated that the effect of condensate inundation on the thrcc- dimensional-fin tubes was more significant than that on the low fin tubes. Many investigations have been devoted to the heat transfer study of condensation of refrigerant HCFC-22 on integral tubes. However, the test configurations tested b5 previous investigators were for low fin density tubes, which has fewer number of fins per unit length, (for instance, Beattty and Katz [ 1 ], Katz and Geist [7] and Pearson and Withers [8]). In the meantime, progress in mass production techniques has led to higher fin densities and to the development of complex surface geometries currently uscd in condcnser tubings. Therefore, the objective of the present study is to present new experimental data on the enhanced surfaces which are ve~, popular nowadays.Test SetuP
As depicted in Figure 1, the test facility is composed of a natural circulation refrigeration system and a forced circulation loop of cooling water. Refrigerant vapor was generated from a stainless boiler fitted with immersion coils which can provide heating capacity up to 60 kW. Saturated refrigerant vapor from the boiler then passed through the pipe line, and entered the test condenser through three vapor inlets. In order to distribute the vapor evenly within the test section, a welded mesh screen was installed at the top of the test cell. Generally, the refrigerant vapor velocity within the test section was less than 0.1 m/s. As a result, the shear force effect was negligible in the present investigation. The refrigerant vapor then condensed on the test tube and gathered at the bottom of the test section and flowed down to the boiler by gravity.
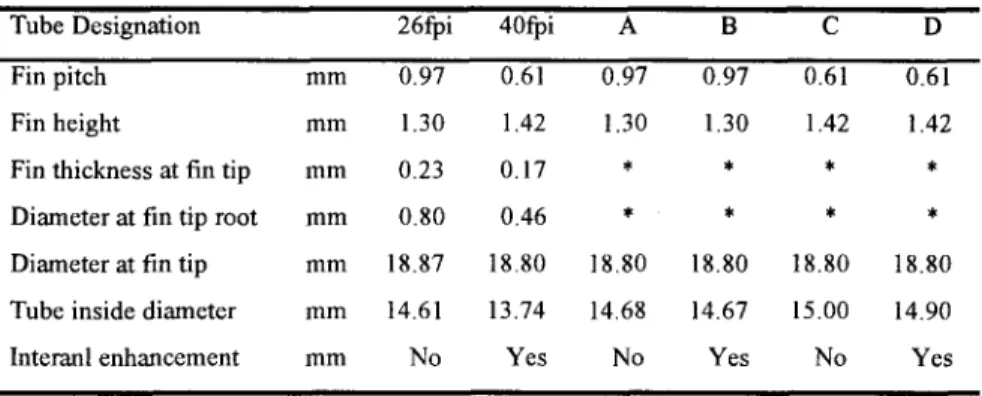
Figure 2 shows the details of the test condenser. It is a horizontal configuration consisting of two tubes. The two adjacent tubes were connected by a U-bend. Each test tube is a 1220-ram-long fully finned tube lengthened with plain end sections. Six enhanced tubes including 26, 40 fpi low finned tubes and four three-dimensional-fin tubes were tested. Note that these tubes are all commercially available. The detail dimensions of the test tubes are tabulated in Table 1. The longitudinal cross-sectional area and close-up of the test tubes are shown in Figure 3. The fin pitches of the three-dimensional tube are 26 and 40 fpi respectively. As illustrated in Figure 3, some of the test tubes also have internal enhancements (40 fpi low fin tube, 26 fpi and 40 fpi three-dimensional tube). Cooling water circulating in the test tubes was supplied
Vol. 23, No. 1 F I L M C O N D E N S A T I O N O F H C F C - 2 2 81
TABLE 1 Dimensions o f the enhanced tubes
Tube Designation 26fpi 40fpi A B C D
Fin pitch mm 0.97 0.61 0.97 0.97 0.61 0.61
Fin height mm 1.30 1.42 1.30 1.30 1.42 1.42
Fin thickness at fin tip mm 0.23 0.17 * * * *
Diameter at fin tip root m m 0.80 0.46 * * * *
Diameter at fin tip mm 18.87 18.80 18.80 18.80 18.80 18.80
Tube inside diameter mm 1 4 . 6 1 13.74 14.68 14.67 15.00 14.90
Interanl enhancement mm No Yes No Yes No Yes
by a thermostat, which can provide a cooling capacity up to 30 kW, and the inlet temperature variation is controlled within +0.2 ° C.
The vapor pressure was measured by a precision pressure transducer, reading to 100 Pa, and connected to a pressure tap on the duct wall located 120 mm upstream o f the test tubes. The vapor temperature was measured by two 3.2 mm O D . RTDs (Ptl00f2), which were inserted in the test section through holes on the duct wall located 80 mm upstream o f the test tubes. The cooling water temperatures at the inlet and exit o f the test tubes were measured by pre-calibrated RTDs (Ptl00f2). Three mixing inserts with length 200 m m were installed at the water coolant exit to provide better mixing condition for the water. All the RTDs were pre-calibrated by a quartz thermometer with resolution up to 0.01 ° C. The cooling water flow rate for each row was measured by a magnetic flowmeter with calibrated accuracy 0.02 L/s. For each test run, both the inlet water temperature and flow rate o f the cooling water in the test tubes were maintained at the same value.
The system was leak free, which was done by using both halogen leak detector and leak detection spray, before it was evacuated. Then, the system was evacuated using a vacuum pump. The vacuum pump continued working for another two hours after the gauge manometer reached zero to ensure that it contained no noncondensible gases. Finally, the refrigerant was charged into the system.
All the signals, including those from RTDs (Pt 100f2), magnetic flow meters and pressure transducer, were collected and converted by a hybrid recorder. The digital signals then were sent to the host computer through a GPIB interface for further operations. Uncertainties in the reported experimental values o f the heat transfer coefficients, following the single-sample uncertainty analysis proposed by Moffat [9]° were estimated to be within _+8% for 26 fpi low fin tube, and approximately _+15% for other tubes.
82 W.Y. Cheng, C.C. Wang, Y.Z.R. H u and L.W. H u a n g VoL 23, No. 1
Data Reduction
Data were analyzed by the Wilson plot method [1()]. The experimentally detennined resistance 1/UA
in the test tube is rclated to individual thcmml resistances as
l 1 1
- + R + R ~ - - - ( 1 )
U A h A f w h.A,
0 0 0 o I 1
where ho and h~ represent thc average outside and inside heat trmlsfer coefficients, and R r and R,. denote fouling and wall resistanccs, respcctivel5. In the present calculation, the overall resistance is based on the nominal surface area, which is cvaluated as ~DoL, where D o is the dimncter over the fins. Thc detemfination of the overall resistance is quite easy from
0
IdA - ( 2 )
L M T D
Where Q, the average heat transfer rate, is calculated from
Q m w a t e r C p A T (3)
where AT is the temperature rise on the water coolant, and thc mean temperature difference L M T D is
L M T D (4)
AT = T - T (5)
1 s 1
a T 2 = r ~ - r 2 (6)
where Ts, is the saturation temperature of the refrigerant and T 1 and T 2 arc the inlet and outlet temperature of the water coolant, respectively.
To determine the hcat transfer resistance of the enhanced tube by the Wilson plot method [ 10], the condensing coefficient is kept constant. The inside tube resistance is calculated using the Dittus and Boeltcr [11] correlation fore1, which is given by
Nu = C i Re0.8 pr0.4 (7)
Where C i is a constant. Our experimental data indicate that the exponent changes for internally enhanced tubes at low Rcynolds number region (Re<7000), and then reach a constant value (reD' close to 0.8). Sincc
Vol. 23, No. 1 F I L M C O N D E N S A T I O N O F HCFC-22 83
most our experimental data are much higher than 7000. Therefore, the exponent of Reynolds number is fixed in the present investigation.
It is known that the Nusselt expression [12] for a single plain horizontal tube is given by:
k?p2g~
11~4
ho--0725
(8)
Since
T,-Tw=Q/hoAo,
with a simple mathematical operation, Eq. (8) can be rewritten asTherefore, to apply the Wilson plot method [10], during the data reduction process, the condensing coefficient must be maintained constant. As shown in Equation (9), the heat flux should be controlled at a fixed level for a given pressure during the experiment. Hence, Equation (1) can be rewritten as
( 1 - R f - R w l =
1 + 1
(10)U o A o
hi A i h o A o
Fouling effect was neglected in this study. The tube side heat transfer coefficient, h~, is assumed to have the following form:
0.8 0.4
hi=c. ki (PiViDil
(CPi~ti)
(11)'Di\ Di )
\ ki )
Equation (10) then becomes
( U ~ o R
_ _ f
R w 3 = ~
1 +---~.,,A1 (12)C i
Re0.8 Pr0.4A i h
Di
Equation (12) has the linear form
Y = mX+b
(13)where
I 1 - R f - R w )
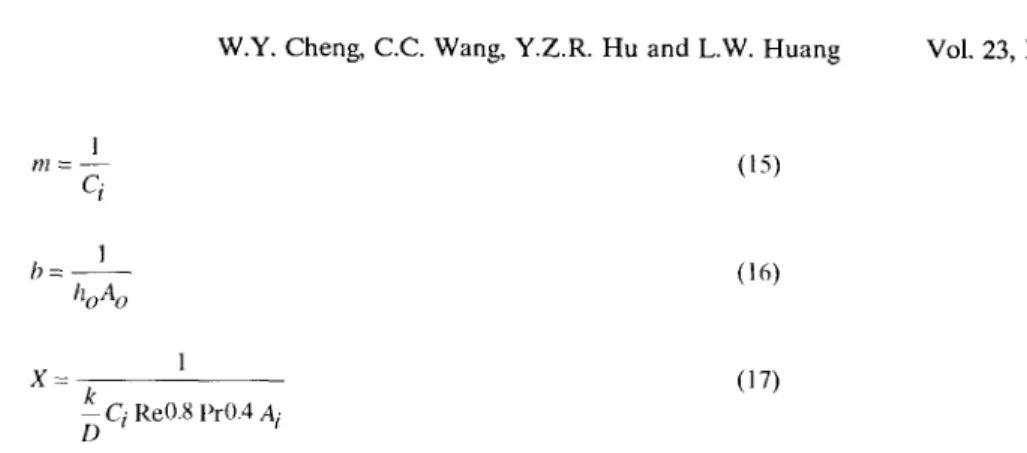
(14)84 W.Y. Cheng, C.C. Wang, Y.Z.R. H u and L.W. H u a n g Vol. 23, No. 1 1 m = - - (15) q 1 b - (16)
hoAo
1 X = k (17)D Ci
Re0.8 l'rO.4a i
Therefore, with a simple linear regression, the slope of the resulting straight fine is equal to 1/C~ and the intercept is equal to 1/(boA o ). Consequently, for a given heat flux and pressure, the inside and outside heat transfer coefficients can be determined simultaneously. Figure 4 gives the result of the linear rcgression for condensation of HCFC-22 on a 26 fpi tube for three different pressures: nanlely 1.32, 1.47 and 1.62 MPa. As shown in the Figure, the slopes of the regression lines wcrc parallcl to each other, this indicates that the choice of Wilson plot function on tile tubc side is appropriate. Actually, the reciprocals of the slope of the linear regression linc were 0.0248, 0.0246 and 0.0239, respectively. The experimental results, which agree very well with Dittus and Boelter [13] correlation, validate the present setup. Table 2 shows all the C~ values for all tubes tested at three different pressures (1.32, 1.47 and 1.62 MPa).
TABLE 2 C1 values from Wilson plot method. Tube 13atm 14.5arm 16atm 26fpi 0.0248 0.0246 0.0239 40fpi 0.0468 0.0475 0.0479 A 0.0244 0.02385 0.0241 B 0.04152 0.0423 0.0431 C 0.0245 0.0243 0.0246 D 0.04001 0.0434 0.0438
Test Results and Discussions
Figure 5 shows the heat transfer coefficient versus temperature difference for various enhanced tubes. As depicted in Figure 3, tube A, B and tube C, D are of identical configuration except tubes A and C, which have internal enhancement. For the sake of clarity, only four tubes are displayed in this figure. As illustrated in the Figure, tube A has the highest heat transfer coefficients, then tube C, 40 fpi tube and 26 fpi low fin tube, respectively. For comparison purpose, a smooth tube data are also drawn in the Figure 5. For
Vol. 23, No. 1 F I L M C O N D E N S A T I O N O F H C F C - 2 2 85
highly enhanced surfaces (tube A and C), the heat transfer coefficient drops sharply at small temperature difference then levels offat higher temperature difference region. This phenomena is also reported by Huber et al. [14,15], for testing Tu-Cii bundles with R134a refrigerant. This result reveals that to obtain average heat transfer coefficients for highly enhanced surfaces, the Wilson plot technique may be a better choice than using a modified wilson plot method. In order to apply a modified Wilson plot technique, one must suggest a Wilson plot function on the shell side. The heat transfer coefficient for highly enhanced surfaces exhibits a nonlinear dependence on temperature difference dependence. Therefore, suitable modified Wilson Plot function is not easy to obtain (for instance, Nusselt expression). Meanwhile, the heat transfer coefficient vs. temperature difference for low fin tubes is much milder compared to enhanced surfaces (Tube A and C).
Figure 6 shows the dependence o f the overall heat transfer coefficient on coolant velocities, for the tubes tested. For comparison, Nusselt solution for plain tube is also displayed in the figure. The system pressure was kept unchanged at 1.47 MPa during the experiments. The overall heat transfer coefficient for the plain tube shows no significant improvement as water coolant flowrate increases. This indicates that the dominant thermal resistance is on the shell side. Therefore, use of enhanced tubes can provide higher overall heat transfer rate. Again, the figure also indicates that tube D exhibits the highest overall heat transfer coefficients as water coolant velocities change. Meanwhile, tube A and C show similar overall heat transfer coefficients. As illustrated previously in Figure 3, tube A and C are of similar surface configuration except that the fin pitches for A is 26 and 40 for C. For highly enhanced surfaces, the dominant thermal resistance is no longer on the shell side. Actually, for tube A and C, the thermal resistance ratio for A and C (i.e. h o A o / h i A i , p= 1.47 MPa) are approximately equal to 4.34 and 4.28, respectively. This indicates that the dominant thermal resistance is no longer on the shell side. As a result, in order to improve the overall heat transfer coefficient, internal enhancements are needed. That is why tube C shows higher heat transfer coefficient than tube A, but no significant improvement on overall heat transfer coefficient are reported. Therefore tube B and D, which have internal enhancements, provides significant improvements over tube A and C, which have no internal enhancements.
Figure 7 shows the effect of condensing pressure on the test tubes A and C. As expected, the overall heat transfer coefficient decreases with increasing pressure. In addition, the overall heat transfer coefficient for tube A and C are very close to each other at medium and high pressure ( 1.47 and 1.62 MPa respectively). However, as the condensing pressure decrease to 1.32 MPa, it is observed that tube C shows a higher overall heat transfer coefficient than tube A. This can be further explained from Figure 5. As noted in Figure 5, the heat transfer coefficient drops significantly with temperature difference AT (T s - T w). Consequently, at medium and high pressure, the temperature difference is subjected to larger values, which corresponds to
86 W.Y. Cheng, C.C. Wang, Y.Z.R. H u a n d L.W. H u a n g Vol. 23, No. 1
the level off region o f the condensing heat transfer coefficient. Accordingly, the heat transfer coefficient for both tube A mad tube C differs little, which results in similar overall heat transfer coefficient. In the meantime, at a lower pressure (p=1.32 MPa), the driving potential temperature difference is smaller which corresponds to the larger heat transfer coefficient region. In this region, tube C shows a much larger heat transfer coefficient than tube A. As a result, the overall heat transfer coefficient for tube C is much larger than tube A at low pressure region.
Conclusions
Overall heat transfer coefficients and condensing heat transfer coefficients for various cnhanced tubings and low fin tubes were obtained and compared with each other. In addition, effect o f condensing pressure on the overall heat transfer coefficients tbr the enhanced tubes are also investigated. It was found that the three-dimensional fin tubes show a larger heat transfer coefficients compared to low fin tubes in the present study. However, the heat transfer cocfficients for three dimensional tubes are found to decrease more sharply as the temperature difference increase compared to low fin tubes. This indicates that heat transfer behavior for the tested three-dimensional tubes is significantly different from low fin surfaces. As a result, the selection of a Wilson plot function in thc modified Wilson plot technique is somewhat difficult compared to the Wilson plot m e t h o d Therefore, in order to determine heat transfer coefficients for highly enhanced surfaces, it is recommended that the Wilson plot technique (keeping the heat flux constant) be used.
Acknowledgments
The authors would like to express gratitude for the Energy R&D foundation funding from the Energy Commission of the M i n i s t ~ of Economic Affairs, which provide financial support for the present study.
A heat transfer area of the tube Ao outside heat transfer area of the tube A~ inside heat transfer area of the tube b intercept o f line with ordinate ('~ constant for inside heat transfer
correlation
Cp heat capacity of water
D o envelop diameter of the test tube g gravitation constant
h i inside heat transfer coefficient
Nomenclature
k~ thermal conductivity of refrigerant
12t/1TD log mean temperature difference
m slope of least square line
mw~ter average mass flow rate of coolant water
Nu Nusselt number
Pr Prandtl number o f the water coolant p condensing pressure
Vol. 23, No. 1 F I L M C O N D E N S A T I O N O F H C F C - 2 2 87
Re Reynolds number of the water coolant
Rf fouling resistance Rw wall resistance
T~ inlet temperature of water T 2 outlet temperature of water
~ saturation temperature of the refrigerant A T temperature rise on the water coolant Greek Symbols
9l density o f refrigerant
9~ latent heat of condensing vapor Subscripts
1 inlet 2 outlet f fouling
i tube side (water side)
2.
3.
4.
AT~ temperature difference, A T 1 = ~ - T~ AT z temperature difference, A T e = T~ - T 2 U overall heat transfer coefficient
Uo overall heat transfer coefficient X Wilson plot function
F Wilson plot function
~t l viscosity of refrigerant
1 shell side (refrigerant side) o outside
w wall
References
K O . Jr. Beatty and D.L. Katz, " Condensation of Vapors on Outside of Finned Tubes,"Chemical
Engineering Progress, 40(1), 908 (1948)
R.L. Webb, T.M. Rudy and M.A, Kedzierski, " Prediction of the Condensation Coefficient on Horizontal Integral-Fin Tubes," J. of Heat Transfer, 107, 369 (1985)
H. Honda, S. Nozu and B. Uchima, " A Generalized Prediction Method for Heat Transfer During Film Condensation on a Horizontal Low Finned Tube," AS~-JSME Thermal Eng. Joint Conf 4,
385 (1987)
P.J. Marto, " An Evaluation of Film Condensation on Horizontal Integral-Fin Tubes," J of Heat Transfer. 110, 1287 (1988)
R.L. Webb and C.G. Murawski, " Row Effect for R-11 Condensation on Enhanced Tubes," a~ of Heat Transfer. 112, 768 (1990)
H. Honda, B. Uchima, S. Nozu, E. Torigoe and S. Imai, " F i l m Condensation of R-113 on Staggered Bundles of Horizontal Finned Tubes," ~ of Heat Transfer. 114, 442 (1992)
D.L. Katz and J.M. Geist, " Condensation on Six Finned Tubes in a Vertical Row," Trans. ASME,
70, 907 (1948)
J.F. Pearson and J.G. Withers, " New Finned Tube Configuration Improves Refrigerant Condensing," ASHARE J June, 77 (1969)
88 W.Y. Cheng, C.C. Wang, Y.Z.R. Hu and L.W. Huang Vol. 23, No. 1
9. R.J. Moffat, " Describing the Uncertainties in Experimental Results," Experimental Thermal and Fluid Science. 1, 3 (1988)
10. E.E. Wilson, "Basis for Rational Design of Heat Transfer Apparatus," Trans. ASME, 37, 47 (1915) 11. F.W. Dittus and L.M.K. Boelter, Univ. Calif. (Berkeley) Pub. Eng. 2, 443 (1930)
12. W. Nusselt, Die Oberfiachenkondensation des Wasserdampfes, VDI Z. 60, 541 (1916)
13. D.E. Briggs and EH. Young, " Modified Wilson Plot Techniques for Obtaining Heat Transfer Correlations for Shell and Tube Heat Exchangers," Chemical Engineering Progress Symposium Series. 65, 35 (1969)
14. J.B. Huber, L.E. Rewerts and M.B. Pate, "Shell side condensation heat transfer of R-134a," Part 1: Finned-tube performance, ASHARE Trans. Part 2 (1994)
15. J.B. Huber, LE. Rewerts and M.B. Pate, " Shell side condensation heat transfer of R-134a," Part 2: Enhanced-tube performance, ASHARE Trans. Part 2 (1994)
Legend:
Cooling Wol~r Thermo~lol
~) Mog~ellc fro. m e t e ,
tnl~l W@~er T~mperoture Me~urlrl~ Prob~
~) vopo, o;,~,;buio, (~ Tes[ Sect;on
(~ Pressure Tronsduce, (~ Te~perotu~e Probe
~ O o ( l e [ Water Temperolvre Meosur~ng p-obe ~ ) H o t wotet Thefmo~tot
FIG. 1
Schematic Diagram of Test Apparatus v . ~
@
@
FIG. 2
Vol. 23, No. 1 FILM CONDENSATION OF HCFC-22 89
26
40
fpi
fpi
m
m
I
m
~' ~-~- ~i:-,;
~-;~-
%::
,~l~x:,~,\, , ~ ' ,t~, '. • • ~ " ;3 J ~ "¢~-k~r ~ "Tube A
Tube B
Tube C
Tube D
p, ~p ~. ~ ~ ~ ' , ,~ ~ /#1 ~ ,,i)~m FIG. 3Longitudinal Cross-Section and Surface Configuration of Test Tubes
90 W.Y. Cheng, C.C. Wang, Y.Z.R. H u a n d L.W. H u a n g Vol. 23, No. 1
100000
3 • : T.a.=32.8 °C L o c : T.~.=37.2 a L • : __T~sat=41"2 °C/
/ 2 - 2 //5//O j ~ - - ~ 1 • 26 fpi Tube 2 3 4 5 Re0.8 pr0.4 A i FIG. 4Wilson Plot for 26 fpi T u b e at T h r e e D i f f e r e n t P r e s s u r e (1.32, 1.47 a n d 1.62 M P a ) x 10 - 5 E I0000 Tsar=37.2 *C T1=29.5 °C
8000
/ ~ " " :
/, ~-:Tube A~
, -v-:Tube B ~-:Tube C -,~-:Tube D O':40 fpi Tube 2000 -e-:26 fpi Tube=c -z: ~ - : S ~ o o t h Tube ~/2~-,t_ -- 1 2 3 4 V(m/s) FIG. 6 Overall H e a t T r a n s f e r Coefficient V e r s u s C o o l a n t Velocity for All T u b e s T e s t e d
![TraditionalMLCalgorithmsmainlytacklethebatchMLCproblem,wheretheinputdataarepresentedinabatch[24,28].Nevertheless,inmanyMLCapplicationssuchase-mailcategorization[22],multi-labelexamplesarriveasastream.Onlineanalysisistherefore dimensionreducermotivatedbyma](data:image/gif;base64,R0lGODlhAQABAIAAAP///wAAACH5BAEAAAAALAAAAAABAAEAAAICRAEAOw==)