行政院國家科學委員會專題研究計畫 成果報告
員工權益性獎酬費用化之政策效果
研究成果報告(精簡版)
計 畫 類 別 : 個別型 計 畫 編 號 : NSC 97-2410-H-151-005- 執 行 期 間 : 97 年 08 月 01 日至 98 年 07 月 31 日 執 行 單 位 : 國立高雄應用科技大學商務經營研究所 計 畫 主 持 人 : 李文智 共 同 主 持 人 : 華琪筠 計畫參與人員: 博士班研究生-兼任助理人員:林靖傑 博士班研究生-兼任助理人員:許玲瑛 博士班研究生-兼任助理人員:吳政仲 報 告 附 件 : 出席國際會議研究心得報告及發表論文 處 理 方 式 : 本計畫可公開查詢中 華 民 國 98 年 10 月 24 日
1
行政院國家科學委員會專題研究計畫成果報告
員工權益性獎酬費用化之政策效果
計畫編號:NSC 97-2410-H-151-005
執行期限:97 年 8 月 1 日至 98 年 7 月 31 日
主持人:李文智 國立高雄應用科技大學商務經營研究所
E-mail:[email protected]
一、中文摘要 在我國,員工分紅的會計處理,一 直是學術界與實務界爭論的焦點。反對員 工分紅費用化的人認為,員工分紅配股制 度是台灣高科技產業為吸引菁英、留住人 才之特有獎勵制度,也由於此項制度使得 我國高科技公司於國際上保持相當良好的 競爭力。主張員工分紅費用化的人認為, 員工股票分紅係將股東的請求權移轉至員 工,而員工又是為公司服務,因此該請求 權的移轉自是產生盈餘的成本,所以應視 為費用。而且,外資批評台灣員工分紅不 必列為費用使得財務報表的資訊透明度與 品質備受質疑。有鑑於此,金管會決議自 2008 年起,員工分紅會計處理由現行之附 註揭露修正成於損益表認列費用。本文之 主要目的乃在探討員工分紅於損益表認列 費用之政策效果,研究目的有二,一為員 工權益性獎酬費用化實施後是否使財報資 訊具有增額資訊內涵,二為員工權益性獎 酬費用化實施後是否使獎酬契約變得更透 明,讓高階主管的獎酬與績效間更具關聯 性。 研究結果顯示,2008 年後以損益認 列的分紅與權益獎酬費用化政策,並無新 的政策效果產生。且實證檢視員工權益性 質獎酬費用化實施在2008 年前後兩個不同 會計制度下,均無法比較出費用化前之每 股盈餘及費用化後之每股盈餘何者具有較 高之資訊內涵。 此外,獎酬績效敏感性測試結果發 現,總獎酬和權益獎酬與每股盈餘績效指 標關連性在分紅費用化後增強,與資產利 用效率 ROA 之指標之關連性減弱,與市 場績效指標大致無關連性存在。顯示新制 並無法達到警惕董監及高階經理人降低本 身自肥行為之政策效果。 關鍵詞:員工權益性獎酬、強制性揭露、 39 號公報 AbstractThe purpose of this study is to examine the policy consequences of employee stock compensation. The accounting treatment for employee stock-based compensation is a controversial financial issue among academic, regulators, managers, auditors, and investors. Opponents to recognition of compensation as expense argue that employee stock-based compensation could retain talent employees and keep the competitive advantage by closely aligning the interests of employee with those of shareholders. Supporters argue that stock compensation plans will dilute existing shareholders’ interests by transferring claims on equity from existing shareholders to employees. Because employees provide services to the firm, the dilution effect represents a cost of generating earnings. In addition, foreign investors argue that employee stock compensation has an adverse effect on the transparency and quality of financial statements. Therefore, Financial Supervisory Commission(FSC) require companies to expense employee stock compensation in the income statement substituting for footnote disclosure from year 2008. In order to achieve the objective, the study (1) investigates the incremental information content of the new financial
2
standard and (2) explores whether the relationship between compensation and firm performance become more transparency than before. Results show that there are no policy consequences and incremental information content of employee stock compensation after 2008.
In addition, the relationship between compensation and firm performance (EPS) is stronger after 2008. However, the relationship between compensation and ROA is weaker after 2008. It indicates that expensing employee stock-based
compensation may not reach its policy target.
Keywords: stock-based compensation, mandated disclosures, SFAS No.39 二、緣由與目的 一直以來,「員工分紅配股」制度, 被視為台灣締造科技產業的活泉,是台灣 高科技產業為吸引菁英、留住人才之特有 獎勵制度。當公司賺錢時,從盈餘中提撥 一定比率以股票配發給員工,由於員工是 無償取得,在科技產業快速發展之年代, 是高科技員工累積財富之管道。然而近年 來,國內電子產業員工股票分紅,占稅後 盈餘比重高達三到四成,如此慷慨的分紅 制度,創造了數以萬計的科技新貴,但長 期實施的結果,卻衍生「員工吃肉,股東 喝湯」的怪現象,投資人期盼分紅費用化 後,希望減少員工分紅比例並期望員工與 董監獎酬與未來績效能做更緊密之連結。 此外,由於開放外資引入台灣,外資批評 台灣員工分紅不必列為費用造成財務報告 盈餘虛胖情形,使得相關議題屢成為輿情 關注焦點。因此為提升我國於資本市場之 資訊透明度,有助提升外資對我國證券市 場之評比,促進證券市場蓬勃發展,因此 金管會宣布員工分紅費用化新制於2008 年 開始施行。 在 美 國 , Financial Accounting Standards Board(FASB)於 1996 發布 SFAS No.123 , Accounting for stock-Based Compensation,允許公司可自由選擇將權 益性獎酬費用以附註揭露方式或於損益表
認列,2004 年 12 月,FASB 修改 SFAS No.123 , 發 布 SFAS No.123R , Shared Based Payment,取代原有準則且強制公司 將權益性獎酬費用於損益表認列。過去以 美國為樣本的研究,多探討權益性獎酬費 用化的股價反應以及股價與權益性獎酬的 關聯性如何,有認為股價與權益性獎酬成 正向關係(Rees and Stott 1998;Bell et al. 2002),但亦有認為呈負向關係者(Aboody et al.2004;Espahbodi et al. 2002),其研究 結果並不一致。 在台灣,施行費用化之前證期會在 2003 年 1 月 30 日,即要求公開發行公司須 揭露員工分紅相關事項與「考慮配發員工 分紅及董監事酬勞後之設算每股盈餘」訊 息。換言之,2008 年前證期會認為以「揭 露」取代正式「認列」為費用的會計處理 方式可提供給投資者認知到員工紅利的費 用本質。但2008 年證期會確定以「認列」 正式取代「揭露」為費用的會計處理方式, 投資者是否在2008 年規範改變前已有效調 整員工分紅的影響,為一個值得研究的議 題。若是,則金管會新政策僅是多此一 舉,但如果規範改變前後員工分紅與股票 報酬率間的關係改變,則本研究可合理推 論投資者使用員工分紅資訊之行為受金管 會的規範改變所影響,表示強制施行員工 分紅費用化具有資訊內涵,希望增加財務 資訊透明度政策目的達成。此即為本研究 第一個所要探討的政策效果。 會計上,以附註揭露或損益認列之 會計處理本為根本的問題(Bernard and
Schipper 1994;Barth et al. 2003),研究多 顯示財報使用者認為認列的項目,其攸關 性比附註揭露來得高(Cotter and Zimmer 2003)。整理過去的文獻指出財報使用者 以不同方式看待附註揭露或認列的會計處
理,其主要理由有三,首先,依 FASB 的
觀念性架構(Conceptual Framework),揭 露 或 認 列 提 供 該 項 目 的 可 靠 性 訊 息 (signal)(Bernard and Schipper 1994), 其次,財報使用者無法或不知如何處理附 註 揭 露 的 項 目 (Bernard and Schipper 1994; Hodge et al. 2004),最後,許多契
3 約之訂立多以認列之項目為準,因此認列 的 會 計 處 理 會 影 響 公 司 的 契 約 成 本 (Espahbodi et al.2002)。 由上述討論可知,權益性獎酬之費 用化將使獎酬契約訂立更具效率性,也就 是說,獎酬的給予不會浮濫,獎酬與績效 的連結將更加緊密。在我國,並未有附註 揭露或損益認列的價值攸關性之文獻探 討,本研究利用此次員工分紅費用化之絕 佳機會,透過規範改變前與改變後的相互 比較,檢視在揭露vs 認列之會計處理下, 分紅與權益性獎酬費用化新制是否使財報 資訊具有增額資訊內涵,以及增強獎酬與 績效之正向關聯性。因此,本研究第二個 目的將審視證期會在2008 年後確定將權益 性獎酬之費用化是否達到增進獎酬與績效 正向關聯性之政策效果,而此研究主要貢 獻在於比較我國的研究結果與國外所發現 者是否相同,冀望有助於主管機關在評估 及檢討會計處理準則之效果。 三、研究結果與討論 本 研 究 為 了 比 較 台 財 證 六 字 第 0920000457 號令及(96)基祕字第 052 號函 與39 號公報新制的政策效果,研究期間訂 為 2005 年到 2008 年的年報資料。資料來 源包括台灣經濟新報社的資料庫及台灣證 券交易所的公開資訊觀測站。 針對第一個研究目的:員工權益性獎 酬費用化實施將使財報資訊具有增額資訊 內涵,本研究將採下列兩種方法測試:1. 會 計 盈 餘 評 價 模 式 之 配 適 度 分 析 及 2.JA-test 在會計盈餘評價模式之配適度分析方 面,本文建立下列模型: Ri = α + βEPSi +εi 其中 Ri為公司 i 在財報公布日調整市 場影響後之當日每股超常報酬,而 EPSi 是第 i 家公司調整權益獎酬影響後之財報 盈餘以每股價格平減之。使用會計財報公 布當日股價報酬調整市場報酬後之超常報 酬作為應變數,用以降低在會計盈餘資訊 流入與其他同時存在的混淆事件所造成的 雜訊影響。2008 年前後,不論調整或未調 整員工分紅及董監酬勞之每股盈餘與股價 之模型 F 檢定均成顯著關聯,顯見的是此 迴歸模型是相當適切的。且迴歸結果財報 盈餘係數皆呈現顯著正相關,換言之,所 發佈的每股盈餘不論是否考慮分紅與權益 獎酬費用,盈餘越高營運成果越佳,市場 股價反應越好,超常報酬越高,與一般預 期及過去研究結果相符。而進一步觀測財 報盈餘係數的變化,R2 在台財證六字第 0920000457 號令施行階段中,未調整分紅 費用之財報盈餘解釋 0.4%的股價報酬變 異,而在調整分紅費用後之設算每股盈餘 解釋了0.5%的股價變異,Vuong 檢定值為 -8.06(P<0.001),顯示設算董監員工分紅費 用化後之每股盈餘模型較好,財報盈餘與 報酬的關聯性顯著增加,由前述可知根據 台財證六字第0920000457 號令所公布的揭 露資訊是具有顯著增額解釋力的。而R2在 依(96)基祕字第 052 號函與 39 號公報施行 後,未調整分紅費用之財報盈餘解釋5.2% 的股價報酬變異,而在分紅費用後之每股 盈餘解釋了6.7%的股價變異,Vuong 檢定 值為-4.37(P<0.001),顯示依目前新政策要 求將董監員工分紅費用化後之盈餘評價模 型 較 好 , 可 知 根 據 台 財 證 六 字 第 0920000457 號令所公布的揭露資訊是具有 顯著增額解釋力的。前述結果顯示,整體 而言,會計資訊解釋力在2008 年後較強, 會計資訊品質較好,而不論在那個階段, 董監員工分紅費用化後之盈餘資訊與公布 當日股價超常報酬攸關性高於未含分紅費 用化之每股盈餘資訊。然而比較解釋力之 改善程度,前期Vuong 檢定值約為後期的 3.5 倍 , 推 估 根 據 台 財 證 六 字 第 0920000457 號令所公布的揭露資訊之增額 解釋力,高於依(96)基祕字第 052 號函與 39 號公報所公佈之會計資訊。換言之,早 在新政策施行前投資人已關注到設算分紅 費用化之盈餘附註揭露資訊,而將其反映 在股價上,新制的分紅與權益獎酬費用化 政策,並無新的政策效果產生。在2008 年 的全球性金融風暴下,使得投資人必然會 對於國內所編製報表資訊信賴度做修正, 然而2008 年各模型之解釋力(R2)仍高於 2008 年前之迴歸結果,顯示會計資訊品質
4 整體而言依舊是提升的。 本研究進一步拆解迴歸式中自變數, 檢測股票報酬率對現金紅利與股票紅利個 別資訊反應,建立下列模型: Ri = α + β1OIi +β2Cashi+β3Stocki+ εi 在(96)基祕字第 052 號函與 39 號實施 前施行前後有無差異,以迴歸係數結果看 來市場在報表公佈日對於董監獎酬與現金 分紅資訊雖然係數方向相反但統計上並無 顯著反應。而(96)基祕字第 052 號函與 39 號實施前,權益獎酬與報酬間呈現顯著正 相關(係數86.304 , T 值 2.089),而(96) 基祕字第052 號函與 39 號實施後權益獎酬 與報酬間成顯著負相關(係數-44.949 , T 值 1.621),係數差異檢定 F 值顯著。這顯示 在台財證六字第 0920000457 號令實施階 段,投資人可能在忽略分紅與權益獎酬費 用化影響數之揭露資訊,而對於權益獎酬 認為是對員工有正向激勵因素存在,因此 權益獎酬越高給予越正向的評價。在(96) 基祕字第052 號函與 39 號公報實施階段, 董監員工權益獎酬直接在損益表內以費用 方式呈現,普遍投資人才警覺到權益獎酬 對其自身財富之影響,因而使得當權益獎 酬越高,給予越負向之評價。綜上所述, 2008 年後新會計制度之施行,加上全球性 金融風暴引發討伐企業肥貓效應,使得普 遍投資人正視權益獎酬發放是否適當性的 問題,因此依新會計制度編製之的財報內 容是具有資訊內涵的。 在JA 檢定方面,建立下列模型: Ri=a + bEPSoldi + cZRnewi Ri=d + eEPSnewi + rZRoldi 2008 年後(96)基祕字第 052 號函與 39 號 實 施 後 JA 檢 定 實 證 結 果 顯 示 , 其 ZRnew 係數與 ZRold 係數均未達顯著水 準。就 2008 年前後兩個階段而言,JA 檢 定方法並無法比較出依董監員工分紅與權 益獎酬費用化與否之盈餘資訊,何者具有 較高之攸關性。因此也無法比較投資人對 於依台財證六字第0920000457 號令揭露之 財務資訊與依(96)基祕字第 052 號函與 39 號納入財務報表內之資訊,反應是否有所 差異。JA 檢定證實未計入分紅與權益獎 酬的盈餘資訊與計入分紅與權益獎酬的盈 餘資訊均對於投資決策無顯著影響力。此 研究結果隱涵市場之投資大眾不論在新舊 會計制度下,不參酌任何會計準則所揭露 或報導的財務資訊作投資決策。顯然依董 監員工分紅與權益獎酬費用化與否之盈餘 資訊對於投資大眾之影響力不大,亦即欠 缺資訊攸關性。其原因或許是會計準則所 編製的財務報表未能表達公司的經營與財 務狀況,但亦可能是市場之投資大眾本身 之決策模式(例如不看報表而迷信明牌或 傳 言 等) 。 另 一 方 面 , 可 能 對 於 股 東 而 言,不論如何計算出每股盈餘,他們只注 意每股盈餘是否為正,與去年同期比是否 有成長性,因而樣本公司依據分紅與權益 獎酬費用化的盈餘資訊在同公司本身相同 基礎前後期比較下,對於投資大眾而言並 無太多資訊意義。因此新制是否達到增加 資訊解釋力之政策效果,在 JA 檢定中並 無法釐清。 針對第二個研究目的:利用盈餘績效 敏感性衡量指標,比較(96)基祕字第 052 號函與39 號公報施行前後之盈餘與績效變 動相對關聯性程度是否有差異存在。 本研究選定的敏感性指標包含下面兩 項: 指標 1:參考 Holmstrom (1992)的作 法將績效變動數與員工董監獎酬變動數作 迴歸估計, △(WAGE) it = W0 + W1△P it +u it 指標2:參考 Murphy(1993)及 Lipper and Poter(1997)的作法,以當期員工與 董監薪酬變動數(△WAGE)除以當期績效 變動數-總市值變動數(△P)計算出薪酬- 盈餘敏感性(Index)。 Index = △WAGE/△P 董監獎酬與員工分紅總額變動數與績 效變動之敏感性分析結果,以每股盈餘計 算績效變動數代入迴歸式,不論在(96)基 祕字第052 號函與 39 號實施前後,迴歸係 數均顯著為正,顯示當績效提升時董監員 工獎酬總額也領的越多。比較係數之變化 情形,迴歸係數之 F 檢定顯著。進一步分 析薪酬結構發現,董監員工現金獎酬及權
5 益性獎酬與每股盈餘變動之關連性均顯著 為正,兩階段之差異性檢定則只有在權益 性獎酬發放中有著顯著差別性存在。這結 果顯示2008 年後獎酬總數與績效敏感性指 標和權益獎酬與績效敏感性指標均顯著大 於2008 年前之值,獎酬與績效間之關聯性 似乎因董監獎酬與員工分紅費用化法令規 定而強化,員工及高階經理人及董監之薪 酬不再浮濫發放而損及其他股東之權益, 股東似乎也不用再擔心,權益性獎酬隨意 發放而稀釋掉自身之財富。 而 以 ROA 為績效衡量之代理變數 時,獎酬與績效之敏感性係數在台財證六 字第0920000457 號令實施階段顯著為正, 而在2008 年後獎酬與績效之間似乎已無關 連性存在。薪酬結構分析結果顯示,現金 獎酬與 ROA 績效敏感性在前後兩個法規 施行階段皆呈現顯著正相關,但在2008 年 後敏感性指標係數有些微下降,統計差異 檢定顯示前後期差異不大。而權益性獎酬 與 ROA 績效之敏感性測試只在台財證六 字第0920000457 號令實施時,為顯著正相 關,2008 年後 ROA 之績效好壞則與權益 性獎酬無統計性關聯。由上述結果推測, 基本上資產利用效率越好,現金獎酬與權 益性獎酬的發放也越多,但評估(96)基祕 字第052 號函與 39 號實施後是否約束了股 東代理人(經理董監及員工)的自肥行為, 似乎在全球經濟環境窘困的情況下,並未 因獎酬資訊報導更加透明而有所改善。以 代理理論與契約理論來看獎酬之目的,是 為了增加對代理人之激勵效果使其為股東 賺取最大之財富,以此來看董監員工獎酬 總數支領之多寡與績效好壞無關,此時股 東之權益將受到損害。實證結果指出新政 策無法達成監督效果, 2008 年後反而自 利行為相形嚴重。資產利用效率與獎酬之 研究結果與每股盈餘的分析結果恰好相 反。 在Tobins' Q 的市場績效的檢驗過程則 發現,只有權益獎酬與市場績效在台財證 六字第0920000457 號令實施階段,才有顯 著負向關係存在,董監員工現金獎酬與總 獎酬數與市場績效在任何階段並未有關連 性。此結果顯示董監獎酬與員工分紅發放 並不參考市場績效結果,原因一方面可能 來自市場績效表現好壞與企業之經營結果 並非有絕對之關連,市場績效變好有可能 是因為投機資金的炒股操作造成,市場績 效驟降也可能只是一個試射飛彈的政治因 素影響。另一方面,以市場績效做為獎酬 標準,經理人員也容易透過庫藏股買賣, 拋出類似併購談判等利多私有訊息至市場 干預股價變化,藉以提高市場績效。以此 論述可知市場績效的不可控因素太多,因 此大多樣本企業並未採用市場績效指標作 為獎酬契約之約定標的是可以理解的。 獎酬與績效敏感性是否存在董監經理 人與員工之階層性差異性分析顯示,董監 獎酬總額與每股盈餘及 ROA 績效之關連 性,不論在財證六字第0920000457 號令實 施階段或(96)基祕字第 052 號函與 39 號實 施時期均成顯著正相關,係數統計檢定並 未有顯著差異存在。而董監獎酬總額與市 場績效Tobins' Q 在 2008 年前成顯著負向 關係,換言之市場績效越差董監領的獎酬 越多,實務上董監經理人本身可能利用在 績效不彰股價低迷的情況下,浮濫發放低 執行價格之認股權證,已期待未來股價攀 升時獲取暴利之行為似乎可以藉此得到些 許之證據。統計上檢定不同會計法規階段 所有獎酬與績效敏感性,並未有明顯差異 存在,因此新法令想要達到強化監督董監 經理人這些肥貓之效果,也並未達成。除 了在 2008 年後員工獎酬與 ROA 成不顯著 負相關外,員工獎酬總額與財務績效與市 場績效之關連性多成顯著正相關,且所有 績效指標與員工獎酬之各敏感性測試,在 兩個法令施行階段皆呈統計顯著差異存 在。(96)基祕字第 052 號函與 39 號實施時 期之關連性係數均顯著大於財證六字第 0920000457 號令實施階段之關連性係數, 顯示新法規之執行加強員工獎酬發放之合 理性。然而為何會造成這種階層性衝突式 差異,推估董監獎酬金額領的金額再高, 但與全體其他員工總獎酬金額相比則相對 比例很小,因此容易利用這種比例上差異 設計出全體總獎酬與績效有強列關連,而
6 卻可圖利小群體的獎酬方式。 四、計畫成果 會計盈餘評價模式之 Vuong 檢定發 現,不論是2008 年前以附註揭露員工分紅 金額,或者至2008 年後之損益認列,此部 分之資訊在該時期均具有增額資訊內涵效 果 , 而 在 2008 年 前 台 財 證 六 字 第 0920000457 號令實施階段,增額資訊內涵 高於2008 年後分紅費用化認列損益入帳新 制之施行。可能隱含的原因在新政策施行 前投資人已關注到設算分紅費用化之盈餘 附註揭露資訊,而將其反映在股價上,新 制的分紅與權益獎酬費用化政策,並無新 的政策效果產生。檢測股票報酬率對現金 紅利與股票紅利個別資訊反應,股票紅利 係數呈現顯著變化,從2008 年前正相關轉 變為負相關,投資人似乎較以往有高警覺 到權益獎酬發放對其自身利益之危害。然 而 JA test,實證檢視員工權益性質獎酬費 用化實施在兩個不同會計制度下,均無法 比較出費用化前之每股盈餘及費用化後之 每股盈餘何者具有較高之資訊內涵,甚至 盈餘資訊與股價報酬無關連性存在。研究 結果隱含投資人並未以財務報表資訊作為 投資的基礎,究其原因可能在於近年來的 大型弊案頻傳,加上2008 年後是全球性金 融風暴使得投資人對於財報之信心驟減。 因此會計資訊內涵的檢定結果顯示,新政 策的增額資訊效果是不存在。 獎酬績效敏感性迴歸測試結果發現, 總獎酬和權益獎酬與每股盈餘績效指標關 連性在分紅費用化後是增強的,與資產利 用效率 ROA 之指標之關連性是減弱的, 與市場績效指標大致無關連性存在。董監 獎酬總額在前後兩個制度下,並無統計上 顯著差異存在,員工的總獎酬在費用化入 帳制度下與績效之關連性是提升的。實證 顯示新制並無法達到警惕董監及高階經理 人降低本身自肥行為之政策效果。獎酬與 市價績效指標之分析結果表示,董監酬勞 及員工分紅金額在(96)基祕字第 052 號函 與39 號實施時期獎酬與績效之正向關聯性 增強,但與總獎酬與市價績效之關連性明 顯下降,隱含企業獎酬發放合理性之改善 只在新政策強調入帳之部分,而代理人可 能透過其他方式挪用資源另謀自身利益。 經上述實證研究,投資人對資訊之敏 感性是有些許提升,但對於財報信心顯有 不足,新制度也未完全改善董監自利行為 現象,檢視我國員工分紅之會計準則制定 方針並未完全達成既定目標。另外實證甚 至於在分紅以附註揭露表達時期,資訊內 涵及獎酬發放合理性高於費用化入帳階 段,此結果也提供主管機關未來推行新會 計準則時,值得深思的一個課題:是否一 定要以入帳方式代替附註揭露方式才能增 加財報透明度與資訊內涵? 五、參考文獻
Aboody, D., M. E. Barth, and R. Kasznik. 2004. SFAS No.123 stock-based compensation expense and equity market value. The Accounting Review 79: 251-275.
Barth, M., G. Clinch, and T. Shibano. 2003. Market effects of recognition and disclosure. Journal of Accounting
Research (September): 581–609.
Bernard, V., and K. Schipper. 1994. Recognition and disclosure in financial reporting. Working paper, University of Michigan.
Bell, T., W. Landsman, B. Miller, and S. Yeh, 2002. The valuation implications of employee stock option accounting for profitable computer software firms.
The Accounting Review 77 (4):
971-996.
Cotter, J., and I. Zimmer. 2003. Disclosure versus recognition: The case of asset revaluations. Asia-Pacific Journal of
Accounting and Economics 10:
81–99.
Espahbodia,H., P. Espahbodia, Z. Rezaeeb, and H. Tehranianc. 2002. Stock price reaction and value relevance of recognition versus disclosure: the case of stock-based compensation.
7
343-373.
Hodge, F, S. Kennedy, and L. Maines. 2004. Does search-facilitating technology improve the transparency of financial reporting? The Accounting Review 79: 687–703.
Lipper, L. and G. Porter, 1997,
Understanding CEO Pay: A Test of Two Pat-to-Performance Sensitivity Measures with Alternative Measures of Alignment and Influence, Journal
of Business Research 40: 127-138.
Murphy, K. 1993. Executive Compensation 1000. United Shareholder
Association.
Rees, L., and D. Stott. 1998. The value-relevance of stock-based employee compensation disclosures. Working Paper, Texas A&M
University.
Vuong, Q.1989.Likelihood ratio tests for model selection and non-nested hypothesis. Econometrica 57:307-333.
行政院國家科學委員會補助團隊參與國際學術組織會議報告
年 月 日
報告人姓名
林靖傑
服務機構
台灣大學會計學研究所
職稱
博士班研究生
中文:2008 美國會計學會年會
會議正式名稱
英文:American Accounting Association 2008 Annual Meeting
會 議 時 間
自97 年 8 月 4 日至 97 年 8 月 7 日
地點(國、州、城市)
ANAHEIM, CA
報告內容應包括下列各項:
一、
參加會議經過
本次參加之論文為依 95 年度之國科會計畫改寫而成,題目 Reversing an Impairment Loss and Earnings Management: The Role of Corporate Governance(資產減損迴轉與盈餘管 理:公司治理之角色)。
American Accounting Association(美國會計學會,AAA)為全球組織最大,亦為最重要的
會計學術機構,其每年所舉辦的年會為年度會計盛事,全球知名會計學者多會與會。2008 年
年會於Anaheim 舉行,本年主題為 Building our accounting community,會議時間為 8/3
至8/6。
AAA 年會的內容頗為多元,每日皆有一場 Plenary Session,由國際知名學者針對某一議
題發表演說,而中午Luncheon 則是對於審計、管會、稅務等議題,邀請學者演講。至於其
餘時間,則是年會的重頭戲,大約可分成Concurrent Session、Research Interaction Session
以及New Scholars Concurrent Session 等,由各國與會的學者發表其研究結果,參與的學者
提出意見,收互相交流之效。
學生所參與為等級最高的 Concurrent Session,該 Session 形式為發表人發表 20 分鐘、評
論人五分鐘,之後再由與會人員發問。每場Concurrent Session 多有 3 篇文章,學生安排在 第二篇,此為學生第一次以英文簡報,而且是在此重要之國際會議場合,心中之緊張不言可 喻。雖然連續好幾天難以好眠,但輪我報告時,終究還是順利完成,而評論人的意見也還算 在意料之中,沒有特別的意見。
二、
與會心得
美國會計學會年會為會計界規模最大的研討會,成員來自世界各地的會計先進,參與此類的 研討會,除了可了解現今會計研究趨勢與潮流外,聽取知名學者的評論意見亦是一大收穫, 他們於評論時不但匯總該研究議題的來龍去脈,而且其評論意見不多但往往一針見血,非常 值得研究後輩學習。當然,參加學術會議的過程中,認識一些國際學者對於自己往後研究之 路也是一大助益。三、
考察參觀活動(無是項活動者省略)
無
四、
建議事項
參與如此的國際研討會,除了獲悉研究發展趨勢外,另可增進自己的國際觀,有助於激勵自 己於日後應精益求精,提昇學術研究能力。而國科會支持參與重要國際會議並與國際學術接 軌的政策,值得肯定,希望國科會本著支持與鼓勵學術發展,能夠持續補助出國參加研討會。五、
其他
行政院國家科學委員會補助團隊參與國際學術組織會議報告
98 年 月 日
報告人姓名
吳政仲
服務機構 高雄第一科技大
學管理研究所
職稱 博士班研究生
會議正式名稱
英 文 :
The 3rd International Conference of Market Development and
Investment Strategies
會 議 時 間
自
98 年 1 月 9 日至 98 年 1
月
10 日
地點(國、州、城市) Singapore
報告內容應包括下列各項:
一、參加會議經過
1、此次在補助下,學生得以參加The 3rd International Conference of Market Development
and Investment Strategies 的國際研討會,首先對此學生表達感謝之意。
2、學生前往新加坡參與這個國際研討會,在整個會議過程也受到教授的諸多指導,實是
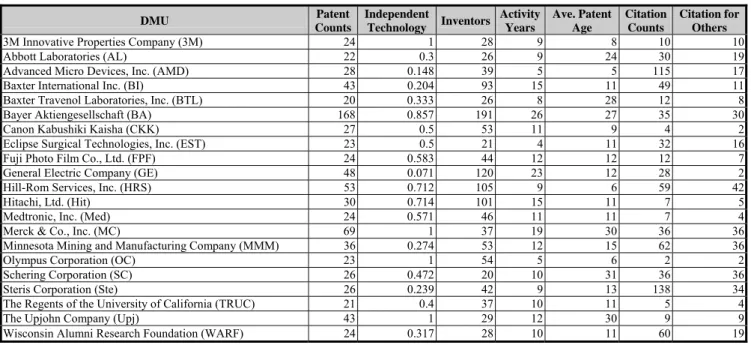
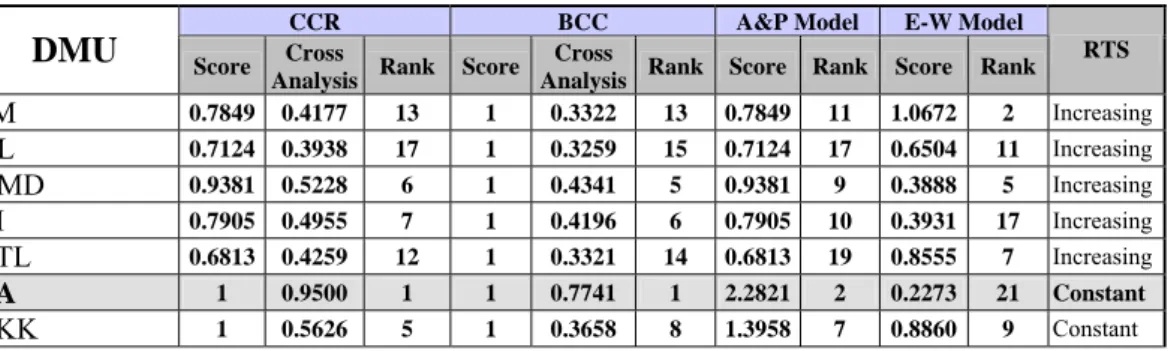
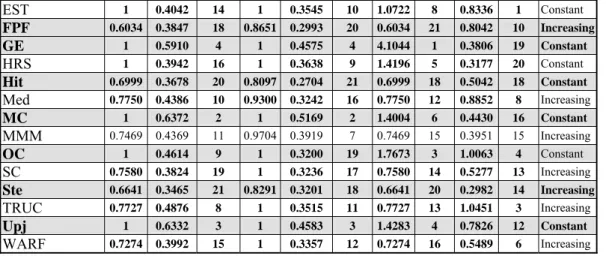
獲益良多。學生所發表的論文為 A Correlative Exploration of Patent Performance
Assessment: Medical Instruments Industry。事實上,參與此次國際研討會,讓學生收
獲良多,也再次感謝學校提供輔助,讓學生得以成行。同時感謝來自National Institute
of Industrial Engineering 的 Prof. Sanjeev Verma 的諸多寶貴的意見。還有讓學生印象 最深刻的便是認識 University of Teknologi MARA Malaysia 的 Mah Boon Yih 他在相 關領域課題的研究上,啟發了學生往後在這領域上能夠進行研究的議題。並且在論 文發表上分享論文在期刊投稿上修改的寶貴意見,讓學生在個人論文寫作上有了更 好的突破。 3、學生所參與該Session 形式為發表人發表 20 分鐘、評論人五分鐘,之後再由與會人員 發問。每場Concurrent Session 多有 6 篇文章,學生安排在最後一篇,此為學生第 一次以英文簡報,而且是在此國際會議場合,心中之緊張不言可喻。雖然連續好幾 天難以好眠,但輪我報告時,終究還是順利完成,而評論人的意見也還算在意料之 中,沒有特別的意見。
二、與會心得
此次的研討會,成員來自世界各地的先進,除了可了解現今財務研究趨勢與潮流外,聽取 知名學者的評論意見亦是一大收穫,他們於評論時不但匯總該研究議題的來龍去脈,而且 其評論意見不多但往往一針見血,非常值得研究後輩學習。當然,參加學術會議的過程中, 認識一些國際學者對於自己往後研究之路也是一大助益。三、考察參觀活動(無是項活動者省略)
無
四、建議事項
1、參與如此的國際研討會,除了獲悉研究發展趨勢外,另可增進自己的國際觀,有助於 激勵自己於日後應精益求精,提昇學術研究能力。而國科會支持參與重要國際會議 並與國際學術接軌的政策,值得肯定,希望國科會本著支持與鼓勵學術發展,能夠 持續補助出國參加研討會,增加學生國際學術交流機會也提升國際觀。五、其他
行政院國家科學委員會補助團隊參與國際學術組織會議報告
年 月 日
報告人姓名 許玲瑛
服務機構 高雄應用科技大學
職稱 助教
中文:國際管理研討會
會議正式名稱
英文:Management International Conference
會 議 時 間
自97 年 11 月 26 日 至97 年 11 月 29 日
地點(國、州、城市) Barcelona, Spain
一、 參加會議經過
2008 年 11 月 25 日啟程由桃園國際機場至荷蘭阿姆斯特丹史基浦機場轉機至西班牙巴塞隆 納,中途於泰國曼谷機場暫停;抵達巴塞隆納為早上9 點,天氣很冷,大陸型氣候與台灣之海島型氣候有明顯不同。因飯店與研討會會場下午才可check in,所以先進行一個上午之 City tour,
瞭解這個曾辦理1992 奧運會之城市面貌;安東尼.高第(Antoni Gaudí i Cornet,1852-1926)是西
班牙最為人所熟知的建築師之一,參觀聖家堂、米拉之家等世界遺產,對這具高度藝術之城市 有初步觀感。
下午至飯店check in,並下午 7:30 至會場辦理報到領取相關議程。
11/26 研討會辦理報到後,11/27 上午舉行開幕式並邀請 Palestine 之 Dr. Rami Hamdallah 及 Slovenia
之Dr. Jesph Mifsud 兩位教授擔任 Keynote Speaker,下午分成四個場地舉行三場論文發表;
11/28 上午邀請 USA 之 Dr. Binshan Lin 及 Spain 之 H.E.Juan Prat Y Coll、Finland 之 Dr. Pekka Kess
擔任Keynote speaker,下午分成四個場地舉行四場論文發表。 11/29 上午下午分成四個場地舉行三場論文發表。
二、 與會心得
本次研討會計有40 個小發表場所,每場約 4-5 發表論文,合計超過 160 篇論文於本研討會 上發表,參與國家有Slovenia、Palestine、USA、Spain、Malaysia、Croatia、Bulgaria、Poland、 Lithuania、India、Turkey、Germany、Greece、Thailand、Hungary、Norway、Romania、Serbia、 United Kingdom 等國家參與。發表之論文方向有 E-Business、Customers、Innovation andTechnology、Social Issues、Knowledge Management、Intercultural Dialogue、Finance、Research Methods、Business Administration、IT for Business、Primary and Secondary Education、Finance and Taxes、Intercultural Communication、Entrepreneurship and the social Context、Costumers、 Macroeconomics、High Education 等議題。 參加此國際學術研討會,讓我認識各國學者及學生,並自其中找尋自已有興趣Section 參 加,訓練聽力及以英文發表論文之能力,瞭解現今各領域之最新發展及可討論研究之議題,自 其中可獲取未來可進一步思考之研究方向,並瞭解世界各國在研究什麼。
三、 考察參觀活動(無是項活動者省略)
四、 建議事項
在國際研討會以英文發表論文是台灣學生的缺點,國科會應多補助學生參與國際學術研討會之 經費,讓學生在經費充裕下可出席國際會議,擴展其國際觀。其他
Reversing an Impairment Loss and Earnings Management: The Role of Corporate
Governance
ABSTRACT: This paper examines whether the reversal of a previously recognized impairment loss as stipulated in IAS No. 36 provides an opportunity for earnings management, and whether a corporate governance mechanism can mitigate this behavior. Effective in 2005, listed companies in Taiwan were required to comply with Taiwan’s SFAS No. 35, which is equivalent to IAS No. 36. Data on a sample of 55 firms making reversal of an impairment loss between 2005 and the first quarter of 2007 were matched by industry and size with 55 control (non-reversal) firms. Empirical results show that the magnitude of the reversal is positively related to the magnitude of an impairment loss recognized previously. We also find that there is an interactive effect between an impairment loss previously recognized and pre-reversal earnings change, which is consistent with the “cookie jar” reserve hypothesis. However, an effective corporate governance mechanism can mitigate such behavior. Our study may contribute to the global convergence with IFRS and especially the current convergence between IASB and FASB with respect to the “Impairment of Assets” standard by providing a rationale for the FASB’s prohibition of reversal. It may also contribute to the corporate governance literature by showing the effect of governance mechanisms on deterring earnings management.
I. INTRODUCTION
This paper examines whether the reversal of a previously recognized impairment loss as stipulated in International Accounting Standards (IAS) No. 36 provides an opportunity for earnings management, and whether corporate governance mechanism can mitigate this behavior. IAS No. 36 provides that if there is any indication that an impairment loss recognized in prior periods for an asset other than goodwill may no longer exist or may have decreased, an enterprise shall estimate the recoverable amount of that asset and recognize the reversal of an impairment loss on the balance sheet date. However, Statement of Financial Accounting Standards (SFAS) No. 144 (and formerly SFAS No.121) does not allow for such reversal. The reason for Financial Accounting Standards Board’s (FASB) prohibition of reversal is that an impairment loss should result in a new cost basis for the impaired asset. That new cost basis puts the asset on an equal basis with other assets that are not impaired. In the FASB’s view, the new cost basis should not be adjusted subsequently other than as provided under the current accounting model for prospective changes in the depreciation estimates and method and for further impairment losses (SFAS No.121 Basis for Conclusion). While the basis for conclusion is silent on other reasons, we add one based on our empirical findings--avoid earnings management such as the practice of “cookie jar” reserve (Levitt 1998).1 “Impairment of Asset” is one of the short-term convergence projects between the FASB and the IASB, which is expected to
complete by 2008. Before both Boards reach a resolution a test of market may be necessary. Our study contributes to this convergence effort by providing empirical evidence for the prohibition of reversal.
Since European Union (EU) required that starting in 2005, companies listed in EU prepare financial reports in accordance with International Financial Reporting Standards (IFRS), there were
1 Arthur Levitt (1998) defined “cookie jar” reserves as “overstating sales returns or warranty costs in good times and using those overstatement in bad times to reduce similar charges.”
more and more countries announcing similar requirements. For example, South Korea announced that starting in 2011; all listed companies in South Korea would be required to prepare financial reports in accordance with IFRS.2 Japan and Taiwan had a similar policy.3 While convergence with IFRS is a global trend (Street 2002; Street and Gray 2002), financial reporting quality is yet determined by, among others, management incentives, legal systems and corporate governance (Ball et al. 2003; Leuz 2003; Schipper 2005). Prior research suggests that code law and common law countries differ in their transparency of financial reporting (e.g., Bushman et al. 2004; Leuz 2003), indicating the importance of corporate governance mechanism in mitigating this problem (e.g., Hung 2001; Leuz et al. 2003). South Korea, Japan and Taiwan all adopt code law system, and thus they provide a setting for
examining whether the reversal provides an earning management opportunity and whether an effective corporate governance mechanism can mitigate such behavior. Investigation into the latter issue may contribute to the literature in earnings management and corporate governance. Extant research tends to use aggregate measures such as timeliness, conservatism (Ball et al. 2003), or discretionary accruals (Dechow et al. 1995) for empirical investigation. Our study supplements this line of research by focusing on the implementation of a particular financial reporting standard whereby policy implications with respect to an accounting issue can be more clearly drawn. As to corporate
governance, focusing on a single standard may help members of board of directors or audit committee members identify accounting issues for special scrutiny.
The current study investigates whether listed firms in Taiwan reverse asset impairment loss to
2 See www.iasb.org/News/IASB+welcomes+Korea’s+roadmap+for+adoption+of+IFRSs.htm
3 Japanese accounting standard-setting body (ASBJ) announced to achieve convergence of accounting standards by 2011. See
http://www.iasb.org/News/Press+Releases/The+ASBJ+and+the+IASB+announce+Tokyo+Agreement+on+achieving+conv ergence+of+accounting+standards+by+2.htm. Taiwan’s Accounting Research and Development Foundation also
announced to achieve convergence with IFRS by 2010. See
manage earnings. We chose listed companies in Taiwan for two reasons. First, it adopts a code law system. Second, effective in 2005, listed companies in Taiwan were required to comply with Taiwan’s SFAS No. 35, which is equivalent to IAS No. 36. Data on a sample of 55 firms making reversal of an impairment loss between 2005 and the first quarter of 2007 were matched by industry and size with 55 control (non-reversal) firms. Results show that the magnitude of the reversal is positively related to the magnitude of an impairment loss recognized previously. We also find that there is an interactive effect between asset impairment losses and pre-reversal earnings change, which is consistent with the “cookie jar” reserve hypothesis. In other words, while firms recognizing an impairment loss in a year tend to reverse the impairment loss subsequently, this tendency is more pronounced for firms that avoid earnings decline. We further find that an effective corporate governance mechanism will deter the above earnings management.
The remainder of this paper is organized as follows. The next section reviews prior literature. Section III develops research hypotheses. Section IV describes research design, including sample, variable measurement and empirical models. Section V reports the results. Section VI presents sensitivity analyses. The final section is discussion and conclusion.
II. LITERATURE REVIEW
There are two strands of research related to assets impairment. One examines market reactions of the announcement of impairment losses. Another strand of research investigates the characteristics and motivations of firms recognizing an impairment loss. Empirical findings are mixed regarding the first issue. For example, Elliott and Shaw (1998) analyze the return behavior of firms disclosing such write-offs and find lower security returns relative to their industry in months and years prior to the write-off, indicating that other sources provide timely information on economic issues related to the
write-offs. Daily results during the week of the disclosure are significantly negative, suggesting that the write-offs exceed expectations and the restructurings are inferior to the expected plan. As to earnings performance, firms with large write-offs substantially under-perform their industries in the years preceding and including the write-off year in terms of return on assets and return on equity. Francis et al. (1996) similarly find that announcement of an impairment loss conveys information about decreases in economic values of assets. However, Strong and Meyer (1987) find negative average cumulative abnormal returns around the impairment announcement date, but the negative returns are reversed in six days after the impairment announcement. Finally, some studies do not find market reactions significantly (Hogan and Jeter 1998; Zucca and Campbell 1992).
Subsequent studies have attempted to improve research design to resolve the inconsistent findings. Bunsis (1997) partitions the write-offs based on how the events underlying the write-off are expected to affect cash flows: decreasing, increasing or no effect on future cash flows. The results show that the market reacts negatively (positively) to events that are expected to decrease (increase) expected future cash flows. Alciatore et al. (2000) examine the case of the fall in oil and gas prices in late 1985 and early 1986. They find no significant correlation between the write-down amounts and contemporaneous returns because write-downs tend to be reported after the associated decline in share prices-- the market already knew at least some of the information implicit in the write-down amounts. Collins and Henning (2004) argue that many studies document associations between poor earnings performance for the firm as a whole and subsequent write-downs of only certain assets of the firm, which is indirect evidence. They examine the context of write-downs accompanying segment
divestitures. Results show that the write-down magnitude is strongly associated with segment earnings declines, with earlier declines in segment earnings more heavily weighted in write-down measurement
than more recent declines.
The second line of research focuses on the characteristics and motivations of firms that recognize an impairment loss. Francis et al. (1996) examine factors driving write-down decisions during 1989-1992 that predate SFAS No.121 and find that the decisions can be accounted for by both impairment and manipulation factors. Loh and Tan (2002) examine firm-specific and macro-economic factors that are likely to influence the asset write-off decision in Singapore. They find that
macroeconomic factors such as unemployment rate, GDP growth rate and occupancy rate of properties, and firm-specific factors including profitability and a change of board chairman are the determinants. Elliott and Shaw (1988), Strong and Meyer (1987), Zucca and Campbell (1992) indicate that write-off decision is associated with manager’s incentives.
Rees et al. (1996) find that abnormal accruals in the year of the asset write-down are significantly negative; however, the abnormal accruals in the write-down year do not reverse in subsequent years, suggesting that the firms have experienced a permanent shift in their accrual
balances in the write-down year. The authors argue that managers provide credible signals to investors regarding future firm performance. Riedl (2004) contrasts the characteristics of write-offs reported prior versus subsequent to the issuance of SFAS No.121. Empirical results reveal that economic
factors have a weaker association with write-offs relative to that between “big bath” reporting behavior and write-offs. In addition, this “big bath” reporting behavior more likely reflects opportunistic
reporting by managers rather than the provision of their private information. Overall, the results suggest that the reporting quality of write-offs under SFAS No.121 has decreased.
Empirical studies related to assets impairment in Taiwan include Hsieh and Wu (2005) and Chao (2006). Hsieh and Wu (2005) investigate determinants of the timing and the amount of assets
impairment decisions of Taiwan’s SFAS No. 35 issued on July 1, 2004. They also examine market reactions to impairment announcement. Empirical results show that determinants for early adopters include taking a “big bath” (the reporting motivation) and factors reflecting the accrual-based and cash flow-based recoverability of long-lived assets (operational motivations). The amount of an impairment loss is associated with only reporting motivations (the taking a “big bath” purpose, the income
smoothing purpose, and the change in top management) for early adopters. For non-early adopters, the amounts of assets impairment are associated with not only the reporting (income smoothing) but also operational motivations. Market reactions to announcements of an impairment loss reveal that the stock market reacts significantly and negatively to the fourth-quarter impairment loss. In addition, the stock market does not react significantly to the first-quarter impairment loss. Chao (2006) performs a similar study and has a similar finding.
In summary, prior research examines market reactions to announcement of an impairment loss, characteristics and motivation of firms recognizing the impairment loss. They do not discuss issues related to the reversal of an impairment loss, which is the major difference between US GAAP (SFAS No. 121 and No.144) and IFRS (IAS No. 36). The current study fills the void in the literature by examining the possibility that permitting reversals may be conductive to earnings management.
To improve the quality of financial reporting, extant research suggests that an effective corporate governance mechanism is helpful. For example, Beasley (1996) finds that outside directors can deter fraudulent financial reporting. Klein (2002) suggests that earnings management tends to decrease with the increase of independent directors. Peasnell et al. (2005) find that the likelihood of managers making income-increasing abnormal accruals to avoid reporting losses and negative earnings changes is negatively associated with the proportion of outside directors. But, they do not
find such an effect of audit committee. Ng and Tan (2003) present experimental findings that precise standards and effective audit committees are potential substitutes/compensating mechanisms for enhancing auditor effectiveness and financial reporting quality. Agrawal and Knoeber (1999) argue for larger size of boards in firms where information is otherwise difficult to obtain. Adams and Mehran (2002) find that banking firms with larger boards perform better.
Divergence between control right and cash flow right may weaken the monitoring function of financial reports and give managers the power to expropriate the minority shareholders (La Porta et al. 1999). In an international context, Ali and Hwang (2000) show that countries with low demand for information from published financial reports tend to employ accounting practices that produce accounting data with low value relevance.
The above findings suggest that corporate governance mechanisms may mitigate the potential consequence of taking advantage of the discretion provided in an accounting standard. We thus examine this conjecture using the reversal of an impairment loss as the research setting.
III. RESEARCH HYPOTHESES
IAS No. 36 and Taiwan’s SFAS No. 35 both require that an enterprise conduct an impairment test for the values of long-lived assets on the balance sheet date. If the carrying amount of a long-lived asset is higher than its recoverable amount, then an impairment loss should be recognized on the income statements instantly. If there is any indication that a previously recognized impairment loss does not exist, the impairment loss shall be reversed. Thus, managers play an important role in judging an impairment loss and reversal of such an impairment loss. Riedl (2004: 824) argues that reporting discretion over write-offs may increase after adoption of SFAS No.121, as the standard’s subjective criteria may enable managers to more easily justify their reporting choices relative to before the
standard. Hsieh and Wu (2005: 81) indicate that firms would early adopt Taiwan’s SFAS No. 35 to recognize large impairment losses in the period of unexpected poor earnings performance to improve future earnings performance or to have the restoration flexibility of impairment losses in the future period. These studies suggest the potential that the provision of reversal may provide an opportunity for earnings management.
In a related study, Henning et al. (2004) suggest that SFAS No. 142 provides managers too much discretion for goodwill write-off. Further, there is evidence that managers are more likely to attempt earnings management, and auditors are less likely to adjust earnings management attempts when accounting standards are imprecise or require judgments (Healy and Wahlen 1999; Nelson et al. 2002; Nelson 2003).4 Other studies also show that auditors are less likely to require adjustments when the involved amounts are subjective (Braun 2001; Nelson et al. 2005). Since IAS No. 36 (and Taiwan’s SFAS No.35) involves managers’ estimation of parameters such as cash flows and discount rate, the component of subjectivity during determining recoverable amount for recognizing an impairment loss and for reversing the impairment loss may give rise to an opportunity for earnings management. Income smoothing has been indicated as an explanation for earnings management (e.g., Zucca and Campbell 1992; Bartov 1993). Levitt (1998), former Chair of the SEC, further points out “cookie jar” reserves as such a technique by “overstating sales returns or warranty costs in good times and using those overstatement in bad times to reduce similar charges.” Extending Levitt’s argument, it appears that given an opportunity, a firm that recognizes a higher amount of impairment loss will subsequently reverse a higher amount of impairment loss. This will be more likely to occur when a firm cannot meet the earnings target or benchmark. Technically speaking, listed companies in Taiwan are required to file
4 When accounting standards are precise, managers tend to structure transactions so that auditors are less likely to adjust earnings management attempts (see Nelson et al. 2002).
their annual (audited) financial reports in four months after the fiscal year ends. Prior to the filing, managers may well have the knowledge about the realized (un-audited) earnings, and about the future earnings perspective. Such knowledge combining with the opportunity may make managers more likely to reverse an impairment loss when the realized earnings fall short of the benchmark. We use the past year’s earnings as the benchmark. Bartov (1993) contends that the best proxy for the target is last year’s earnings. Peasnell et al. (2005) also use last year’s earnings as a benchmark and find that
managers manage earnings to avoid the earnings decline (i.e., negative earnings change). We thus posit the following hypotheses:
H1: Other things being equal, reversal of an impairment loss is positively related to the
amount of a previously recognized impairment loss.
H2: Other things being equal, reversal of an impairment loss is negatively related to the
interaction between the amount of a previously recognized impairment loss and pre-reversal earnings change.
As discussed in the literature review, an effective corporate governance mechanism can improve the quality of financial reporting. In the issue of reversal of an impairment loss, we expect that the “cookie jar” reserve type of earnings management will be deterred by an effective corporate governance mechanism. That is, while firms with pre-reversal earnings not meeting the benchmark (i.e., the prior year’s earnings) will be more likely to reverse a previously recognized impairment loss, such behavior will be mitigated by an effective corporate governance mechanism. We develop the hypothesis as follows.
H3: Other things being equal, the interactive effect between a previously recognized
impairment loss and pre-reversal earnings change on the reversal of an impairment loss is moderated by the corporate governance mechanism.
Sample Selection
Taiwan’s SFAS No. 35 was effective for financial statements ended on and after December 31, 2005, with early adoption permitted. Our reversal sample thus consists of firms recognizing asset impairment losses during 2004-2005 and reversing during the period from January 1, 2005 to the first quarter of 2007. Banking or financial services industries are excluded because they are highly
regulated and have unique nature of accounting. Financially distressed firms are excluded because they are not comparable with normal firms. The reversal firms are matched by industry and size with the non-reversal (“control”) firms. The necessary data comes from Taiwan Economic Journal (TEJ) Database and Market Observation Post System (MOPS). Available observations over the sample period are 67 firm-years. We exclude from analyses one financially distressed firm, two firms without comparable matching firms and nine firms with missing data. The final sample comprises of 55 reversal firms and 55 matched firms, resulting in 110 firms in total.
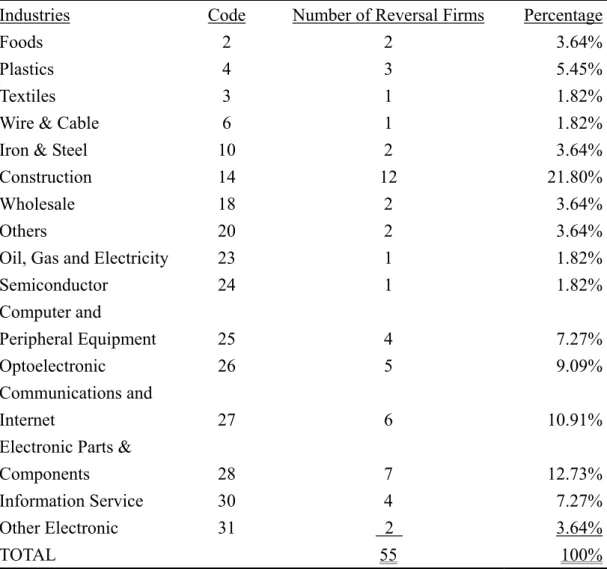
Table 1 summarizes the industry breakdowns. According to the industry coding scheme previously adopted by Taiwan Stock Exchange (TSE), 54 percent (30/55) of the reversal firms come from the Electronic Industry. It is representative of the situation in Taiwan because high-tech
companies comprise the majority of public firms in Taiwan. We further divide the Electronic Industry into eight sub-categories based on the new coding scheme which was effective on July 2, 2007. The new breakdowns show a more even distribution of industries.
Insert TABLE 1 about here Empirical Models
We use model (1) to empirically test hypotheses 1 and 2. In doing so, asset impairment losses, and the reversal of an impairment loss are the primary independent variable, and the dependent
variable, respectively.5 If a firm reverses a previously recognized assets impairment loss, the value of the dependent variable will be a positive number; otherwise it will be zero, giving rise to a potential of being a truncated datum. We employ a Tobit regression to explore the reversal of assets impairment as follows: ) 1 ..( ... * ) ( ) ( 8 7 6 2 , 1 5 4 1 1 3 1 2 1 1 0 i it it it t it it it it it it it it it it it SIZE MTB SALES MGT DEBT IMP NI REV NI IMP NI REV NI REV ε β β β β β β β β β + + + Δ + + + − − + + − − + = − − − − − − where,
REVit: the reversal of an impairment loss by firm i in year t deflated by total assets at the end of
year.
NIit-REVit-NIit-1: firm i’s pre-reversal earnings change from year t-1 to year t deflated by total
assets at the end of year t.6
IMPit-1: the impairment loss recognized by firm i in year t-1 deflated by total assets at the end of
year.
NIit-REVit-NIit-1*IMPit-1: interaction between variables NIit-REVit-NIit-1, and IMPit-1
DEBTit: firm i’s debt ratio, measured by the ratio of the total debt to the total assets at the end of
the tth year.
MGTit-1,t-2: an indicator equal to 1 if a firm changed its president or general manager in year t-1
or t-2, and 0 otherwise.
ΔSALESit: the percentage change in firm i’s net sales from fiscal year t-1 to t.
MTBit: firm i’s market to book ratio, measured by the ratio of market value to the stockholders’
equity at the end of year.
SIZEit: the logarithm of firm i’s total assets at the end of year.
Hypothesis 1 predicts that the magnitude of reversal of an impairment loss is positively related to the amount of previously recognized impairment losses. We thus expect the coefficient of IMPit-1 to
be positive. Hypothesis 2 predicts that the magnitude of reversal of an impairment loss is negatively
5 Although total amount of impairment losses consists of the impairment loss on the income statement and decreases in unrealized revaluation, this study adopts only the impairment loss on the income statement.
6 According to Tax Law in Taiwan, an impairment loss is unrealized and not deductible from taxable income. Similarly, reversal of an impairment loss is not taxable. It is not necessary to consider the tax impact when computing pre-reversal earnings.
related to the interaction between the amount of a previously recognized impairment loss and the pre-reversal earnings change. As discussed earlier, managers have incentives to reverse an impairment loss when earnings cannot meet the prior year’s earnings (Bartov 1993; Peasnell et al. 2005). We use NIit-REVit-NIit-1 to represent a firm’s pre-reversal earnings change. Positive numbers mean that the
pre-reversal earnings meet the target and negative fail. If managers reverse a previously recognized impairment loss to avoid earnings decline, the coefficient of the interaction between IMPit-1 and
NIit-REVit-NIit-1 will be negative.
Following prior research, we include DEBTit, MGTit-1,t-2, ΔSALESit, MTBit,and SIZEit as
control variables. It has been proposed that the larger a firm’s debt ratio, the more likely its managers are to engage in greater manipulation. Prior research uses debt-equity ratio to proxy debt covenants (Fields et al. 2001). We thus expect the coefficient of debt ratio (debt/total assets) to be positive. Prior studies also show that firms experiencing recent changes in top management are more likely to recognize a higher amount of impairment loss (Loh and Tan 2002; Riedl 2004). We then expect that the recent change in top management is positively related to the reversal of an impairment loss and the coefficient of MGTit-1,t-2 to be positive. We expect ΔSALESit to be positively associated with the
magnitude of reversing an impairment loss. It is because firms with sales growth whose assets will be more valuable and thus more likely to reverse an impairment loss. Similarly, the coefficient of MTBit is
expected to be positive. Finally, we include SIZEit as another control variable. Elliott and Shaw (1988)
provide evidence that firms disclosing large asset impairment losses are larger than other firms in their industries.
Hypothesis 3 predicts that, other things being equal, an effective corporate governance mechanism will deter earnings management. We incorporate a measure of corporate governance
mechanism in the analysis and estimate the following regression model: ) 2 ...( * * ) ( * ) ( ) ( 10 9 8 2 , 1 7 6 5 1 1 4 1 1 3 1 2 1 1 0 i it it it t it it it it it it it it it it it it it it it it it SIZE MTB SALES MGT DEBT CG CG IMP NI REV NI IMP NI REV NI IMP NI REV NI REV ε β β β β β β β β β β β + + + Δ + + + + − − + − − + + − − + = − − − − − − − − where,
CGit: the variable representing corporate governance mechanism.
NIit-REVit-NIit-1*IMPit-1*CGit: interaction among variables NIit-REVit-NIit-1, IMPit-1 and CGit.
Variable CGit is a composite measure for corporate governance mechanism. It consists of (1)
Board size (B_SIZE), measured as the total number of directors on the board; (2) Independent director (IND_D), an indicator variable which equals 1 if none of directors is an insider of the company and holds more than one percent of stock;7 (3) Independent supervisor (IND_S), an indicator variable which equals 1 if none of supervisors is an insider of the company and holds more than one percent of stock; (4) Institutional investors’ shareholding (%INST); (5) Foreign institutional investors’
shareholding (%FORE), and (6) The difference between control rights and cash flow rights (V-C) , computed as the percentage of voting rights minus the percentage of cash flow rights. B_SIZE, %INST, and %FORE are sorted in ascending order and V-C is sorted in descending order before computing the percentile values. We compute a composite variable (CG) which is composed of total percentile values of B_SIZE, %INST, %FORE, and V-C plus IND_D and IND_S to capture the strength of corporate governance (Bushman et al. 2004). Hence, high values of CG represent relatively strong corporate governance mechanism.
Hypothesis 2 predicts that, to meet the target, the magnitude of reversal of an impairment loss is negatively related to the interaction of the amount of a previously recognized impairment loss and pre-reversal earnings change. Hypothesis 3 further predicts that this earnings management behavior
7 The definitions of independent directors and independent supervisors follow the stipulation by Financial Supervisory Commission in Taiwan.
will be deterred by an effective corporate governance mechanism. We therefore expect β4 to be
positive.
V. EMIPIRICAL RESULTS
Descriptive Statistics
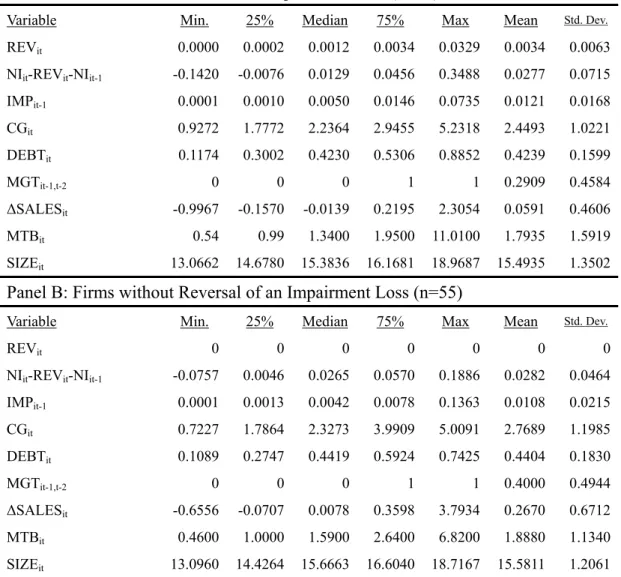
Table 2 provides descriptive statistics for firms with (Panel A) and without reversal (Panel B) of an impairment loss. The mean of assets-deflated reversal of an impairment loss (REVit) is 0.34
percent for the reversal firms and 0 for non-reversal firms. Pre-reversal earnings change
(NIit-REVit-NIit-1) for reversal firms are lower than non-reversal firms (2.77 percent and 2.82 percent,
respectively). This means that reversal firms have more incentives to increase earnings. As to the corporate governance mechanism, the mean of CGit is lower for reversal firms than non-reversal firms,
indicating CGit may mitigate the potential adverse effect of permitting reversal of an impairment loss.
Debt ratio (DEBTit) for reversal firms and non-reversal firms are 42.39 percent and 44.04 percent,
respectively. Consistent with hypothesis 1, the assets-deflated impairment loss recognized (IMPit-1) by
reversal firms is 1.21 percent, greater than non-reversal firms (1.08 percent). For reversal firms, the ratio of the reversed impairment loss to the previously recognized impairment loss is 28.10 percent (not reported), indicating a higher percentage of reversal. Reversal firms have lower management change (MGTit-1,t-2) relative to non-reversal firms, exhibiting that firms with changes in president or
general manager in the year that recognizes an impairment loss do not necessarily reverse an impairment loss in the future. ΔSALESit are 5.91 percent and 2.67 percent for reversal and
non-reversal firms, respectively. Market to book ratio (MTBit) and firms size (SIZEit) are equivalent
for reversal and non-reversal firms.
Multivariate Results
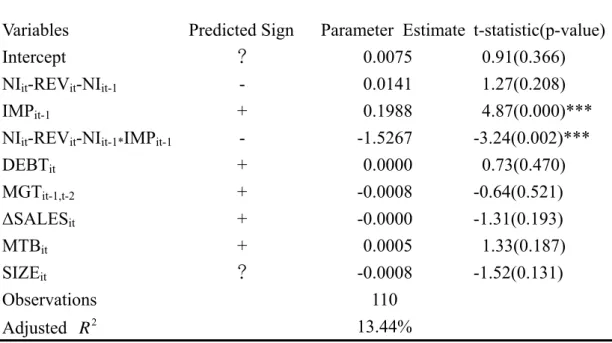
Table 3 shows the multivariate Tobit regression analysis.8 Hypothesis 1 predicts the magnitude of reversal of an impairment loss is positively related the amount of a previously recognized
impairment loss. The results show that the coefficient of IMPit-1 is positively significant (p<0.01),
indicating the more impairment loss recognized previously, the more reversal of an impairment loss subsequently. Hypothesis 1 is thus supported. In addition, we develop the “cookie jar” hypothesis, arguing that there is an interactive effect between a previously recognized impairment loss and pre-reversal earnings change on reversal of an impairment loss. Consistent with the hypothesis, the coefficient of the interaction term (NIit-REVit-NIit-1**IMPit-1) is negative and statistically significant
(p<0.01). In other words, while firms previously recognizing an impairment loss tend to subsequently reverse the impairment loss, this tendency is more pronounced for firms with a negative pre-reversal earnings change. Thus, hypothesis 2 is supported. This finding may suggest that firms recognize an impairment loss in a year so that they can reverse the loss when the earnings in the subsequent years decline. It may also suggest that the reversal of an impairment loss as prescribed in IAS No. 36 (also Taiwan’s SFAS No. 35) provides managers with an opportunity to do a cookie jar type of earnings management.
Among the other variables, the association between DEBTit and REVit is positive, consistent
with prediction but insignificant. NIit-REVit-NIit-1 is positively related to REVit but insignificant. The
sign of MGTit-1,t-2 is negative, indicating that changes in president or general manager in an asset
impairment year do not necessarily lead to reversing impairment losses in the future. ΔSALESit has a
negative sign, which is not as expected but insignificant. The signs of coefficients of MTBit and SIZEit
are positive and negative, respectively. Both are statistically insignificant. Insert TABLE 3 about here
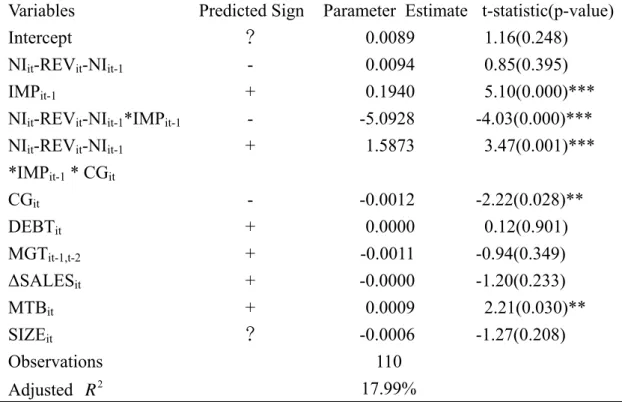
Table 4 reports the Tobit regression results after incorporating the corporate governance variable. It shows that the coefficient of the interaction of IMPit-1 (a previously recognized impairment
loss), NIit-REVit-NIit-1 (pre-reversal earnings change), and CGit (corporate governance mechanism) is
positive and significant (p<0.01). The positive and significant coefficient of IMPit-1 still holds (p<0.01).
The sign for the interaction between IMPit-1 and NIit-REVit-NIit-1 is negative and significant (p<0.01)
as reported earlier. The sign of CGit itself is negative and significant (p<0.05). These findings indicate
that while managers use the reversal of a previously recognized impairment loss to avoid earnings decline, an effective corporate governance mechanism will mitigate such behavior. Thus, hypothesis 3 is supported. Except for MTBit, the sign and significance level for the control variables remain
qualitatively the same as reported above. The sign of MTBit is not changed but becomes significant
(p<0.05).
Insert TABLE 4 about here VI. SENSITIVITY ANALYSES
In this section, we conduct analyses to examine whether our findings are robust to: (1) the measurement of NIit-REVit-NIit-1, (2) inclusion or exclusion of outliers, and (3) deflating variables by
total assets or market value at the end of the year.
Dichotomizing the NIit-REVit-NIit-1 Variable
As discussed in model (1), managers have incentives to reverse an impairment loss when earnings cannot meet the prior year’s earnings. To check the sensitivity of our findings to the
earnings change (NIit-REVit-NIit-1) by an indicator variable (hereafter dummy), which equals 0 if
NIit-REVit-NIit-1 <0, and 1 otherwise. If managers are more likely to reverse a previously recognized
impairment loss when avoiding earnings decline, the coefficient of the interaction between IMPit-1 and
dummy will be negative. Results show that, for regression model 1, the coefficient of IMPit-1 and
IMPit-1* dummyis 0.3634 (p=0.001) and -0.3433 (p<0.001), respectively. For regression model 2, the
coefficient of IMPit-1, IMPit-1* dummy, and IMPit-1* dummy* CGit is 0.3505 (p=0.001), -0.6359
(p<0.001),and 0.1378 (p<0.001), respectively. Thus, our finding is robust to the measurement of
NIit-REVit-NIit-1.
Excluding the Outliers
To minimize the effect of outliers, we delete the observations whose REVit, NIit-REVit-NIit-1, or
IMPit-1 is greater or lower than mean plus +3/-3 standard deviation. As a result, four observations are
deleted from the sample. The analysis show that the coefficient of IMPit-1and IMPit-1* NIit-REVit-NIit-1
is 0.1584 (p<0.01) and -1.1711 (p=0.015), respectively in model (1), consistent with hypotheses 1 and 2. The coefficient of IMPit-1, IMPit-1* NIit-REVit-NIit-1, and NIit-REVit-NIit-1*IMPit-1*CGit is 0.1767
(p<0.01), -0.6029 (p<0.01), and 1.6355 (p<0.01), respectively in model (2), consistent with hypothesis 3. Thus our findings remain essentially unchanged after excluding the outliers.
Deflating Variables by Market Value at the End of the Year
Instead of using total assets at the end of year, we deflate variables (such as the impairment loss, pre-reversal earnings change, and reversal of an impairment loss) by market value at the end of the year in model (1) and (2) to check the robustness of our findings. The results show that the