行政院國家科學委員會專題研究計畫 成果報告
固態燃料電池封裝玻璃之合成與性質分析(2/2)
研究成果報告(完整版)
計 畫 類 別 : 個別型 計 畫 編 號 : NSC 95-2221-E-002-161- 執 行 期 間 : 95 年 08 月 01 日至 96 年 07 月 31 日 執 行 單 位 : 國立臺灣大學材料科學與工程學系暨研究所 計 畫 主 持 人 : 韋文誠 計畫參與人員: 碩士班研究生-兼任助理:陳右儒、陳怡如、蔡居諭 報 告 附 件 : 國外研究心得報告 出席國際會議研究心得報告及發表論文 處 理 方 式 : 本計畫可公開查詢中 華 民 國 96 年 08 月 14 日
行政院國家科學委員會補助專題研究計畫
成果
報告
固態燃料電池封裝玻璃之合成與性質分析(兩年)
計畫類別:■ 個別型計畫
計畫編號:NSC 95-2221-E-002-161
NSC94-2216-E-002-020
執行期間:94 年 8 月 1 日至 96 年 7 月 31 日
計畫主持人:
韋文誠教授,台大材料系
計畫參與人員:
陳右儒、陳怡如、蔡居諭
成果報告類型(依經費核定清單規定繳交): ■完整報告
本成果報告包括以下應繳交之附件:■赴國外研習心得報告一份
處理方式:除產學合作研究計畫、提升產業技術及人才培育研究
計畫、列管計畫及下列情形者外,得立即公開查詢
執行單位:國立台灣大學材料科學及工程學系
中 華 民 國 九十六年八月十四 日
摘要
本研究為兩年期之計畫,計畫將進行固態燃料電池中金屬(Kovar
&Crofer 22)與電解質氧化物(氧化鋯基)之間,用於接合及封裝兩系
列玻璃的合成與分析工作。研究內容主要分成四個主題,第一是合成
低熔點鉍系及鋇系氧化物玻璃,用於固性封裝,量測並報導兩種玻璃
之性質,包括軟化點、潤濕性、電絕緣性等。第二是分析探討不同材
料與封裝玻璃之界面反應現象,將採用分析式電鏡,進行微結構定量
分析。第三主題是探討玻璃系統在 YSZ/crofer22 介面的接合強度及
特性,第四是封裝後之洩漏性質,將在室溫及高溫(600
oC)進行測試,
將不同材料疊層之組合進行氣體洩漏率及玻璃強度之測試。相關的界
面反應動力及分子擴散機制也有深入探討。
關鍵字:固態燃料電池、封裝、玻璃陶瓷、界面反應
ABSTRACT
This is a two years project within three topics. The glass systems,
either rigid sealing or compliant sealing functions were developed for
planar solid oxide fuel cell operating at 600
oC. The application of seals is
focus on interface of interconnect (Kovar and Crofer 22) and electrolyte
(8Y-YSZ). The first topic is oxide glass synthesis. Three series of sealing
glasses, lead glass (PbO-ZnO-SiO
2-B
2O
3) and two lead-free glass systems
(Bi
2O
3-ZnO-SiO
2-B
2O
3and BaO-SiO
2-B
2O
3) were characterized.
Thermal and chemical stability, the bonding characteristics, and wetting
behavior to yttria stabilized zirconia (YSZ) electrolyte were tested. The
second topic is analyzed the interfacial morphologies and composition of
the glass-ceramic systems by SEM and EDS. The results were also
confirmed by XRD and TEM techniques. The crystalline of the glass and
interfacial reaction would affect the ion-conductivity of YSZ. The
diffusion of Pb and Bi species in glass and interfacial reaction with YSZ
are discussed in this reported as well. The third topic is about the bonding
strength of the test bars, which in joint YSZ/Crofer22. The last is the
leakage rate of sealing glass system at both room temperature and 600
oC
(operating temperature). The related interfacial reaction kinetics and
molecular diffusion mechanism are also reported in this report.
「燃料電池封裝玻璃之合成與性質分析」期末報告
大綱
頁次
中文摘要
2
Abstract
3
I.
Introduction of Glass-Ceramics Systems for Sealing
of SOFC
6
II.
Bi- and Pb-glass Ceramic Systems
11
2.1 Preparation of Bi- and Pb-glasses
2.2 Characterization of the Glass-Ceramics
2.3 Results of Pb- and Bi-Oxide Serials Glasses
2.3.1 Properties of the Pb-Glass Ceramics
2.3.2 Properties of Bi-Glass Ceramics
(a) Bonding, Wetting, and Interf. Chem. React.
(b) Electrical conductivity
(c) Creeping behavior analysis
2.3.3 Interface Reaction with Kovar and Crofer 22
2.3.4 Modification of B4 Glass System
11
12
13
III. Ba-glass Ceramic Systems
24
3.1 Experiment of Ba-Glass Preparation
3.1.1 Glass preparation
3.1.2 Glass Characterization
3.1.3 Bonding and Wetting Behavior
3.1.4 Long-term operation stability
3.1.5 Interface reaction
3.1.6 Bonding Strength
3.2 Results
3.2.1 Thermal Properties of the Glasses
3.2.2 Crystallization Behavior
3.2.3 Wetting Behavior of Glasses
3.2.4 Long-term Stability Analysis
3.2.5 Interfacial reaction between glass and
YSZ/Crofer 22
24
3.2.6 Bonding Strength
IV. Leakage Rate Measurement of Glass G1A10
4.1 Design of Leakage test Device
4.2 Leakage Rate Measurement
4.2.1 Test Sample Preparation
4.2.2 Flow Chart of Joint
4.3 Results
36
36
38
39
V. Conclusions
42
VI.
計畫成果自評
44
I. Introduction of Glass-Ceramics Systems for Sealing of SOFC
Glass and glass-ceramic materials are the most common sealants used in SOFC. The glass-ceramic systems can be shaped as easy as a molten glass, and as strong as a polycrystalline ceramics. Several glass-ceramics, e.g. VycorTM, are well known and being widely applied in advanced applications.[1]
There are several stringent requirements in mechanical, chemical and electrical aspects for the selection of a suitable glass or glass-ceramic sealants. Three properties are very fundamental for the glass. One is the glass transition
temperature (Tg) and the other is the coefficient of thermal expansion (CTE) of the
glass-ceramics. The glass transition temperature is important to allow the glass to flow sufficiently and to provid an adequate sealing function, while maintaining sufficient rigidity for mechanical integrity (compliant sealing). The coefficient of thermal expansion (CTE) must match other cell components, such as the yttria-stabilized zirconia (YSZ) electrolyte and the interconnect material, to minimize thermal stresses. Finally, the electric resistivity of the glass-ceramics should better be than 106 ohm/cm.
Various glasses and glass-ceramics with values of Tg and CTE in target range
(~800oC) are shown in Table 1.1 designed for ZrO2 electrolyte. Many glasses and
glass–ceramics contain alkali metal oxides [2,3]. Although they have suitable CTE close to YSZ, the oxides easily react with other fuel cell components and poor electric resistivity. For SOFC applications, alkaline-earth-based (especially the BaO) boro-silicate glasses are more commonly used. It has been shown to operate at higher temperature (800oC) more that 1000 h without significant degradation.[4] The
1 Chapter 8 in Fundamentals of Ceramics, by Michel Barsoum, McGraw-Hill Series in Mat. Sci. and
Eng., Int. Ed. 2000
2 K. L. Ley, M. Krumpelt, R. Kumar, J. H. Meiser, and I. Bloom, J. Mater. Res., 11 (1996) 1489-1493 3 H. Rawson, Properties and Applications of Glass, Ch 3 & Ch 8, Elsevier Science Publishing
Company Inc., 1980
examples of detail analysis of the composition on the Tg, wetting angle, strength, CTE,
and leak rate of gas are given by Fergus.[4]
Table 1.1 Glass and glass-ceramic of silicates sealants used for various temperature ranges
All designed for matching ZrO2 electrolyte
Properties Composition
Tg (oC) (ppm/CTE oC) Characteristics Ref.
BaO-Al2O3-SiO2-B2O3 610~670 9.3~12.8
Thermal properties can be adjusted with NiO, ZrO2, and La2O3. CTE
may change by crystallization. B2O3
volatizes with water vapor.
5 6
BaO-Al2O3-SiO2 690~720 10.5~11.4
The most popular system in sealing field.
CTE value decrease due to crystallization. Doped MgO is able to
control the rate of crystallization.
7
BaO-SiO2-B2O3-RO (R=Ca,
Mg, Zn)
625~66 0
10.5~11. 4
Have suitable thermal properties, but rapidly
crystallization.
4
SrO-La2O3-Al2O3-B2O3-SiO2 560-760 7.5-11.5
High Tg system, CTE
value decrease due to crystallization
8
BaO-SiO2-RO (R=Mg, Zn) 673~721 10.5~12
Lower BaO/RO ratio have better sintering/crystallizatio n for obtaining suitable
glass-ceramics. But have lower CTE value.
9
SiO2-Al2O3- CaO-MgO-RO ?? OK For sealing plates 10
NiO-ZrO2-CoO-CaO-SrO-meta ?? ?? Sealing and gap filler 11
5 S. Sohn, S. Choi, G. Kim, H. Song, and G. Kim, J. Am. Ceram. Soc., 87(2004) 254-60. 6 S. Sohn, S. Choi, G. Kim, H. Song, and G. Kim, J. Non-Cryst. Solids, 297 (2002) 103-112 7 C. Lara, M. J. Pascual, and A. Duran, J. Non-Cryst. Solids, 348 (2004) 149-155
8 US patent 5,453,331 (Univ. of Chicago) Sep. 26, 1995
9 C. Lara, M. J. Pascual, M.O. Prado, and A. Duran, Solid State Ionics, 170 (2004) 201-208 10 C. Thompson, A. Wood, S. Pyke, US patent 6,656,625, Alstom UK Ltd. (GB)
l filler
Bi2O3-ZnO-B2O3-ZnO 450 11.9
CTE value decrease due to crystallization
and higher electrical conductivity
12, 13
MgO-Al2O3-P2O5 600 4.5~5.6 The CTE value is too low for application 14
MgO/CaO/Cr2O3 - Al2O3- B2O3-P2O5 600-630 5.7-7.9 CaO content determined interface reaction and 15 Fe2O3-P2O5-(Al2O3, SiO2, B2O3) 500~51 0 4.5
The CTE value is too low for application 16
60SnO-10MgO-30P2O5-B2O3 ? 11
Doped with 6~50 mol% B2O3 will rise
CTE to 11ppm/K
17
CaO-B2O3-SiO2 ? ? Sintering temperature at 875oC 18
Mica/SiO2-B2O3-Al2O3-BaO ? 11
Doped more than 10% mica will lower CTE
of glass
19
Only five US patents have been found relating to the sealing glasses used for SOFC (Table 1.2). They have the claims covered the glass compositions and the applications that are similar to previous study. The oxide ingredients are mainly silicate, doped with ZnO- or the other alkaline-earth oxides. It is difficult without infringing on the formulation ranges and claims of those patents.
Table 1.2 US patents with the claims on sealing glass for SOFC US Patent
no.
Glass composition Claims Assignee
6,656,625 Si-Ca-Mg-Al-oxides
SiO2 (43-59wt%), Al2O3(5-7%)
CaO (10-20.8%), MgO (0-30%) or BaO (0-36.3%), or TiO2 (4%)
Good CTE match
up to 1000oC Alstom. UK 6,291,092 MO-Zn-Si-oxides
SiO2 (50-70 wt%), ZnO (10-25%)
K2O (5-15%), Na2O (2-10%)
Ba, Ti, Zr,-oxides (0-10%)
600-1000oC application temperature Corning 6,271,158 Corning 4060 or 3103 glasses, SiO2 (50-70 wt%), ZnO (10-25%) K2O (5-20%), Na2O (1-15%)
Li, Ba, Zr, Ca, Mg-oxides (0-8%)
A mixture of glasses (>40 wt%) with metal (Ni, Fe,
AlliedSignal
12 I. Dyamant, D. Itzhak, and J. Hormadaly, J. Non-Cryst. Solids, 351 (2005) 3503-3507
13 Y. J. Chen “Investigation of Vapor Phase Thin Film Deposition and Interfacial Reaction in Bismuth
Oxide Glass/YSZ System”, (2006) NTU MS thesis
14 P. H. Larsen, F.W. Poulsen, and R. W. Berg, J. Non-Crystalline Solid, 244 (1999) 16-24 15 P. H. Larsen, and P. F. James, J. Mat. Sci., 33 (1998) 2499-2507
16 P.A. Bingham, R.J. Hand, and S.D. Forde, J. Mat. Res. Bulletin, 41 (2006) 1622-1630 17 C. C. Hsieh, and. J. J. Shyu, Taiwan Ceram. Soc. Conference, (2007) 156
18 C. C. Chiang, S. F. Wang, Y. R. Wang, and Y. F. Hsu, Taiwan Ceram. Soc. Conference, (2007) 161 19
Cr) particle 5,702,837 Ni-Zr-Co-Ca-Sr-oxides with
W, Ta, Nb, Mo, Ti reactive metal ingredients Slurry formulation for anode-anode bonding AlliedSignal 5,453,331 La-Sr-Al-Si-B-oxides, SrO (5-60%) -La2O3 (0-45%) -Al2O3 (0-15%)-B2O3(15-80%) -SiO2 (0-40%) or Ca-Al-B-Si-oxides Wide range of Tg
and CTE matching to YCZ
Univ. of Chicago
Objectives
:1. Find a glass-ceramic system with Tg in between 600 to 750oC, therefore, can be
applied for the SOFC at the operation range of 800-850oC, which is the application temperature of bulky 8Y-SZ; (refer to Fig. 1.1)
2. Find a glass-ceramic system with Tg between 450 to 600oC, therefore, can be
applied for the SOFC at the application range of 800-850oC, which is the application temperature range of ultra-thin 8Y-CSZ electrolyte. [20](refer to Fig. 1.1)
3. Fully characterize the material properties of above two glass-ceramic systems. 4. Study the interface microstructure of above two glass-ceramic systems next to the
YSZ electrolyte;
5. Study the interface microstructure of above two glass-ceramic systems next to selected metal alloys, including Kovar and Crofer 22.
20
Y. Y. Chen and W. J. Wei#, 2006, “Processing and characterization of ultra-thin yttria stabilized
zirconia (YSZ) electrolytic film for SOFC,” Solid State Ionics, 177, [3-4] pp. 351-357, NSC92-2212-E-002-097 and the NSC-DAAD summer program of 2002
5 6 7 8 9 10 11 12 13 14 400 450 500 550 600 650 700 750 800 Tg (oC) CTE (ppm/K)
Ba boroaluminosilicates [36, 35] BaCa borosilicates [21] Ba aluminosilicate [4] BaCa silicate [21] BaMg silicate [6] BaZn silicate [6] Sr borate [22] MaCaBa borate [28] MgCaSr borate [28] BaZn borate [9] BiZn borosilicate [17] BaCa aluminosilicate [4] BaMg aluminosilicate [4] BaZn aluminosilicate [4] Bi-Zn-B-Si
Fig. 1.1 Glass transition temperature (Tg) and coefficient of thermal expansion (CTE)
for SOFC sealant materials. The solid-line rectangle represents the favor range for a higher-operation-temperature SOFC; the dash-line rectangle represents the favorable range for an intermediate operation temperature SOFC.
CTECeO2
CTE8Y-YSZ
Apply for 500-650oC
(intermediate SOFC) operation
Apply for 650oC-800oC (High
II. Bi- and Pb-glass Ceramic Systems
The whole purposes in this section is mainly to find a glass system that can be used for the SOFC applied below 500<<650oC. The experimentals and tasks could be separated into four parts and listed below:
¾ preparation of glasses;
¾ glasses and glass-ceramics characterization (crystalline phase, thermal properties, and electrical conductivity);
¾ bonding, wetting, and interfacial chemical reaction; creeping behavior analysis
¾ Creeping behavior of glass-ceramics 2.1 Preparation of Bi- and Pb-glasses
Seven commercial glass powders were purchased from Exojet Technology Corporation (技嘉科技). One glass GP-014 (assigned P1) having desirable properties was fully characterized and reported in this report. The main composition of this glass is PbO, ZnO, SiO2 and B2O3, average particle size is 1.94 μm (Table 2.1). Inductively
coupled plasma (ICP, Jobin Yvon) was employed to analysis the compositions of Pb-glass. Besides, Bi2O3 was used to substitute PbO. In previous report the glass
transition temperature (Tg) strongly dependent on B2O3/SiO2 ratio. Because P1 glass
has a lower Tg, we reduced B2O3/SiO2 ratio to 0.25-0.50 in order to raise Tg.
Table 2.1 One PbO-commercial glass and Bi-Zn-Si-B glass compositions
Glass Composition (mol%) PbO ZnO SiO2 B2O3 B2O3/SiO2
P1 35.42 39.14 8.07 17.36 2.15 Bi2O3 ZnO SiO2 B2O3 B2O3/SiO2
B1 35.42 39.14 16.69 8.48 0.5 B2 25 25 33.33 16.66 0.5 B3 25 25 40 10 0.25 B4 30 20 40 10 0.25
Literature review has assured that there is no quaternary phase diagram, only two ternary phase diagrams Bi2O3-ZnO-SiO2 and Bi2O3-ZnO-B2O3 available, as shown in
Fig. 2.1 Ternary phase diagrams Bi2O3-ZnO-SiO2 and Bi2O3-ZnO-B2O3.
Bi-glasses were synthesized from analytical grade fused silica, Bi2O3, ZnO and
H3BO3. Batch formulations were calculated to produce 50 g glass sample in Pt
crucible. An electric furnace was used for melting the batches at temperature 1200oC and quenched with water. The glasses were ground using an agate and sieved through a sieve of 150 mesh. Pellets were made by die-pressing of granulated glass powder. The design of this work required only the sealing between the electrolyte and interconnect. Yttria-stabilized zirconia is a common material used as SOFC electrolyte. The YSZ plates were prepared from 8 mol% YSZ (TEAMCera, Taiwan) by pressure filtration, sintering, and polishing.
2.2 Characterization of the Glass-Ceramics
The as-prepared glasses were analyzed by X-ray diffractometry (Philips PW 1972, Philips Instrument, Netherlands) with Cu Kα radiation to confirm the amorphous nature of glass.
The thermal properties of the glasses, such as glass transition temperature (Tg) and
crystallization temperature (Tc) were measured using differential thermal analysis
(DTA, DuPont, 1600DTA) in air at a heating rate of 5oC/min. CTE values of glass and glass-ceramic were measured by TMA (TMA 2940 Thermo-mechanical Analyzer (TA), DuPont, USA)
After thermal treatments glass-ceramic were characterized using XRD and scanning electron microscopy to investigate the crystallization behavior of the glasses. XRD measurements were performed to identify the precipitated crystalline phases and to observe the development of crystalline phases, which were evaluated from the comparison of the relative intensities of the largest peaks corresponding to each phase in the XRD patterns. SEM (Tungsten, Philips XL30,) observation on the polished surface of heat-treated glass was conducted to investigate microstructure changes causing by crystallization and at operation temperature.
The electrical conductivities were measured by two-probe measurement, from room temperature to Tg.
2.3 Results of Lead and Bismuth Oxide Serials Glasses
The thermal properties of glasses were analyzed by DTA and shown in Table 2.2. P1 glass has a lower Tg and Tc, because of higher B2O3 content and melt at 630 oC.
In Bi2O3 glass system, Tg will decrease with increasing the concentration of
Bi2O3. The B4 glass has higher Tg and Tc suitable for the requirement of SOFC
sealing application. But if heat-treated at 650oC for more than 1 hr, crystallization of Bi4(SiO4)3, Bi12SiO20, and Zn2SiO4 will appear and lower down the CTE value to 4
ppm/K.
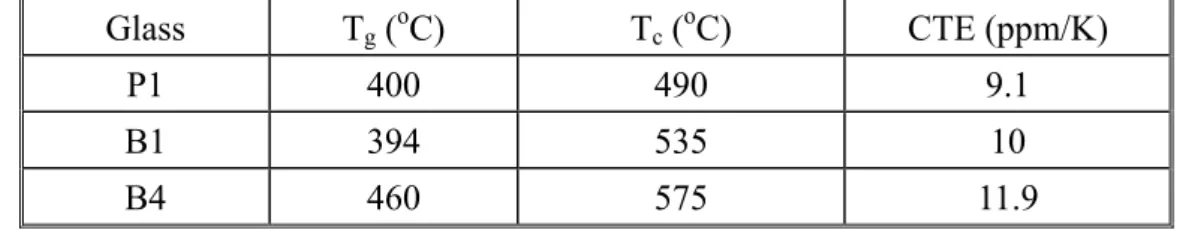
Table 2.2 Glass transition temperature (Tg), crystallization temperature (Tc), and
coefficient of thermal expansion of glass.
Glass Tg (oC) Tc (oC) CTE (ppm/K)
P1 400 490 9.1
B1 394 535 10
B4 460 575 11.9
2.3.1 Properties of the Pb-Glass Ceramics
P1 glass shows a good wetting on YSZ at 650oC (Fig. 2.2). Fig. 2.3 shows the cross-section of the glass P1/YSZ interface heat-treated at 650oC. At first 1 hr shown in Fig. 2.3(a), there is no significant inter-diffusion between glass/YSZ. But Pb had shown significant diffusion at >10 hr. Because the coordination number and ionic radius of Pb2+ are small, the Pb+2 easily diffused into YSZ and reacted with ZrO2 to
form PbZrO3. At 100 hr, the diffusion distance of Pb2+ could reach 100 μm.
0 10 20 30 40 50 60 70 80 90 100 110 120 130 140 0 10 20 30 40 50 60 70 80
Holding time (hour)
C o n tact an g le ( d eg ree)
Fig. 2.3 SEM cross-section views of glass P1/YSZ interface heat-treated at 650oC for (a) 1, (b) 10, and (c) 100 hr.
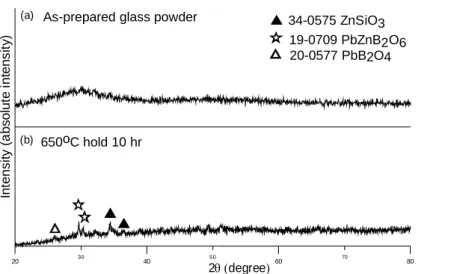
Fig. 2.4 shows the XRD patterns of glass P1 heat-treated at 650oC for various periods. The specimen of as-prepared glass powder exhibited a broad intensity in XRD pattern. After 10 min and 10 hr heat-treated at 650oC, the glass exhibited poor crystallinity. 20 30 40 50 60 70 80 2θ (degree) In te n s it y (a bs ol ut e i n tens it y )
As-prepared glass powder
650oC hold 10 hr 20-0577 PbB2O4 19-0709 PbZnB2O6 34-0575 ZnSiO3 (a) (b)
Fig. 2.4 XRD patterns of as-prepared P1 glass and heat-treated at 650oC for 10 hr. In brief, P1 glass has a low melting point (630oC) and the Pb2+ in the glass would diffuse into YSZ to form PbZrO3, poisoned electrolyte. It is not suitable as SOFC
sealing glass.
In Bi-glass system, B4 has better thermal properties matching to SOFC requirement, and has a better junction with YSZ.
(a) Bonding, Wetting, and Interfacial Chemical Reaction
The operation temperature of a thin electrolyte SOFC[20] is between 575-750oC, so the operation temperature in this investigation was set at 600oC and with acceleration test at 650oC up to 100 hr.
The bonding characteristics and wetting behavior of the glass to YSZ and to Kovar were examined by observing the wetting behavior of the glass. The chemical reactivity between the YSZ, glass-ceramic, and Kovar were investigated using heat-treatment up to 100 hr at 650oC. After the heat treatment, a cross section of the specimen was polished, and the interface between the glass-ceramics and the YSZ then was examined using SEM (Philips XL30) with EDS (EDS, England) to investigate chemical reactivity and microstructure change at the interface as a result of a long-term operation. No boron could be detected by the EDS instrument. Consequently, boron was not reported in the following results.
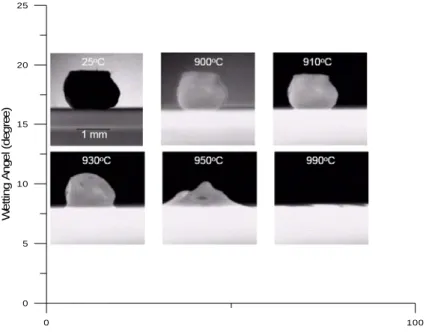
The wetting behavior of the glass was investigated by observing shape change of the bulky cylinders on YSZ plate at increasing temperature. The shape change of the cylinders might be affected by the glass viscosity and fluidity, the glass normally underwent crystallization and melting simultaneously. The results (Fig. 2.5) show that the glass starts to wet on YSZ substrate as the temperature reaches 930oC.
0 100 0 5 10 15 20 25 W e tt in g A n ge l (d eg re e ) Temperature (oC)
Fig. 2.5 Shape change of glass bulk specimen at various temperatures (heating rate: 5oC/min).
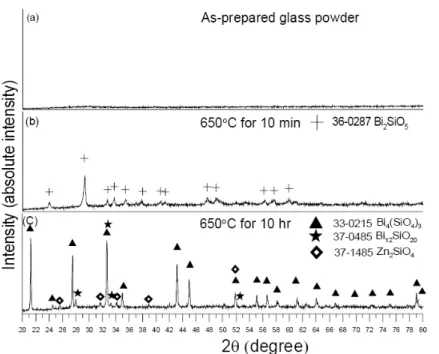
In order to develop a good sealant, it is necessary to understand the crystallization behavior, sealing properties, and long-term stability at applied temperature. Fig. 2.6 exemplified the XRD patterns of the B4 glass powder and treated at 650oC. The spectra of the as-casted glass exhibited broad diffraction intensity in the XRD pattern.
Fig. 2.6 XRD patterns of glass B4 heat-treated at 650oC for various periods. At 650oC holding for 10 min, column crystal Bi2SiO5 was found to be the main
crystalline phase in the glass, as shown in Fig. 2.6(b). As the holding time was longer than 1 hr, Bi2SiO5 dissolved into glass phase and re-crystallized into Bi4(SiO4)3,
Bi12SiO20, and Zn2SiO4 (Fig. 2.6(c)). Detail micro-observation showed four crystalline
phases in Fig. 2.7(a). It is believed that all B2O3 content due to its glass forming
ability forms the glassy boundary with Bi2O3 and ZnO ingredients.
The diffusion of Bi-species into ZrO2 is noted in Fig. 2.8(b) along YSZ grain
boundary, especially the interface without the growth of Zn2SiO4 crystals. The
Zn2SiO4 layer next to ZrO2 seems play a role to block the transport of the Bi-B-Zn-O
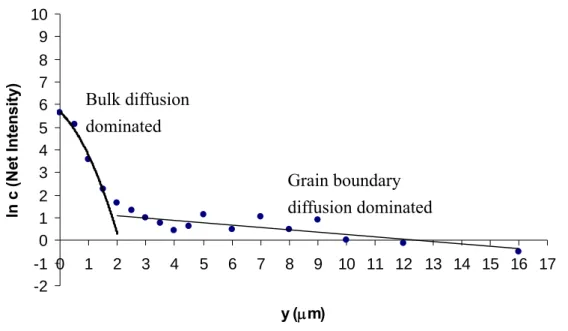
glass. The depth of the diffusion is limited to a few micrometers as holding for 10 hr. The maxima diffusion depth of the sample was 8 μm in average. The crystallization reaction sequence of the glass is proposed as follows. Bi2O3, ZnO, SiO2 and B2O3
react at 650oC, only the Bi2SiO5 phase exists at the first moment. The other elements
forms glass phase in small quantity in the matrix, but still not able to creep at this temperature. As the time extends, the Bi2SiO5 phase either dissolves into the glass
phase, then re-crystallizes a new phase Bi4(SiO4)3. During the crystallization, both
YSZ grains could act as the nuclei for the growth of Zn2SiO4 crystals. The formation
of the nuclei explains the preferential growth of the crystals at the interface. The diffusion of Bi-species was analyzed, as shown in Fig. 2.8. The results of lattice diffusivity are 1.3615×10⁻¹⁷ m2/s and grain boundary diffusivity is 4.1×10⁻⁸ m2/s.
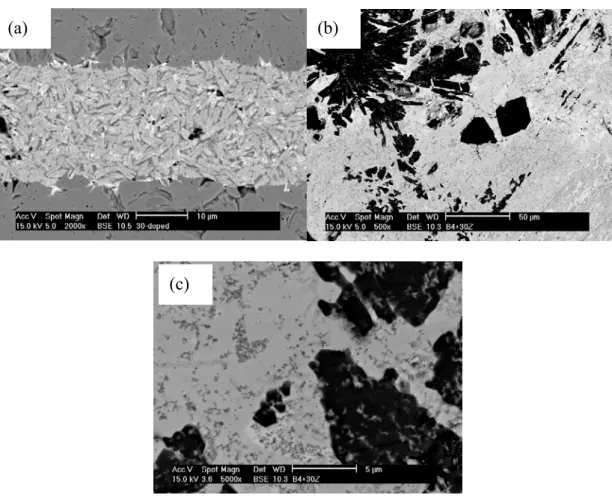
Fig. 2.7 (a) SEM morphology of B4 glass heat-treated at 650oC for 7 hr. [A] represents the crystalline phase Bi12SiO20, [B] represents the phase Zn2SiO4, [C]
represents the phase Bi4(SiO4)3, and [D] represents the glass phase. (b) SEM
cross-section micrograph of glass/YSZ interface, which was heat-treated at 650oC for 10 hr. -2 -1 0 1 2 3 4 5 6 7 8 9 10 0 1 2 3 4 5 6 7 8 9 10 11 12 13 14 15 16 17 y (μm) ln c ( N et Int ens it y)
Fig. 2.8 Diffusion profile of B4-glass/YSZ after a heat treatment at 650oC for 10 hr. There are two regimes of bulk diffusion and grain boundary diffusion.
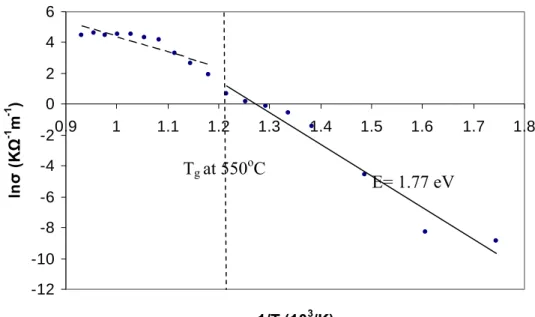
(b) Electrical conductivity. Fig. 2.9 shows the conductivity versus temperature of B4-glass after a heat treatment at 650oC for 10 hr. There are two best-fitted slopes
(a) (b) [A] [C] [B] [D] Bulk diffusion dominated Grain boundary diffusion dominated
shown in Fig. 2.9. The activation energy of B4-glass below Tg is 1.77 eV. -12 -10 -8 -6 -4 -2 0 2 4 6 0.9 1 1.1 1.2 1.3 1.4 1.5 1.6 1.7 1.8 1/T (103/K) ln σ (K Ω -1 m -1 )
Fig. 2.9 Conductivity versus temperature of B4-glass after 650oC for 10 hr heat treatment (sample diameter=5.4 mm and thickness=0.98 mm).
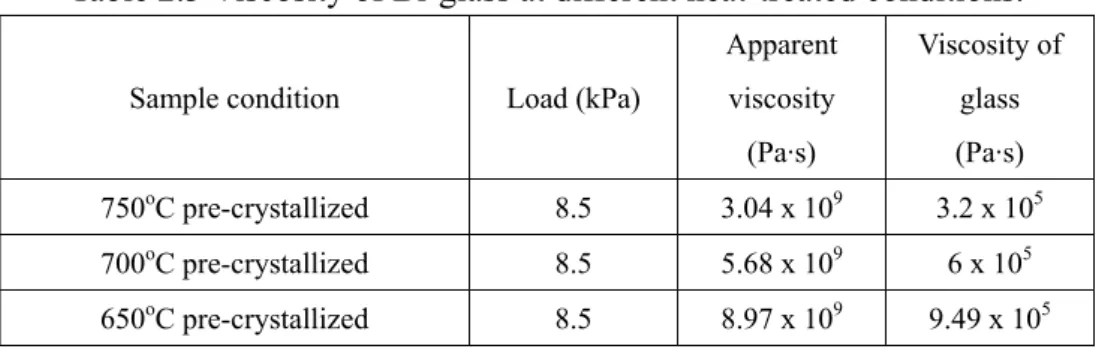
(c) Creeping behavior analysis. TMA (DTA, DuPund, 1600DTA) was employed to analyze the creeping behavior of glass. All samples were measured in air with a heating rate of 5oC/min. Fig. 2.10 shows the creeping behavior result of as-crystallized YSZ/glass/YSZ sandwich sample at 750, 700 and 650oC with a heating rate of 10oC/min and 8.5 kPa loading. The creeping rate is higher as the temperature is higher. A creeping rate (0.114 μm/hr) at 650oC supply sufficient viscous flow to
healing the cracks. The viscous flow of glass can explain this phenomenon[1].
The creep rate was proportional to temperature. The viscosity can be estimate by eq. (1) [2-3]. ⋅ ⋅ = + = ε σ ε υ σ η 3 ) 1 ( 2 ………...………...…….(1)
The results of apparent viscosity are listed in Table 3, where σ is the applied stress. The unit of σ is Pa. ε is the strain rate measured during creep tests and υ is the Poisson’s ratio of glass bulk.
Tg at 550oC
0 3600 7200 10800 14400 18000 21600 25200 28800 32400 36000 39600 Time (sec) -30 -20 -10 0 10 20 Di sp la ce m e n t ( μm) 0 5 10 15 20 25 Te mp e ra tu re ( oC) 750oC-Creep rate= -0.336 μm/hr 650oC-Creep rate= -0.114 μm/hr 700oC-Creep rate= -0.18 μm/hr
Fig. 2.10 Creep behavior of YSZ/glass/YSZ sandwich samples at 750, 700, and 650oC for 10 hr with a 8.5 kPa load.
Table 2.3 Viscosity of Bi-glass at different heat-treated conditions.
Sample condition Load (kPa)
Apparent viscosity (Pa·s) Viscosity of glass (Pa·s) 750oC pre-crystallized 8.5 3.04 x 10⁹ 3.2 x 10⁵ 700oC pre-crystallized 8.5 5.68 x 10⁹ 6 x 10⁵ 650oC pre-crystallized 8.5 8.97 x 10⁹ 9.49 x 10⁵
The degree of crystallization in the glass affects the viscosity. It changes with the amount, the size and shape of crystals, which has been described as below [4-5]:
m f ) 1 ( 0 − =η η ………..……….(2) 3 2 3 (1 2 ) F m F F − = − ……...………...(3)
where η0 is the viscosity of the glass, f is the volume fraction of the crystals
(inclusions) and m is a constant, a function of the shape of crystals. F is the shape factor. The calculations of apparent viscosity are listed in table 2.3.
2.3.3 Interface Reaction with Kovar and Crofer 22
Bismuth oxide based glass has a large amount of reaction with Kovar comparing
⋅ ⋅ = + = ε σ ε υ σ η 3 ) 1 ( 2
with YSZ shown in Fig. 2.11, and the diffusion analysis of glass between YSZ and Kovar, as shown in Fig.11. A porous oxidization layer formed at alloy surface, which has lower joining strength, cracked during sample preparation. Large amount of Fe-rich crystals were caused by FeO diffusing into the glass and inducing crystallization. It needs surface coating on Kovar surface to prevent oxidization and supply better joining strength.
Fig. 2.11 (a) SEM (backscattering mode) cross-section micrograph of YSZ/glass/Kovar interface, which was heat-treated to 950oC joining with YSZ
and Kovar for 10 min and quenched. (b) Higher magnification of point A. (c) Higher magnification of glass/Kovar interface.
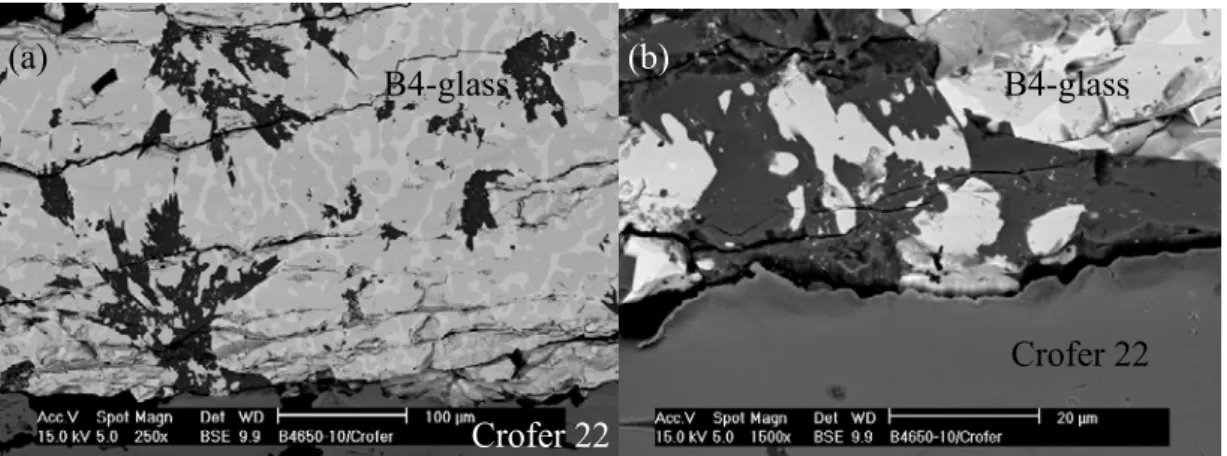
Fig. 2.12 shows the cross-section of B4-glass jointed with Crofer 22 at 650oC
with 10 hr heat-treated. Although there is no apparent oxide layer of Crofer 22 being observed, CTE mismatch induced a crack along the interface. There are also cracks inside the glass-ceramic body. So B4-glass/Crofer 22 appeared a weak bonding, needed improvement by reducing CTE mismatch, of which doped with ZrO2 will be
reported in next section.
2 μm Kovar 3 μm Glass (c) (b) Glass A (a) Glass Kovar Glass+Fe-rich crystals
Fig. 2.12 Schematic diagram of diffusion analysis between Kovar/glass/YSZ.
Fig. 2.13 SEM cross-section images of B4-glass joint with Crofer 22 at 650oC with 10 hr heat-treated.
2.3.4 Modification of B4 Glass System
B4 glass shows good thermal properties at glass state, but not at glass-ceramic state. We expected to modify this system in CTE properties by doping 0Y-ZrO2. Pure
0Y-ZrO2 has CTE property close to the other components in SOFC and shows a lower
electrical conductivity. Fig. 2.14 shows the microstructure of the B4 glass with 30 wt% ZrO2 holding at 650oC for 10 hr or 100hr. The dopant ZrO2 can raise the CTE of
B4Z30 glass-ceramics to a CTE value of 10 ppm/K.
Fig. 2.15 shows the XRD results of B4-doped ZrO2 samples with different
YSZ B4-glass with a little FeO B4-glass + Fe-rich crystals Bi-rich crystals segregated Fe, Ni-rich and
porous structure Kovar 35 μm ZnO (19%) SiO2 (39.89%) Bi2O3 (36.6%) Fe2O3 (4.41%) Co2O3 (0%) NiO (0%) ZnO (13.2%) SiO2 (17.6%) Bi2O3 (14.67%) Fe2O3 (31.61%) Co2O3 (5.12%) NiO (17.78%) Fe (54%) Co (17%) Ni (29%)
【 Kovar/ B4-glass/ YSZ Diffusion analysis 】
(a) (b)
B4-glass
Crofer 22
Crofer 22
annealing periods. Four crystalline phases, including ZrSiO4, Bi12SiO20, Bi2SiO5, and
Bi4ZnB2O10, were identified in the sample by 10 hr heat treatment. As the treatment
extending to 100 hr, a new phase Bi7.38Zr0.62O12.31 grown from glass phase was
observed, which would lowered down the CTE value.
Fig. 2.14 SEM cross-section images of 30 wt% ZrO2 doped B4-glass with 650oC (a)
10 hr and (b) 100hr heat-treated. (c) The higher magnification of 100 hr-treated sample.
(a) (b)
20 22 24 26 28 30 32 34 36 38 40 42 44 46 48 50 52 54 56 58 60 62 64 66 68 70 72 74 76 78 80
In
tens
ity
(ab
so
lut
e
in
tens
ity
)
Bi4(SiO4)3 Zn2SiO4 33-0215 37-1485 36-0287 Bi2SiO5B4-glass 650oC for 10 hr B4-glass 650oC for 10 min
B4-glass+30 wt% ZrO2 with 650oC 10 hr
37-0485 Bi12SiO20 (a) (b) (C) 33-1485 ZrSiO4 36-0287 Bi2SiO5 37-0485 Bi12SiO20 41-0701 Bi4ZnB2O10 33-1485 ZrSiO4 36-0287 Bi2SiO5 37-0485 Bi12SiO20 41-0701 Bi4ZnB2O10 43-0445 Bi7.38Zr0.62O12.31 (d) B4-glass+30 wt% ZrO 2 with 650oC 100 hr
2θ (degree)
Fig. 2.15 XRD results of B4-glass and B4-doped 30 wt% ZrO2 sample with different
annealing time. (a) B4-glass at 650oC for 10 min, (b) B4-glass at 650oC for 10 hr, (c) B4-doped 30 wt% ZrO2 sample at 650oC for 10 hr, and (d) B4-doped 30 wt%
III. Ba-glass Ceramic Systems
Currently, glass-ceramics are the preferred materials in these restrict requirements for sealing SOFC stacks. With an effort to develop such a suitable sealant for planar SOFCs, borosilicate, boron-free alkaline earth silicates, and phosphorus silicate had been suggested in many scientific articles for SOFC sealing applications. Because P2O5 not only increases the crystallization tendency in most
silicate glass for the long-term stability concerns, but also the phosphorus silicates exhibit low CTE value of 5-6 ppm/K, too low to be a good candidate. Neither boron-free alkaline earth silicates were considered because of its high viscosities. Consequently, the present work would emphasize on borosilicate glass-ceramics.21
3.1 Experiment of Ba-Glass Preparation
3.1.1. Glass preparation
To prepare a suitable sealing glass, B2O3 and SiO2 were chosen as a glass former.
As Sohn et al. mentioned that B2O3 can decrease the viscosity and crystallization
tendency of glasses. With increasing the B2O3/SiO2 ratio, the CTE of the sealing
glasses also increase22. Other component, BaO, as network modifier, can increase the CTE value and show a better glass formation ability with decreasing phase separation tendency. Al2O3, as an intermediate additive, can prevent rapid
crystallization of a glass during heat-treatment and also to increase the surface tension of glass. 23,24,25
The composition of the glass listed in Table 3.1 were prepared by taking stoichiometric amounts of reagent-grade BaCO3, H2BO3, SiO2, and Al2O3, then
milling thoroughly in a turbo-mixer for 24 h in alcohol (10 vol%).
21 A. Fluegel, “ Sealing Glass-Ceramics for Planar Solid Oxide Fuel Cells Literature
Review,” http://glassproperties.com/sofc/, (2005)
22 S.-B. Sohn, S.-Y. Choi, G.-H. Kim, H.-S. Song, and G.-D. Kim, “Stable Sealing
Glass for Planar Solid Oxide Fuel,” J. Mat. Sci., 297, 103-112 (2002)
23 J. W. Fergus, “Sealants for Solid Oxide Fuel Cells,” J. Power Sources, 147, 46-57
(2005)
24 Gyeung-Ho Kim, Hue-Sup Song, Goo-Dae Kim, “Suitable Glass-Ceramic Sealant
for Planar Solid-Oxide Fuel Cells,” J. Am. Ceram. Soc., 87[2], 254-260 (2004)
25 K. S.Well, J. E. Deibler, J. S. Hardy, D. S. Kim, G. G. Xia, L. A. Chick, and C. A.
Coyle, “Rupture Testing as a Tool for Developing Planar Solid Oxide Fuel Cell Seals, ” J. Mater. Sci. Perm., 13, 316-326 (2004)
Table 3.1 Chemical composition and thermal properties of the glasses used in this work
The mixed batches were melted in an electric furnace at 1300oC for 30 min in a Pt crucible, and then poured onto a graphite plate to form a glass bulk or quenched glass into 25oC de-ionic water. The water-quenched glasses, then, were ground and sieved through 150 meshes in order to obtain fine glass powder.
3.1.2. Glass Characterization
The as-prepared and heat-treated glasses were analyzed by X-ray diffractometry (Philip PW 1972, Philips Instrument, Netherlands) using Cu Kα radiation to confirm
the amorphous nature and crystalline phases of the glass-ceramics.
The measurement of the glass properties that might influence sealing, such as glass transition temperatures (Tg) and crystallization temperatures (Tc), was
performed by using Differential Thermal Analyzer (1600DTA, DuPont Instrument, Germany) with a Pt crucible as the sample holder and α-Al2O3 powder (been calcined
at 1200oC) as inert reference. DTA scans were recorded from room temperature to 1300oC in air with a heating rate of 10oC /min.
The formation of crystalline phases in the glass was investigated by isothermal heat treatment of the bulk samples for 10 hr to 100 hr at 850 oC in an electric furnace holding in air. Phase after the heat-treatment were identified from X-ray diffraction patterns, and the microstructures of the heat-treated sample were observed using scanning electron microscope (SEM, XL30, Philips Co., Holland). Qualitative composition analysis of various phases was carried out using X-ray energy dispersive spectroscopy (EDS, EDAX Co., Germany).
Composition (mol%) Thermal Properties(oC)
Specimen
BaO B2O3 SiO2 Al2O3 B2O3/SiO2 Tg Tc
G0 50 25 25 - 1 534 580/668 /712 G1 50 22 28 - 0.78 554 669/700 G2 50 17 33 - 0.52 556 661/694 G3 50 12.5 37.5 - 0.33 568 668 G4 50 10 40 - 0.25 572 640 G0A5 47.62 23.81 23.81 4.76 1 585 787 G1A10 45.45 20 25.45 9.09 0.78 625 828/1074 /1226
3.1.3 Bonding and Wetting Behavior
YSZ (8 mol% Y2O3-dope ZrO2) was used as a substrate material for bonding and
wetting test. The YSZ plates were prepared by colloidal filtration of the YSZ powder into pellet and sequentially sintering at 1600oC in air for 1 hr.
To examine the bonding characteristic and wetting behavior of the glass to YSZ plate, the glass bulk was put on YSZ plate and continuously heated up to 1100oC at a heating rate of 10oC/min in air. The contact angle is defined as the angle formed by two planes tangential to the liquid (or glass) and solid phase surfaces at the site of contact between the two phases. The change of contact angles at various temperatures was recorded.
3.1.4 Long-term operation stability
In order to investigate long-term stability when the cells operate, the G1A10 glass bulk was aging at the operation temperature, 650oC, and tested by XRD and TMA.
3.1.5 Interface reaction
To investigate the interface reaction between the glass/YSZ and glass/metallic interconnect (Crofer 22), the glass bulk placed on YSZ or Crofer 22 plates were first heated up to 1000oC at 10oC/min and held for 15 min to seal the glass and YSZ/Crofer 22 plates together, then the specimens were cooled down and aging at 650oC for a period of time. After the heat-treatment, the cross section of the specimens was examined using SEM to investigate microstructure change of the interface as a result of long-term treatment.
3.1.6 Bonding Strength
Bonding strength was measured from YSZ and Crofer 22 test bars with nominal depth, width and length of 5×5×20 mm3 adhered by the selected paste, which was dispersed in H2O with 1 wt % PVA. The YSZ to YSZ, Crofer 22 to Crofer 22, and
YSZ to Crofer 22 adhered sample were tested at ambient temperature in air using the four-point flexure test method which is illustrated in Fig. 3.1, according to the recommendation in ASTM test standards C1161.26,27 A displacement rate of 0.01 mm/s was applied in displacement control. A total of 3 test specimens were tested for each different sealing condition.
26 C.A. Lewinsohn and S. Elangovan, in: Solid State Energy Conversion Alliance-Progress in Seals
for Solid Oxide Fuel Cells (2003)
Fig. 3.1 Schematic of 4-point flexure test fixture.
3.2 Results
3.2.1 Thermal Properties of the Glasses
Fig. 3.2 shows the DTA patterns of five glasses and the thermal properties measured from DTA are also summarized in Table 3.1. Fig. 3.3 plots the Tg and Tc
values as a function of composition. It indicates that with a higher B2O3/SiO2 value,
the glass-forming capability in this glass system would be changed, and this implies that the Tg and Tc of the glasses should meet the operation requirements. G1 glass
shows better thermal properties among G0-G4 glasses. Moreover, with the addition of Al2O3, the crystallization of G0A5 and G1A10 could be retarded. The glass-forming
ability and working temperature region would be increased.
Flexural bending
σ
Specimen thickness
t
Specimen width
W
Tensile Strength
P
Standard deviation
S
2
2
)
(
3
Wt
I
L
P
−
=
σ
Fig. 3.2 DTA thermograms of G-series glass determined in air with a heating rate of 10oC/min from room temperature to 1000 oC
Fig. 3.3 Changes in Tg, Tc and Tm values of the G-series glass. The values were
obtained from the DTA thermograms.
In general, the thermal stress developed at the sealed interface is strongly affected by the difference of CTE values between bonded materials and the Tg of the
sealants. When fuel-cell stacks coolrf down to room temperature, stress begins to develop at the sealed interface only as the temperature decreases below the Tg of the
sealants. This might cause severe damage to the stacks. Consequently, the Tg value of
the thermal stress produced at the interface. However, at the same time, the sealant must have adequate rigidity at the cell operating temperature so to prevent the sealant flowing out from the gap of the stacks to pollute the components. Therefore, for SOFCs designed to operate at 650-800oC, a sealant with Tg lower or around 650oC
exhibits adequate rigidity at that temperature. Table 1 reveals that all the Tg of the
glasses prepared meet to the compliant needs. Furthermore, the glass forming range of G1A10 is coincident with IT-SOFC operation temperature range (650-800oC). Therefore, the latter analysis would be focused on the G1A10 glass.
3.2.2 Crystallization Behavior
X-ray diffraction patterns of the as-prepared glasses are shown in Fig. 3.4. Not all the as-quenched G-series glasses were found to be amorphous. But with the addition of Al2O3, the amorphous state of G0A5 and G1A10 would be retained.
Fig. 3.4 XRD pattern of the as-prepared Ba-glasses.
In general, a glass-ceramics with a high degree of crystallization exhibits better mechanical properties than that of glass. Also, the glass-ceramics can have various CTE values depending on the types and volume fraction of crystalline phases in glass matrix. Glass-ceramics generally also show higher chemical stability than the glasses. Therefore, in present work of SOFC operation, the G1A10 glass was heat-treated at 850oC to investigate the crystallization behavior.
Fig. 3.5 shows the X-ray patterns of G1A10 bulk glass heat-treated at 850oC for 10 or 100 hr. The XRD pattern of the G0A5 bulk glass heat-treated for 10 hr at 850oC
also plotted in Fig. 3.5.
Fig. 3.5 XRD patterns of glasses heat-treated at 850oC for 10 and 100 hr to identify the crystalline phase.
For G1A10, according to the Gibbs’ phase rule, four phases would be observed at equilibrium. Compareing the X-ray pattern with the SEM micrographs (Fig. 3.6) and EDS analysis, there existed three crystalline phases and one glass phase, which are hexacelsian (BaAl2Si2O8), monocelsian (BaAl2Si2O8), and barium silicates
(BaSiO3). Their CTE values of these crystalline phases are listed in Table 3.2.
Hexacelsian always precipitates first, and is more compatible with the parent glasses than it’s polymorph, monocelsian, in terms of CTE mismatch. According to this, the crystallization of hexacelsian is desirable for preparing a suitable sealant for SOFCs. But, the platy-like shape of the hexacelsian implies that the thermal expansion is not isotropic which would lead to cracking due to the hexacelsian crystals. In our detail observation, intergranular fractures along the hexacelsian happened and decreased the sealing strength. The fractures were also harmful to gas- tight ability of the seal.
Table 3.2 Crystalline phases and CTE value in G1A1028
Fig. 3.6 SEM micrographs imaged by backscattering of (a)G1A10 heat treated for 100 hr, (b)G0A5 heat treated for 10hr, and (c)G0 heat-treated for 10 hr at 850oC to identify the crystalline phases.
3.2.3 Wetting Behavior of Glasses
Wetting behavior is an important factor that has to take into consideration for A. Chick, and Chris A. Coyle, “Rupture Testing as a Tool for Developing Planar Solid Oxide Fuel Cell Seals, ” J. Mater. Sci. Perm., 13, 316-326 (2004)
Name Composit ion CTE (ppm) Temperature Range (oC) 12.5 20-550 Barium Silicates BaSiO3 9.4 20-1000 Hexacelsian BaAl2Si2O 8 8.0 20-1000 Monocelsian BaAl2Si2O 8 2.7 20-1000
(a)
(b)
(c)
preparing a reliable glass sealant. Since the shape change of glass occurs because of decreasing of the viscosity., which is a function of temperature. According to Table 3.1, G1A10 glass shows a higher Tg value than that of G0 and G0A5 glasses. Fig. 3.7
shows the shape change of three glass bulks: G0, G0A5, and G1A10, placed on the YSZ plate at heating rate of 10oC/min. G0 and G05A glasses with a higher B2O3/SiO2
ratio and lower Al2O3 additive, started wetting at 1050 oC and 1000 oC, but G1A10
started wetting at 800oC. This is because of a crystalline phase growing in G0 and G0A5 at 580oC, which would result in a higher wetting temperature and viscosity.
Fig. 3.7 (a) Shape change of G0,G0A5, and G1A10 glass bulk placed on the YSZ plate with increasing temperature (heating rate of 10oC/min),(b)Contact angle measurements of various glass bulks placed on the YSZ plate with increasing temperature (heating rate of 10oC/min)
Fig. 3.8 shows the more detailed shape change behavior of the G1A10 bulks placed on a YSZ plate with a heating rate of 10oC/min. G1A10 glass is the better sealing material than the others. From the observation, 970oC was the suitable
sealing temperature.
Fig. 3.8 (a) More detailed shape change and (b) Contact angle measurements of G1A10 glass bulk placed on the YSZ plate with increasing temperature (heating rate of 10oC/min)
G0 G1 G0A5 G1A10 8YSZ Crofer 22 9.5 10.0 10.5 11.0 11.5 12.0 C TE ( ppm/K) Glass species
G0 G1 G0A5 G1A10 8YSZ Crofer 22 10.5 11.0 11.5 12.0 12.5 13.0 13.5 14.0 C TE ( ppm/K) Glass species
Fig. 3.9 CTE value of G0, G1, G0A5, G1A10 glass, YSZ, and Crofer 22 when (a) with heating rate of 10oC/min to 600oC and (b) with air cooling from 600oC to room temperature.
3.2.4 Long-term Stability Analysis
Fig. 3.9 plots the CTE value of some glass sealants, and also the YSZ and Crofer 22. When tested in heating cycle, the CTE value of G0A5 is too high to meet that of YSZ, and the other glass sealants, G0, G1, and G1A10, are in the range (9.5-10.4x10⁻⁶/K) between YSZ an Crofer 22. When tested in cooling cycle, only the CTE of G0, G1A10, and G1 glasses are very close (less than 1.0 ppm/K difference) to that of YSZ and Crofer 22.
Fig. 3.10(a) shows the XRD pattern of the G1A10 glass aging at 650oC for 10 to 30 hr. No crystalline precipitates were detected. Fig. 10(b) shows the change of the CTE value of G1A10 aging at 650oC for 10 to 30 hr. As the heat-treatment extended, the CTE value kept in the range of 10 to 13.5 ppm/K. The accuracy of the data is poor, needs more work on this.
0hr 10hr 20hr 30hr 8YSZ Crofer 22 8 9 10 11 12 13 14 CTE (p p m/ K ) Aging time Heat Cool
Fig. 3.10 (a)XRD patterns, and (b) the CTE value of G1A10 glass aging at 650oC for 10 to 30 hr.
3.2.5 Interface reaction between glass and YSZ/Crofer 22
Fig. 3.11 shows the microstructure of the G1A10/ YSZ sealing interface which were heat-treated at 650oC for 10-30 hr after being bonded at 970oC for 15 min. It was apparent that a reaction layer found in the glass next to the sealing interface. Fig. 3.12 shows the microstructure of the G1A10/ Crofer 22 sealing interface which were heat-treated at 650oC for 10 or 50 hr after being bonded at 970oC for 15 min. There also existed a reaction layer at the sealing interface of G1A10/ Crofer 22. Small cracks were found along the plate-shape crystalline phase and the residual glass phase.
Fig. 3.11 SEM micrographs imaged by backscattering of G1A10 (a)aging for 10 hr, (b) aging for 20 hr, and (c) aging for 30 hr at 650oC.
Fig. 3.12 SEM micrographs imaged by backscattering of G1A10/Crofer 22 aging for (a) 10hr and (b) for 50 hr after sealing at 950oC for 10min.
3.2.6 Bonding Strength
Results of bonding strength testing were shown in Table 3.3 The strength of the as sealed sample (10-12 MPa) is still too low to withstand the thermal stress during operation. Observing the morphology of the fractured sample, there existed lots of gas pores within the glass, and leading to low bonding strength.
From the fracture morphology of the adhered samples, there existed lots of gas pores and leading to low bonding strength. In order to decrease the amounts of the pores, using the glass tape instead of brushing the glass paste to seal the sample would
(a) (b)
(c)
be a good resolution.
Table 3.3 Bonding strength results of the test specimens as sealed at 970oC and heat-treated at 650oC YSZ to YSZ as sealed at 970oC Crofer 22 to Crofer 22 as sealed at 970oC YSZ to Crofer 22 as sealed at 970oC YSZ to Crofer 22 970oC aging for 5 hr Flexure strength (MPa) 10.88 10.08 12.4 9.66
IV. Leakage Rate Measurement of Glass G1A10
Another important characteristic of these sealing glass systems is the leakage rate as it is used to seal the gaps between SOFC components. It determines whether the SOFC is reliable or not for short or long-term applications. This subject includes two parts which are shown below:
¾ Leakage test device designing ¾ Leakage rate measurement 4.1 Design of Leakage Test Device
The equipment is totally made by S420 stainless steel in the causes of good oxidization resistance and good coefficient of thermal expansion (CTE) matching with 8YSZ, glass sealant and interconnect (Crofer 22APU). Fig. 4.1 shows the AutoCAD diagram of the device, and the assembly diagram is also shown in Fig. 4.2.
4.2 Leakage Rate Measurement
We have completed the leakage test of the G1A10 glass at the temperatures at 25oC and 600oC. The leakage rate is calculated by the following equation [29]:
) / ( ) ( cm sccc tC P V P P L f f i Δ − = ………(4.1)
Where L is the leakage rate, Pi is the initial pressure, Pf is the final pressure, V is the
volume of the gas reservoir, t is t△ he time elapsed as the pressure decreases from Pi to Pf, and C is the circumferential length of the sealant.
According to the latest literature review [30,31,32,33], most of leakage tests are operated below 0.2 bar for the sake of being closer to the operating pressure of a SOFC.
4.2.1 Test Sample Preparation
The test samples included a piece of disk-shaped 8YSZ, a piece of Crofer 22 and
29 S. Le, K. Sun, N. Zhang, Y. Shao, M. An, Q. Fu, X. Zhu, J. Power Sources, 168 (2007) 447–452
30 Y.-S. Chou, J. W. Stevenson , R. N. Gow, J. Power Sources, 170 (2007) 395–400.
31 Y.-S. Chou∗, J. W. Stevenson, J. Power Sources, 135 (2004) 72–78
32 R. Wang, Z. L¨u, C. Liu, R. Zhu, X. Huang, B. Wei, N. Ai, W. Su, J. Alloys and Compounds, 432
(2007) 189–193
33
5 ml of G1A10 glass paste. Disk-shaped 8YSZ has been sintered at 1500oC to full density and had the diameter of 15.1 mm. The G1A10 glass paste consists of 2.2 g G1A10 glass powder, whose mean particle size was 10 μm, and 2.2 g 99.5% ethanol. Crofer 22 was cut into the size of 2×2×2 cm3, with an additional hole (5 mm in diameter) at the center.
4.2.2 Flow Chart of Joint
4.3 Results
The leakage rate of G1A10 glass sealant at ambient temperature is shown in the Fig.4.3.
Clean sample by ultrasonic cleaner
Print glass paste on the joint surface
Pre-heat the furnace to 970oC
Put sample into the furnace and hold for 15 minutes.
Cut off the heater power and take out the sample after being cooled in furnace.
Anneal sample at 650oC for 10 min, then cool it in furnace.
The leakage rate of glass sealant is tested with pure nitrogen gas at different over-pressures, and the system has a background leakage of 3.0 × 10⁻⁴ sccm cm-1. The
Fig. 4.3 The leakage rate at room temperature
room temperature test result is shown in Fig 4.3. The leakage rate has the lowest value (0.03 sccm cm-1) at the over-pressure below 0.25 bar and the highest value (0.06 sccm cm-1) at the pressure of 1.0 bar,
The leakage rate at 600oC is shown in Fig 4.4. Surprisingly, the leakage rate at 600oC is between 0.028 sccm cm-1 and 0.018 sccm cm-1 which isbetter than that at room temperature. And the leakage rate at 600oC shows high consistency at different over-pressures.
According to the literatures, the best leakage rate result of glass-ceramic sealant is 5 ×10⁻⁶ sccm cm-1 [4], while the compressive sealant has the best record of 5 ×10⁻⁴ sccm cm-1 [3]. Apparently, we need much more efforts on the development of better sealing glass. But in the view of engineering aspect, a fuel leakage percentage of 0.6% is acceptable for SOFC sealing requirement [1]. In the case of our self-manufactured SOFC equipment, which has a sealing length of 34 cm, the maximum fuel lose will be 0.95 sccm at 600oC and a over-pressure less than 1.0 bar. If we set the fuel flow rate at 500 sccm then the fuel loss will be only 0.19%.
V. Conclusions
Bi2O3-ZnO-SiO2-B2O3 glass system shows a good wetting on sintered YSZ plate.
Bi2O3 diffused slightly into YSZ along the grain boundary at 650oC and the Bi-species
did not apparently react with YSZ. Zn2SiO4 segregated at the interface next to YSZ to
form a barrier layer and prevent Bi2O3 diffusion. The crystallization and Bi diffusion
can enhance the bonding strength in joining to YSZ, but not to Kovar. Bi-oxide based glass reacted with Kovar seriously and caused a weak interface.
A significant creeping behavior of B4 and P1 glass ceramics was observed, which might perform a self-healing of cracks. Viscosity of residual glass was calculated in the range of 105 Pa*s. B4-glass has several advantages such as good wetting behavior, easy formation, better creep behavior and suitable Tg as an SOFC
sealant better than lead-glass system. The disadvantage of B4-glass is low CTE value which decreases with crystallization. A 10-30 wt% ZrO2-dopant could increase the
CTE of glass-ceramic and prevent cracks formation. Table 4.1 summarizes the differences of P1 and B4 glasses.
The glass-ceramics sealants based on BaO-SiO2-B2O3 with Al2O3 addition have
been developed to meet the requirements for planar solid-oxide fuel cells. The thermal properties of the G-series glasses and the wetting behavior revealed that the glass forming range and the fluidity of the glass were strongly influenced by the B2O3/SiO2
ratio. Also the crystallization can be retarded by addition of Al2O3.For the concerns,
G1A10 glass is the most probable sealant for planer SOFC operating at 650-800oC. Three main crystalline phases in G1 glass would precipitate along the interface of YSZ/amorphous glass matrix, including BaSiO3, monocelsian, and hexacelsian.
Hexacelsian has a CTE value of about 8 ppm/K which is more compatible with YSZ than monocelsian, which has a CTE value of 2.7 ppm/K. Because of the plate-liked shape of the hexacelsian grains, its CTE value is not isotropic. Therefore, the change of preventing the formation of monocelsian phase and shortening the aspect ratio of hexacelsian grain are the important issues in future work.
From the cross-sectional morphologies of the glass sealing with YSZ or Crofer 22, there existed a crystalline layer at the interface. The interfacial phase may lead to a thermal expansion mismatch and induce thermal stresses. Not only fine cracks were formed along and inside the crystalline phase, but also a gap was formed between the parent glass and the reaction layer. This would degrade the long-term stability of the sealants.
G1A10 glass is a kind of good sealant for SOFC, which is demonstrated having a acceptable leakage rate for the common SOFC which is operated at the over-pressure lower than 1.0 bar. But the higher the operating pressure is, the higher the efficiency of the SOFC will be.
Table 5.1 Comparisons of no. P1 glass and B4-glass.
Parameters P1-glass B4-glass
Basic material properties
Composition with lead lead-free
Porosity of open-pore after 650oC 10 hr 67% 87%
Ratio of B2O3/SiO2 in formulation 2.15 0.25
Thermal properties
Glass transition temperature (Tg) 360oC 450oC
Melting point (Tm) 600oC 900oC
CTE of glass 9.1 ppm/K 11.9 ppm/K
CTE after 650oC 10 hr (quenched) 9.1 ppm/K 4.1 ppm/K
Crystalline phases
Crystalline phases at 650oC 4 kinds 4 kinds
Interfacial properties
Interface reaction Significant,
PbZrO3 phase
Unobvious, only reacted with impurity at grain
boundary
Diffusion profile after 650oC for 10 hr 20 μm 15 μm
Interface attacked at 650oC for 10 hr Seriously Slightly Diffusion path lattice and grain
boundary
Via. grain boundary
Self-barrier formation No Yes, Zn2SiO4
Electrical Conductivity
VI. 計畫成果自評
兩年的研究工作共合成兩個系列的玻璃陶瓷材料,並與一鉛系
列的低溫玻璃相比較。除原使用之金屬(不鏽鋼及 Kovar)因抗氧化性
不佳,改為 Crofer 22,其他規劃之工作項目及目標
均符合原計畫內容
。
原研究內容規劃三個主題,第一是合成低熔點玻璃,用於固性封
裝或柔性封裝,量測並報導兩種玻璃之性質,包括軟化點、潤濕性、
電絕緣性等。第二是分析探討不同材料與封裝玻璃之界面反應現象。
第三主題是探討玻璃系統的封裝特性,我們將在室溫及高操作溫度
下,將不同材料疊層之組合進行氣體洩漏率及玻璃強度之測試。相關
的界面反應動力及分子擴散機制也予以深入探討。
研究成果已整理出兩篇論文,一篇玻璃陶瓷材料方面之專利
,
前者將投稿國際型期刊,後者將伸請國內及國外專利。此外,後續仍
有相關之主題值得繼續進行(見 96 年度研究計畫)。
赴德國研究報告
The Report of Investigation in Germany
主題:固態氧化物燃料電池之封裝玻璃選擇、特性分
析與高溫潛變之研究
The Study of Material Selection, Characters
Analysis and High temperature Creeping
Behavior of Sealing Glass for SOFC
報告人:陳右儒
指導教授:韋文誠 教授 and Andreas Roosen 教授
研究地點:Friedrich-Alexander-University, Erlangen- Nurnberg
Abstract
The investigation at Friedrich-Alexander-University, Erlangen-
Nurmberg focused on the sealing material selection, creep behavior, viscosity
variation and the composition analysis. Treated samples with different heat
treatment conditions, and discussing the variation of glass phase content to creep
behavior. There are some problems in G1 serial glass which was reported. In this
investigation also tried to adjust the composition to modify the system to reach
suitable sealing properties for SOFC.
I. Introduction
Glass is the most suitable material as a sealant for SOFC. There are several requirements in mechanical, chemical and electrical aspects for the selection of a suitable glass sealant. Three properties are very fundamentals for the glass. One is the glass transition temperature (Tg)
and the other is the coefficient of thermal expansion (CTE) of the glass-ceramics. The glass transition temperature is important to allow flowing to maintain gas tight. The coefficient of thermal expansion (CTE) must match other cell components, such as the yttria-stabilized zirconia (YSZ) electrolyte and the interconnect material, to minimize thermal stresses. Finally, the electric resistivity of the glass-ceramics should better be than 106 ohm/cm.
Sealing glasses are categorized to two classes. One is compliant glass; the other is rigid glass. Previous one has the Tg (glass transition temperature) lower than the service temperature
(Ts), therefore, shows slightly creeping at the service temperature. The rigid glass can not creep;
therefore, it should have a full match of thermal expansion coefficient (CTE) with the solid electrolyte. The glass in this study will only develop the compliant glass due to the technical consideration on the CTE.
Viscosity is one of the important properties of a glass-ceramics. Creeping and interfacial reactions are also two major causes for the degradation of sealing glass at service temperature. The property is depending on temperature and compositional, especially at temperature above glass transition temperature [Rawson, 1980]. It was reported that glass can be deformed by external pressure above the glass transition temperature, which is more time-dependent [Koide et al., 1996]. Beside interactive time and temperature, inclusions and degree of crystallization are also affected the viscosity of a glass [Heymann et al., 1995].
After measuring the viscosity of glass, it is possible to predict crystallization tendency and the creep behavior of glass. So the purpose of this experiment to Germany is to measure the viscosity of three glass-ceramics systems, Bi-Zn-B-Si oxide glass, Ba-B-Si oxide glass, and Ba-Si-B-La oxide glass, so to understand how the crystallization affects the rheology of glass. So there are four main tasks listed below.
• Investigate the relationship of rheological properties as a function of glass fraction:
2. Analyze the rheology (creep behavior) of the samples with different glass fractions; 3. Measure the fraction of residual glass phase in annealed samples from SEM
micrographs.
• Analyze the glass composition by ICP.
• Determine the coefficient of thermal expansion of glasses (B4, G1 and G1+La). • Conduct one High temperature XRD (B4 10 hr).
2.
Experimental procedure
Fig. 1 shows the experiential procedure flow chart. We have four kinds of glass systems in this investigation listed in Table 1.
Table 1 Glass composition and thermal properties in this investigation. Composition Tg (oC) Tm (oC)
G1 50BaO-22B2O3-28SiO2 550 950
G1-5L 50BaO-22B2O3-28SiO2-5La2O3 560 890
G1-10A 50BaO-22B2O3-28SiO2-10Al2O3 650 1200
B4 30Bi2O3-20ZnO-10B2O3-40SiO2 450 930
Glass melting and casting glass bulk
Cut the sample into small size for TMA
650oC heat treatment with
different holding time High temperature viscosity
measurement (TMA)
SEM observation to observe the residual glass
phase
Program analysis of the residual glass phase Glass powder
pressed into pellets
Treated at Tg to make
enough strength for cutting
Fig. 1. The flow chart of experimental procedure in this investigation.
The first step in this investigation is glass casting. Because porosity will affect the creep behavior and thermal expansion coefficient, it is better to use a dense sample for analysis. An SEM was employed to observe the microstructure of these casting samples. The second step is wetting behavior measurement. A glass with a good wetting on YSZ sintered plate is needed.
It is easy to measure the residual glass phase by computer program. Image-C is a kind of microstructure analysis program. Using this program the can calculate the residual glass phase in SEM image. In this part, each condition was calculated by 15 pictures and gets an average value.
The fourth part is the most important part in this investigation. Three types of samples were employed for creep investigation list below.
• Casting glass bulk, it is a dense glass bulk without porosity. We made these samples by glass casting into graphite mold with air and annealing at 300oC for 1 hr.
• Using sandwich sample (YSZ/glass/YSZ) for investigation. These samples were made by painting glass paste between two YSZ sintered bulks, and melt the glass at its melting temperature for 15 min then quenched in the air. The paste was made from glass powder and de-ionized water with 1wt% PVB.
After measuring the creep behavior with different loading by TMA, the data can be analyzed by two models so to calculate the apparent viscosity (the viscosity included crystals). We will discusse in next chapter.
Samples for coefficient of thermal expansion measurement, ICP (Inductively Coupled Plasma) compositional analysis, and high temperature XRD were prepared in Taiwan and analyzed at Erlangen.
3.
Theory and theoretical models
The shear viscosity is most defined in terms of the flow situation shown in Fig. 2. There are several kinds of methods to measure the viscosity of glass. In this investigation, a parallel plate method was employed.
Fig. 2. Model indicating viscous flow and definitions of shear stress, shear rate, and coefficient of viscosity [Reed, 1995].
There are two kinds of model to calculate the viscosity. One is just for high content glass material. It uses a circular disc of glass, which is sandwiched between two refectory ceramic plates. The change in distance between the plates when a force is applied. Viscosity of corresponding glass, η, are calculated from the measured strain rate according to the formula [ Kumar et al., 2005] ⋅ ⋅ = + = ε σ ε υ σ η 3 ) 1 ( 2 ………..………...………...…….(1)
where σ is the applied stress. The unit of σ is Pa. ε⋅ is the minimum strain rate measured during creep tests and υ is the Poisson’s ratio of glass bulk. The viscosity range in 104-108 Pa‧s can be measured by this parallel plate method [Rawson, 1980].
In general, viscosity is affected by temperature. The temperature dependency of viscosity can be described and calculated by Arrhenius equation [Rawson, 1980]:
) exp( ) ( RT E T η η = ………..………..………….(2)
The degree of crystallization in the glass also affects the viscosity. It changes with the amount, size, shape of crystals, which has been described as below [Boccaccini, 1998 & Kumar et al., 2005]:
m f ) 1 ( 0 − =η η ……….(3) 3 2 3 (1 2 ) F m F F − = − ………...(4)
Where η0 is the viscosity of the glass, f is the volume fraction of the crystals (inclusions) and m
is constant, a function of the shape of crystals. F is the shape factor.
The other method is suit for ceramic system (less content of glass). In this condition, Maxwell element descriptions (both elastic and viscous behavior) shown in Fig. 3 will be more suitable to calculate the viscosity. It can be imagined that there are spring and viscose in the bulk [Cai et al. (1997)].
Fig. 3. The schematic diagram of Maxwell element Equation shows below is the general solution of Maxwell element.
………(5) Differentiating the ε(t) expression in above equation with respect to time, one obtains
……….(6) εl is the strain rate under the load and εf is the strain rate without the load. Then we can get
viscosity vs. temperature relation diagram.
4.
Results and discussion
The results of G1 system
Casting G1 glass is hard to get a pure glass (without crystallization). Fig. 4-(a) shows the microstructure of as-cast G1 glass. There are a large amount of crystals inside. This might be caused by a rapidly crystallization during glass casting. Fig. 4-(b) shows the lower magnification of as-cast G1 glass. The formation of cracks is due to low strength and is hard to made TMA sample. Both of conditions with annealing at 300oC and without, G1 glass still show a rapidly crystallization.
Fig. 5 shows the wetting behavior of G1-cast glass. The melting point of G1 glass is 950oC, but there is no wetting behavior for the glass-ceramics. Casting method can’t form a pure glass for SOFC application. The residual glass in Fig. 4-(a) is less than 1.5% measured by Image-C program.
Sandwich sample of YSZ/G1/YSZ also have the same problem. Rapidly crystallization was observed in Fig. 6 and Fig. 7. After holding at 650oC for 10 min (Fig. 6) and 1 hr (Fig. 7), the state of crystallization have no significant change. The average size of these crystals is 21 μm, and the thickness of glass-ceramic layer is 100 μm.
Fig. 4. (a) The microstructure of as-cast G1 glass. It shows a large amount of crystals in the bulk. (b) The lower magnification image of as-cast G1 glass.