ii
國
立
交
通
大
學
資訊科學與工程研究所
碩
士
論
文
探 討 模 擬 駕 駛 平 台 上 事 件 相 關 之 腦 波 動 態 變 化
Event-Related Brain Dynamics
During Simulated Driving on a Motion Platform
研 究 生:李昂穎
指導教授:林進燈 教授
范倫達 教授
iii
探 討 模 擬 駕 駛 平 台 上 事 件 相 關 之 腦 波 動 態 變 化
Event-Related Brain Dynamics During
Simulated Driving on a Motion Platform
研 究 生:李昂穎 Student:Yang-Yin Lee
指導教授:林進燈 Advisor:Chin-Teng Lin
范倫達 Lan-Da Van
國 立 交 通 大 學
資 訊 科 學 與 工 程 研 究 所
碩 士 論 文
A ThesisSubmitted to Institute of Computer Science and Engineering College of Computer Science
National Chiao Tung University in partial Fulfillment of the Requirements
for the Degree of Master
in
Computer Science September 2009
Hsinchu, Taiwan, Republic of China
iv
探討模擬駕駛平台上事件相關之腦波動態變化
學生:李昂穎
指導教授:林進燈 博士
范倫達 博士
國立交通大學資訊科學與工程研究所
中文摘要
許多駕駛人曾表示在長時間、單調的駕駛環境下有打瞌睡的情況,開車打瞌睡更在 每年都造成車禍及傷亡。駕駛者如果不對於路上的突發狀況做出反應的話,交通事故的 發生往往在幾秒鐘,甚至不到一秒內發生。本論文的目的在研究駕駛員從清醒至打瞌 睡,對於發生車輛偏移事件之前、中及後的腦波動態變化過程,以及動態刺激對於駕駛 者的腦波的影響。實驗上以虛擬實境的方式模擬夜間高速公路且單調之駕駛環境,受測 者須將車輛維持在指定車道中,並在車輛發生隨機向左或向右偏移時轉動方向盤將車輛 拉回指定車道。實驗分成兩部份,第一部分在靜態的模擬平台下實驗(平台不動),第二 部分延續第一部分的設定,但使用動態平台,車輛會隨著方向盤的轉動及偏移做出對應 的翻轉或傾斜,以提供駕駛者適當的動態刺激。在腦波訊號處理上使用獨立成分分析 (independent component analysis)及時頻分析(time-frequency analysis)。實驗結果可觀察到駕駛者的腦波從清醒至打瞌睡在偏移事件發生前在頂葉及枕葉的alpha 波有強直
(tonic)方向的明顯變化;在平台動與不動的實驗上,轉動方向盤開始之前到結束之後在 頂葉、枕葉及體感覺運動區(somatomotor)的 alpha 及 beta 波上皆有發現到能量的抑制 (suppression),或者稱事件相關非同步(event-related desynchronization);在停止轉動
v (rebound),或者稱事件相關同步(event-related synchronization);而在平台動的情況 下,事件相關非同步及事件相關同步的能量變化都比平台不動還要大。我們希望經由本 論文對於開車之事件相關腦波動態變化上的基礎研究,來提供發展安全駕駛偵測系統上 必要且足夠的資訊。 關鍵詞:開車打瞌睡、動態刺激、腦電波、獨立成份分析、事件相關頻譜擾動、事件相 關能量、alpha 律動、beta 律動、theta 律動
vi
Event-Related Brain Dynamics During
Simulated Driving on a Motion Platform
Student: Yang-Yin Lee Advisor: Dr. Chin-Teng Lin
Dr. Lan-Da Van
College of Computer Science
National Chiao Tung University
Abstract
Many drivers have reported that they became drowsy after long hours of driving in a monotonous environment. Driving while drowsy has resulted in crashes and injuries every year. Accidents could occur in a matter of seconds or less if the driver does not promptly respond to sudden events on the road. The first aim of this thesis is to investigate the electroencephalogram (EEG) activities before, during and after lane departure events from alertness to drowsiness during continuous driving. The second aim of this thesis is to study the influence of kinesthetic stimuli on EEG patterns. The event-related lane departure paradigm was implemented in a virtual reality based driving simulator on a motion platform. Subjects were required to compensate for the randomly generated lane departures in order to maintain the vehicle in the cruising lane. Each subject participated in two experimental conditions. In the motionless condition, the motion platform was inactive. In the motion condition, the motion platform simulated kinesthetic stimuli during the lane departure event. EEG data were analyzed with independent component analysis (ICA) and time-frequency analysis.
vii
The results show tonic increase in alpha-band power in occipital and parietal clusters before deviation onset as reaction time increased. Between response onset and offset, suppression or event-related desynchronization (ERD) in alpha and beta band power occurred in the somatomotor, parietal, and occipital regions in both motion and motionless conditions. Following the response offset, significant rebound or event-related synchronization (ERS) in alpha and beta band occurred in the parietal, occipital, and somatomotor clusters. The strength of ERD and ERS was stronger in the motion condition than that in the motionless condition. These results may provide necessary foundations for the development of a driving assistance system in the real world.
Keywords: drowsy driving, kinesthetic stimuli, electroencephalogram (EEG),
independent component analysis (ICA), event-related spectral perturbation (ERSP), event-related power, alpha rhythm, beta rhythm, delta rhythm
viii
誌 謝
對於這份論文的完成,首先我要感謝我的父母,沒有他們生我養育我的話,我不會 有這個機會來完成這份論文,並且也對於他們在我研究所期間所提供的資源讓我能夠不 去煩擾生活上的瑣事再次的表達由衷的感謝。 然後我要感謝我的指導老師林進燈教授和范倫達教授,在研究上提供了豐富的研究 資源和實驗環境,並指導著我的研究。在這裡也要特別感謝美國加州大學聖地牙哥分校 的黃瑞松博士,黃博士在我的研究中提供了許多重要且寶貴的意見,並且細心的從旁協 助指導著我,仔細檢查著每一個分析步驟,對於我論文的完成有莫大的幫助。也感謝實 驗室的柯立偉博士、曲在雯教授及美國加州大學聖地牙哥分校的鍾子平老師、段正仁老 師,除了給予我研究上許多實用的建言外,在研究結果的詮釋上也提出不少建議,並指 出我的錯誤。也特別感謝實驗室的陳青甫學長,除了對於我在實驗上的許多幫助外,在 資料分析上更是提供了許多重要的指導。對於實驗室的騰毅學長、仲良學長、明達學長 和 Frank 所給予在進入這個領域上的幫助也由衷的感謝。 另外也很感謝實驗室其他全體成員:世安、尚文、德正以及君玲等學長姐;也感謝 俞凱、華山、建安、馥戍、睿昕、書彥等同學在我碩班兩年間無論是學業上、研究上、 或是生活上,都提供我很多的幫助,大家同甘共苦,相互扶持與鼓勵;我也要感謝敬婷、 謹譽、人慈、佳琳等學弟妹在過去這一年中的相伴,以及感謝實驗室助理 Jessica 與 Nao 在許多事務上的幫忙以及陪伴。最後特別感謝政大的林怡芬小姐,分擔了我許多研究上 的苦難與挫折,並陪伴我度過了許多的低潮。 謹以本文獻給我親愛的家人與親友們,以及關心我的師長,願你們共享這份榮耀與 喜悅。ix
Contents
Chapter 1 Introduction ... 1
1.1. Drowsy Driving ... 1
1.2. EEG Studies on Drowsiness and Driving ... 2
1.3. The Kinesthetic Perception on a Dynamic Driving Simulator ... 3
1.4. Aims of this Thesis ... 3
Chapter 2 Materials and Methods ... 5
2.1. Event-Related Lane Departure Paradigm ... 5
2.2. 3D Virtual Reality Based Driving Simulation Environment ... 6
2.3. Subjects ... 9
2.4. EEG Recordings and Experimental Procedures ... 9
Chapter 3 Data Analysis ... 12
3.1. Analysis of Driving Performance ... 13
3.1.1. Remove Abnormal Driving Trajectory ... 13
3.1.2. Reaction Times ... 14
3.2. Data Preprocessing ... 15
3.3. Independent Component Analysis (ICA) ... 15
3.4. Event-Related Spectral Perturbations (ERSPs) ... 18
3.5. Event-Related Power Analysis ... 21
3.6. Component Clustering ... 23
Chapter 4 Results ... 25
4.1. Behavioral Performance ... 25
4.2. Independent Component (IC) Clustering and Source Localization ... 27
4.2.1. The Left Somatomotor Cluster ... 27
4.2.2. The Parietal Cluster ... 28
4.2.3. The Occipital Midline Cluster ... 29
4.2.4. The Bilateral Occipital Cluster ... 30
4.3. Brain Dynamics of Four IC Clusters ... 31
4.3.1. The Left Somatomotor Cluster ... 31
4.3.2. The Parietal Cluster ... 35
4.3.3. The Occipital Midline Cluster ... 39
4.3.4. The Bilateral Occipital Cluster ... 43
Chapter 5 Discussions ... 47
5.1. Tonic Changes in Baseline EEG Power Spectra ... 47
5.2. Event-Related Delta Power Increase ... 48
x
5.4. Event-Related Synchronization (ERS) ... 52
Chapter 6 Conclusions ... 53
xi
List of Figures
Fig. 2-1 Illustration of the event-related lane-departure paradigm [22]. ... 6
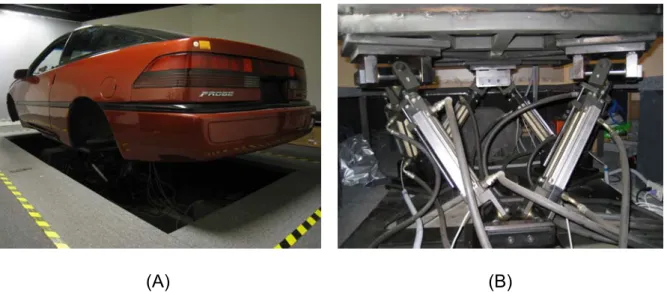
Fig. 2-2 (A) A wide view of the 3D virtual reality surrounding driving environment [17]. (B) A snap shot of the driving scene in the experiment. 7 Fig. 2-3 (A) The car frame (Ford Probe) of driving simulator. (B) The Stewart platform under the car frame. ... 8
Fig. 2-4 Illustration of x, y, z, pitch, roll, and yaw on a driving simulator. ... 8
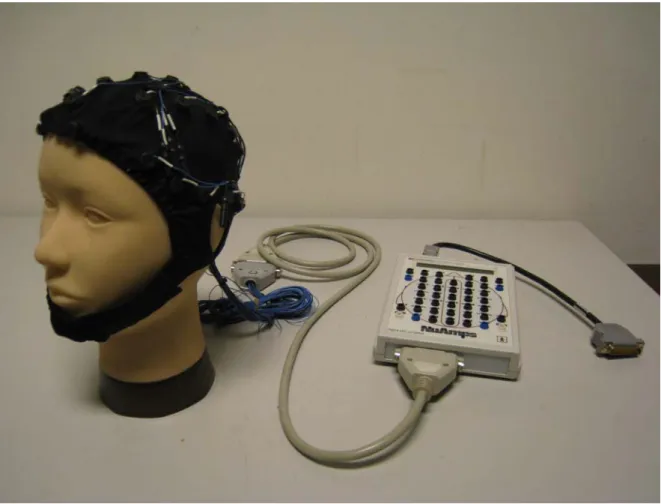
Fig. 2-5 The electro-cap and the Scan NuAmps Express system. ... 10
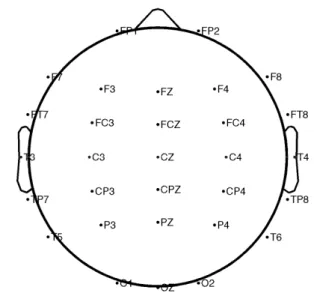
Fig. 2-6 The channel locations used in this study. ... 11
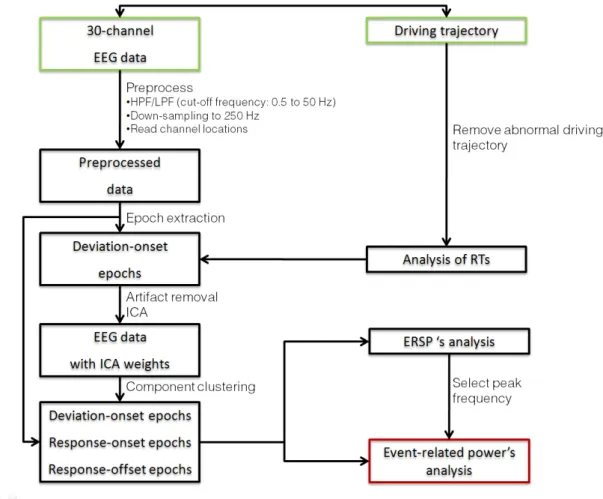
Fig. 3-1 The flowchart of data analysis procedures... 12
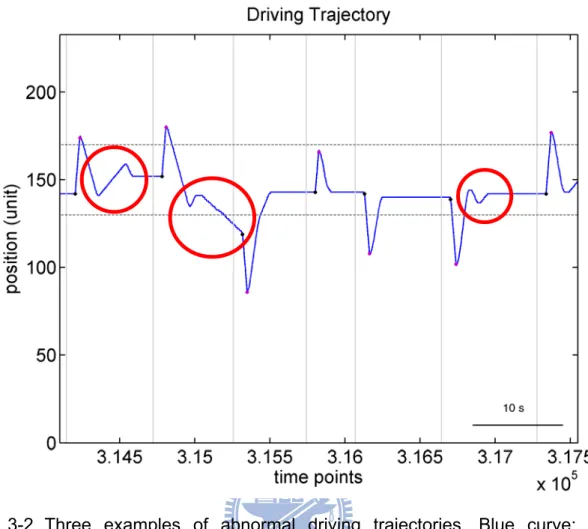
Fig. 3-2 Three examples of abnormal driving trajectories. ... 14
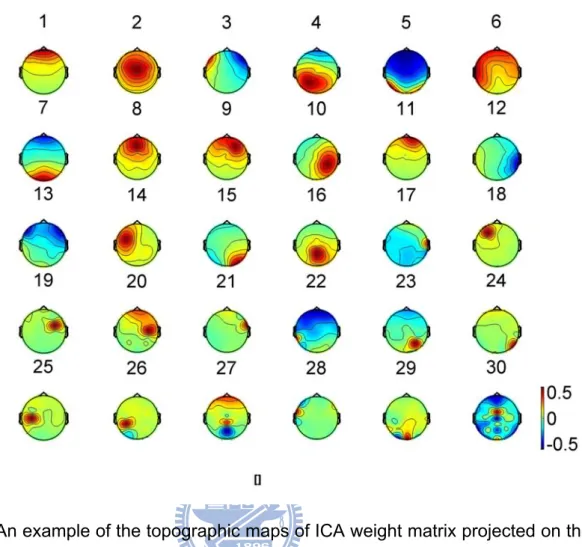
Fig. 3-3 An example of the topographic maps of ICA weight matrix projected on the scalp. ... 18
Fig. 3-4 The flowchart of ERSP analysis. ... 20
Fig. 3-5 The flowchart of ERSP analysis II. ... 20
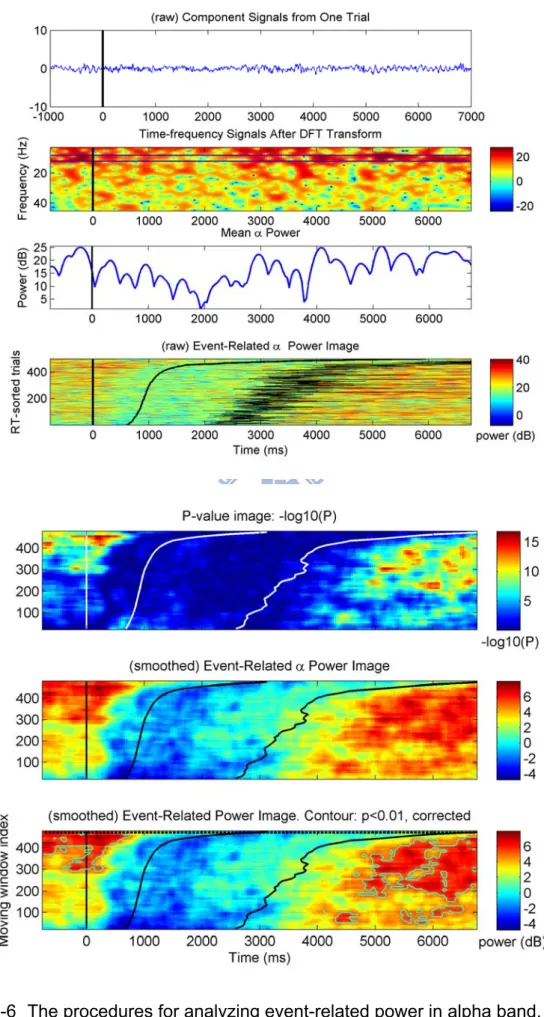
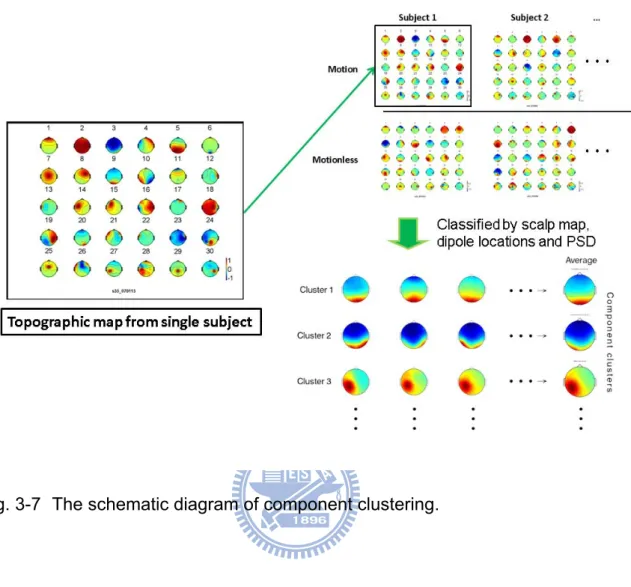
Fig. 3-6 The procedures for analyzing event-related power in alpha band. 22 Fig. 3-7 The schematic diagram of component clustering. ... 24
Fig. 4-2 The grand mean of the scalp maps (upper panels) and their equivalent dipole source locations (lower panels) of the left somatomotor IC clusters in motionless (left panels) and motion (right panels) sessions.. ... 27
Fig. 4-4 The grand mean of the scalp maps (upper panels) and their equivalent dipole source locations (lower panels) of the occipital midline IC clusters in motionless (left panels) and motion (right panels) sessions. 29 Fig. 4-5 The grand mean of the scalp maps (upper panels) and their equivalent dipole source locations (lower panels) of the bilateral occipital IC clusters in motionless (left panels) and motion (right panels) sessions. 30 Fig. 4-6 ERSP images of motionless (upper panel) and motion (lower panel) conditions of the left somatomotor cluster. ... 31
Fig. 4-7 The event-related alpha-band power images, time-locked to (A) deviation onset, (B) response onset and (C) response offset, of motionless (upper panels) and motion (lower panels) conditions of the left somatomotor cluster.. ... 32
xii
Fig. 4-8 The event-related delta-band power image of motionless and motion conditions of the left somatomotor cluster ... 33 Fig. 4-9 The event-related beta-band power images of motionless and
motion conditions of the left somatomotor cluster. ... 34 Fig. 4-10 ERSP images of motionless and motion conditions of the parietal cluster.. ... 35 Fig. 4-11 The event-related alpha-band power images of motionless and
motion conditions of the parietal cluster ... 36 Fig. 4-12 The event-related delta-band power images of motionless and
motion conditions of the parietal cluster. ... 37 Fig. 4-13 The event-related beta-band power images of motionless and
motion conditions of the parietal cluster. ... 38 Fig. 4-14 ERSP images of motionless and motion conditions of the
occipital midline cluster. ... 39 Fig. 4-15 The event-related alpha-band power images of motionless and
motion conditions of the occipital midline cluster. ... 40 Fig. 4-16 The event-related delta-band power images of motionless and
motion conditions of the occipital midline cluster. ... 41 Fig. 4-17 The event-related beta-band power images of motionless and
motion conditions of the occipital midline cluster ... 42 Fig. 4-18 ERSP images of motionless and motion conditions of the
bilateral occipital cluster. ... 43 Fig. 4-19 The event-related alpha-band power images of motionless and
motion conditions of the bilateral occipital cluster. ... 44 Fig. 4-20 The event-related delta-band power images of motionless and
motion conditions of the bilateral occipital cluster. ... 45 Fig. 4-21 The event-related beta-band power images of motionless and
motion conditions of the bilateral occipital cluster. ... 46 Fig. 5-2 The event-related delta-band power images of motionless and
motion conditions of the frontal cluster. ... 49 Fig. 5-3 The event-related delta-band power images of motionless and
motion conditions of the central cluster. ... 50 Fig. 5-4 The event-related delta-band power images of motionless and
xiii
List of Table
Table 4-1: List of subjects and numbers of ICs in motion and motionless conditions. ... 26
1
Chapter 1 Introduction
1.1. Drowsy Driving
Driving is a daily activity for most people in the modern society. Driving while drowsy is dangerous and often leads to accidents [1][2][3]. The National Highway Traffic Safety Administration (NHTSA) estimates that 100,000 police-reported crashes are caused by drowsy drivers each year, resulting in an estimated 1,500 deaths, 71,000 injuries and $12.5 billion in financial losses in the United States. Two of the potential causes of drowsiness-related crashes include: (1) inattention to deviation of the vehicle due to slippery road surface or slight change in steering wheel angle, and (2) not maintaining appropriate distance from other vehicles on the road. In addition, many studies have showed that drowsiness-related crashes often took place during night-time [4], monotonous driving environment [5], or after long hours of driving [6]. Therefore, developing drowsiness detection systems is essential for driving safety.
Several image-based methods have been proposed to monitor the status of the driver or the vehicle. For example, visual cues including eyelid movement, face orientation, and gaze movement (pupil movement) were used to monitor the driver’s vigilance levels [7]. Lane departure warning system (LDWS) or driver assistance system detect lane marking (boundaries) from the video and provide auditory feedback when the vehicle is about to drift off the lane [8][9]. However, monitoring the driver’s status from the video may be affected by changes in ambient illumination and head/body positions or movements. Furthermore, the effectiveness of LDWS is greatly reduced during poor weather conditions or due to unclear lane marking. Physiological based detection methods, such as electrooculogram (EOG), may be used to detect the driver’s vigilance levels [10]. However, EOG is an indirect measurement of vigilance level and the correlation between EOG and drowsiness is
2
low. Some studies used electromyogram (EMG) to detect the driver’s hand movements [11]. However, EMG is seldom used to detect drowsiness.
1.2. EEG Studies on Drowsiness and Driving
Electroencephalogram (EEG) is one of the most direct and effective physiological measures of arousal states. Changes in EEG power spectra could be used as an indicator for alertness levels. An early EEG study showed increased occipital theta (4-7 Hz) activities as the task performance degraded [12]. Several recent studies have demonstrated the relation between EEG characteristics (e.g., power spectra) and driving performance. Lal and Craig reported an increase in slow wave (theta and delta [0-4 Hz]) activities during fatigue in simulated driving [13]. Schier showed increases in alpha (8-12 Hz) activities during the later laps and replay of simulated driving experiments using the ‘Need For Speed’ PC-game [14]. Campagne et al. showed significant power increases in alpha and theta bands that were highly correlated with the number of running-off-the-road incidents and increase in speed variations [15]. Horne and Baulk showed a correlation between EEG activities in alpha and theta bands and the number of incidents (defined as a car wheel crossing the lateral lane marking) [16]. Lin et al. showed the driving error was positively correlated with EEG log power spectra in the sub-band (< 20 Hz) range [17]. These studies provided the fundamental link between EEG power spectral activities and drowsiness during simulated driving. However, most studies compared the overall EEG power with the mean driving performance in a time window of 30 seconds or longer. In the real life, traffic accidents could occur in a matter of seconds or less if the driver does not promptly respond to sudden events on the road. Therefore, it is essential to investigate the EEG activities before, during and after an event during continuous driving. Huang et al. have demonstrated event-related brain dynamics during
3
continuous performance tasks in a static laboratory setting [18][19][20][21][22]. Decreases or increases in alpha band power occurred following critical events during continuous tracking or driving. However, it is not known whether these event-related dynamic patterns remain the same on a dynamic driving simulator or in real-life driving.
1.3. The Kinesthetic Perception on a Dynamic Driving Simulator
Driving is a complex everyday task that involves predominantly visual information processing. Drivers need to be aware of expected or unexpected critical events (such as deviation of the vehicle) that appear in their useful visual field. In real-life driving, drivers also receive vestibular and proprioceptive inputs, such as vibrations and centrifugal force, in addition to visual inputs. The vestibular apparatus in the inner ear includes the utricle, saccule and three semicircular canals, which provide sensation of balance and head acceleration. Patients with vestibular disorientation syndrome could be a concern for driving safety [23]. Proprioceptor, located in the stretch receptors in the muscles, tendons, and joints, is a sensory receptor that provides information about body position (sense the relative position) and movement of neighboring body parts. Most studies on driving and drowsiness did not consider the influence of kinesthetic stimuli on EEG patterns. In this study, a driving simulator on a six degree-of-freedom motion platform was used to investigate EEG activities from alertness to drowsiness with or without the influence of kinesthetic stimuli when the subjects participated in an event-related lane departure driving task [22].
1.4. Aims of this Thesis
In order to establish the fundamental factors of drowsy driving, the aims of this study were to: (1) draw a comprehensive picture of event-related EEG dynamics (in
4
different brain regions and at different frequency bands) before, during, and after lane departure events, (2) study the influence of kinesthetic stimuli by comparing EEG patterns in motion (active platform) with those in motionless (inactive platform) driving sessions, and (3) identify the brain region(s) and frequency band(s) which could provide useful information to driving safety and drowsiness detection systems.
5
Chapter 2 Materials and Methods
2.1. Event-Related Lane Departure Paradigm
In this study, the event-related lane departure driving paradigm [18][22] was implemented in a 360-degree virtual-reality (VR) based driving simulator with a motion platform. The VR scenes simulated a vehicle cruising at a constant speed in the third lane of a four-lane highway at night. There was no other traffic in both directions on the highway. The subjects did not need to use the gas or brake paddles. The computer program randomly introduced a perturbation (lane departure event) and caused the virtual vehicle to drift to the left or right with equal probability. Subjects were instructed to steer back to the center of the cruising lane as quickly as possible after they detected the deviation. If the subjects fall asleep and did not respond to the deviation, the vehicle would eventually hit the virtual curb on either side of the road. The vehicle did not stop or crash at the curb, but continued to cruise at a constant speed against the curb until the subjects resumed their responses. The next deviation event occurred randomly 5 to 10 s after the moment when the vehicle was back in the third lane. Three critical moments: deviation onset, response onset and response offset, are defined in each lane-departure incident (Fig. 2-1). Deviation onset is the moment when the vehicle starts to deviate. Response onset is the moment when the subject initiates the compensatory steering. Response offset is the moment when the vehicle returns to the center of the cruising lane and the subject ceases to rotate the steering wheel.
6
2.2. 3D Virtual Reality Based Driving Simulation Environment
A 3D virtual reality driving simulator was built to simulate real-life driving environments because of safety concern of conducting experiments with a real car on the road. In addition, simulated driving environment has other advantages, including well-controlled temperature, background illumination, and other unnecessary stimuli or distractions. The 3D VR scenes were projected from 6 projectors in the direction of 0°, 42°, 83.596°, 180°, 277.088° and 318°, which creates a 360° surrounding environment. The dimensions of the screens were 300 × 225 (width × height) cm, 290 × 225 cm, 260 × 195 cm, 520 × 195 cm, 260 × 195 cm and 290 × 225 cm, respectively. These large screens generate an immersive sensation and near real-life driving environment (Fig. 2-2). In order to simulate kinesthetic sensation in the real world, a hydraulic hexapod Stewart platform was mounted underneath a real car frame (Fig. 2-3). The six degree-of-freedom Stewart platform can simulate 3D rotations, including pitch, roll, and yam (Fig. 2-4). The interior of the car frame remains unchanged. Unnecessary parts, such as the engine and wheels, were removed from the car to reduce the weight. In addition, cameras were installed at the dashboard to monitor the subjects’ statuses.
7 (A)
(B)
Fig. 2-2 (A) A wide view of the 3D virtual reality surrounding driving environment [17]. (B) A snap shot of the driving scene in the experiment.
8
(A) (B) Fig. 2-3 (A) The car frame (Ford Probe) of driving simulator. (B) The Stewart
platform under the car frame.
9
2.3. Subjects
Each of six subjects participated in one motion session and one motionless session on different days. All subjects were recruited from National Chiao Tung University, Taiwan, and were paid to participate in the experiment. All subjects have normal or corrected-to-normal vision, and none of them have history of psychiatric or sleep disorders. None of the subjects were sleep deprived the night before the experiment. Each subject signed a consent form before the experiment.
2.4. EEG Recordings and Experimental Procedures
EEG signals were recorded using Ag/AgCl electrodes embedded on a 32 Channel Quik-Cap (Neuromedical Supplies, Inc.) (Fig. 2-5). The electrodes were arranged according to a modified international 10/20 system. Fig. 2-6 shows an example of electrode locations in this study. The reference was the mean of the signals of left and right mastoid electrodes. The skins under the reference electrodes were abraded with Nuprep (DO Weaver and Co., USA) and disinfected with a 70-percent isopropyl alcohol swab before calibrating. The impedance of the electrodes was calibrated under 5kΩ with NaCl based conductive gel (Quik-Gel, Neuromedical Supplies ®). The EEG signals from the electro-cap were amplified by the Scan NuAmps Express system (Compumedics Ltd., VIC, Australia) and then recorded at 500 Hz sampling rate.
The scene of event-related lane departure driving task was projected from six projectors controlled by servers connected by local area network. The Stewart motion platform was inactive during motionless sessions. During motion sessions, the motion platform was active and simulated the kinesthetic sensation during lane departure events.
10
Subjects were instructed with the details of task requirements after they were settled in the driver’s seat. Subjects practiced the task for a few minutes before the main experiment started. The duration of the main experiment was 1.67 ± 0.10 hours (mean ± standard deviation) in motionless session, and 1.79 ± 0.09 hours in motion sessions, respectively.
11
12
Chapter 3 Data
Analysis
Fig. 3-1 shows the flowchart of data analysis procedures. EEG data and behavior data were recorded simultaneously. Segments of abnormal driving trajectory were rejected before analysis of RTs. For each session of each subject, data preprocessing was applied to 30-channel raw EEG signals. Continuous EEG time series were extracted into epochs time-locked to deviation onset events. Independent component analysis (ICA) was applied to epoched EEG data after artifact removal. Time-frequency analyses, including event-related spectral perturbations (ERSPs) and event-related power, were applied to the activation time courses of each independent component (IC) cluster.
13
3.1. Analysis of Driving Performance
3.1.1. Remove Abnormal Driving Trajectory
The optimal driving trajectory of a lane departure event was shown in Fig. 2-1. Typically, a flat segment represents stable cruising between each response offset and the next deviation onset. Due to instability or overcompensation of the steering wheel after the vehicle returned to the center of the third lane, some segments of driving trajectory showed abnormal patterns, such as zigzags or slopes. These abnormal trajectories are likely to induce additional changes in EEG power spectra, making it difficult to interpret the results.
Fig. 3-2 showed three examples of abnormal driving trajectories (in red circles). There are 210.50 ± 122.44 abnormal trials out of 604.17 ± 60.67 total trials in the motionless sessions and 187.50 ± 109.72 abnormal trials out of 655.17 ± 60.92 total trials in the motion sessions. All epochs with abnormal trajectories were removed before further analysis.
14
3.1.2. Reaction Times
In this study, driving performance was measured by reaction times (RTs) as defined in the event-related lane departure paradigm [22]. The driver’s reaction times to critical events are generally slower when they become fatigue or drowsy than when they are alert. The reaction time in each lane-departure event (trial or epoch) was computed from the driving trajectory. A crash event is defined as trial with RT longer than 3 seconds.
Fig. 3-2 Three examples of abnormal driving trajectories. Blue curve: driving trajectory. Black dots: the time points of deviation onset of each event. Pink dots: the time points of response onset of each event. Gray horizontal lines: lane markings (boundaries) of third lane. Gray vertical lines: 1 s before deviation onset events.
15
3.2. Data Preprocessing
Matlab package and the EEGLAB toolbox were used for offline data preprocessing and independent component analysis (ICA) on a PC [24]. A low-pass filter (finite impulse response (FIR) filter, cut-off frequency: 50 Hz) was applied to the raw EEG data to remove the power line noise (60 Hz) and other high frequency noises. A high-pass filter (FIR filter, cut-off frequency: 0.5 Hz) was used to remove baseline drift. The filtered EEG data were then down-sampled to 250 Hz for further analysis.
For each session, three sets of epochs time-locked to different events were extracted from continuous EEG data: (1) epochs that extend from 1 sec prior to and 7 sec following each deviation onset, (2) epochs that extend from 2 sec prior to and 4 sec following each response onset, (3) epochs that extend from 2 sec prior to and 4 sec following each response offset. Epochs that contained extreme amplitudes and noise across all channels were rejected together with epochs that contained abnormal trajectory in the behavioral data.
3.3. Independent Component Analysis (ICA)
In this study, we attempt to solve the identification and source localization problem by using a generally applicable ICA. Thus, the artifacts including the eye-movement (EOG), eye-blinking, muscle-movement (EMG), and line noises can be successfully separated from EEG activities. The ICA is a statistical “latent variables” model with generative form:
) t ( ) t ( As x = (1)
Where A is a linear transform called a mixing matrix and si are statistically mutually independent. The ICA model describes how the observed data are
16
generated by a process of mixing the components si. The independent components si (often abbreviated as ICs) is latent variables, meaning that they cannot be directly observed. The mixing matrix A is assumed to be unknown. All we observed are the random variables xi, and we must estimate both the mixing matrix and the IC’s si using the xi.
Therefore, given time series of the observed data
[
]
TN t x t x t x t) ( ) ( ) ( ) ( x = 1 2 L in
N-dimension, ICA will find a linear mapping W such that the unmixed signals u(t) are statically independent. ) t ( ) t ( Wx u = (2)
Supposed the probability density function of the observations x can be expressed as: ) ( p ) det( ) ( p x = W u (3)
The learning algorithm can be derived using the maximum likelihood formulation with the log-likelihood function derived as:
∑
= + = N i i i(u ) p log ) det( log ) , ( 1 W W u L (4)Thus, an effective learning algorithm using natural gradient to maximize the log-likelihood with respect to W gives:
[
I u u]
W W W W W u W L( , ) T ϕ( ) T Δ = − ∂ ∂ ∝ (5)where the nonlinearity
T N u ) u ( p u ) u ( p ) ( p ) u ( p ) u ( p ) ( p ) ( N N ⎥ ⎥ ⎦ ⎤ ⎢ ⎢ ⎣ ⎡ − − = − = ∂ ∂ ∂ ∂ ∂ ∂ L 1 1 1 u u u u ϕ (6)
17
convergence considerably. It is difficult to know a priori the parametric density function
p(u), which plays an essential role in the learning process. If we choose to
approximate the estimated probability density function with an Edgeworth expansion or Gram-Charlier expansion for generalizing the learning rule to sources with either sub- or super-Gaussian distributions, the nonlinearity φ(u) can be derived as:
⎩ ⎨ ⎧ + − = sources, gaussian -sub for : ) tanh( sources, gaussian -super for : ) tanh( ) ( u u u u u ϕ (7) Then,
[
]
[
]
⎩ ⎨ ⎧ − + − − = Δ gaussian, -sub : ) tanh( gaussian, -super : ) tanh( W uu u u I W uu u u I T T T T W (8)Since there is no general definition for sub- and super-Gaussian sources, we
choose p = (N(1,1)+N(-1,1)) 2 1 ) u ( and p(u)=N(0,1)sech
2(u) for sub- and super-Gaussian,
respectively, where N(μ,σ2) is a normal distribution. The learning rules differ in the sign
before the tanh function and can be determined using a switching criterion as:
[ ] ⎩ ⎨ ⎧ − = = − − ∝ Δ gaussian, -sub : 1 gaussian, -super : 1 where , ) tanh( i i κ κ W uu u u K I W T T (9) Where
{
} { }
{
}
(
i i i i)
i =signEsech2(u )Eu2 −Etanh(u )u
κ (10)
represents the elements of N-dimensional diagonal matrix K. After ICA training, we can obtain N ICA components u(t) decomposed from the measured N-channel EEG data x(t). In this study, N=30, thus we obtain 30 components from 30 channel signals. ). ( ) ( ) ( ) ( ) ( ) ( ) ( ) ( 33 33 , 33 33 , 2 33 , 1 2 2 , 33 2 , 2 2 , 1 1 1 , 33 1 , 2 1 , 1 33 2 1 t u w w w t u w w w t u w w w t t x t x t x t ⎥ ⎥ ⎥ ⎥ ⎦ ⎤ ⎢ ⎢ ⎢ ⎢ ⎣ ⎡ + + ⎥ ⎥ ⎥ ⎥ ⎦ ⎤ ⎢ ⎢ ⎢ ⎢ ⎣ ⎡ + ⎥ ⎥ ⎥ ⎥ ⎦ ⎤ ⎢ ⎢ ⎢ ⎢ ⎣ ⎡ = = ⎥ ⎥ ⎥ ⎥ ⎦ ⎤ ⎢ ⎢ ⎢ ⎢ ⎣ ⎡ = M L M M M Wu x (3)
18
Fig. 3-3 showed the scalp topographies of ICA decomposition of 30-channel EEG data into 30 independent components. Each map was generated by rendering a column of the inverse of ICA weighting matrix onto the scalp. These maps indicate the approximate originating source locations of independent processes. For example, components 1 and 3 correspond to eye related activities. Components 2, 4, 5, 7, 8, 9, 10, 14, 15, and 16 correspond to brain and cognitive related activities. Other components correspond to non-brain related artifacts.
3.4. Event-Related Spectral Perturbations (ERSPs)
In this study, event-related spectral perturbations (ERSPs) [25] were used to Fig. 3-3 An example of the topographic maps of ICA weight matrix projected on the
19
study brain dynamics induced by lane departure events and subsequent motor responses. ERSPs show whole-spectrum power changes relative to pre-event power spectral baseline in single-channel EEG data or independent component activations.
For each IC of interest, the epochs of IC activation time courses were sorted by trial reaction times, and divided into four groups: (1) 0 to 33.3% of trials below 3-s RT, (2) 33.3 to 66.6 % of trials below 3-s RT, (3) 66.6 to 100% of trials below 3-s RT, (4) other trials with RT > 3 s. This grouping method allows the comparison of ERSPs between short and long RTs epochs. Fig. 3-4 and Fig. 3-5 show the flowcharts of ERSP analysis. To obtain ERSPs, a time-frequency array was computed from each epoch of IC activation by applying the Discrete Fourier Transform (DFT) (timefreq() function of EEGLAB, winsize: 128, padratio: 2): Fk,c(f,t), where k is the index of
epochs, c is component index, f is the frequency bin, t is the time point. The log power of this array was computed using:
))) , ( ( ) , ( , (F cf t conj F , f t log 10 t) (f, Pk,c = × k × kc (1)
The ERSPs of component c was obtained by averaging n power matrices of the same group:
∑
= = n k k cf t P n 1 t) f, ERSP(c, 1 ) , , ( (2) t) f,ERSP(c, was then normalized by subtracting the baseline power spectra, which
were the mean power spectra (a vector of length f) from 1-s window before deviation onset (Fig. 3-5).
20
Fig. 3-4 The flowchart of ERSP analysis.
21
3.5. Event-Related Power Analysis
One of the goals of this study was to investigate the changes of event-related brain dynamics from alertness (short RTs) to drowsiness (long RTs) during simulated driving. In this study, RT-sorted event-related power images were computed for delta (3-4 Hz), alpha (8-12 Hz), and beta (18-22 Hz) bands from the matrix Pk,c(f,t) of
single-session data. ( ) ( , ( , )) ) max( ) min( , , t mean P f t P kc f f f ' f c k i i i = < < (3) where fi∈{δ,α,β}.
The raw event-related power image of frequency band fi is the matrix from vector
) ( ' , , t P1cfi to P', , (t) i f c
n , where P1',c,fi(t) is the vector at the shortest RT, P', , (t)
i
f c
n is the
vector at the longest RT, and n is the total number of trials in the selected sessions. The raw event-related power image of fi was then normalized by subtracting the mean baseline power of ‘alert’ period, defined as the 1-s window before deviation onset of the first 10% of epochs below 3-s RT. In order to observe the trend of event-related power from short to long RTs, moving average across RT-sorted epochs was applied to the normalized event-related power image. The size of moving window is the number of the first 10% of epochs below 3-s RT, and the advancing step is 10 epochs.
Two-sample t-test was applied to the raw event-related fi power image to detect
significant tonic or phasic changes from ‘alert’ baseline power. The contours in the event-related power images indicate regions of statistically significant (p < 0.01) changes. The event-related power images were also computed for epochs time-locked to response onset and response offset. Fig. 3-6 showed the procedures for computing event-related alpha power images of an occipital independent component.
22
23
3.6. Component Clustering
In order to characterize event-related brain dynamics of independent components (ICs) in different brain regions across subjects, ICs were grouped into clusters according to their topographic maps and power spectral profiles. According to previous studies [22], ICs across all sessions were first manually grouped into ten clusters located in the central frontal, left frontal, right frontal, central, parietal, left somatomotor, right somatomotor, occipital midline, bilateral occipital, and tangential occipital regions according to their topographic maps. Ten clusters were obtained for each of motion and motionless conditions, respectively. In each IC cluster, components that show deviant power spectral profiles and dipole locations were identified as outliers and were removed from the cluster. Clustered component matrices were then normalized to 1 by their ICA weights. Some component matrices were multiplied by -1 to correct the polarity of their scalp maps. Fig. 3-7 shows the schematic diagram of component clustering. Epochs of all IC within the same cluster were then grouped and sorted by RTs. To summarize the characteristics of event-related brain dynamics across group, event-related spectral perturbations (ERSPs) and event-related power images were computed from grouped epochs in each IC cluster.
24
25
Chapter 4 Results
4.1. Behavioral Performance
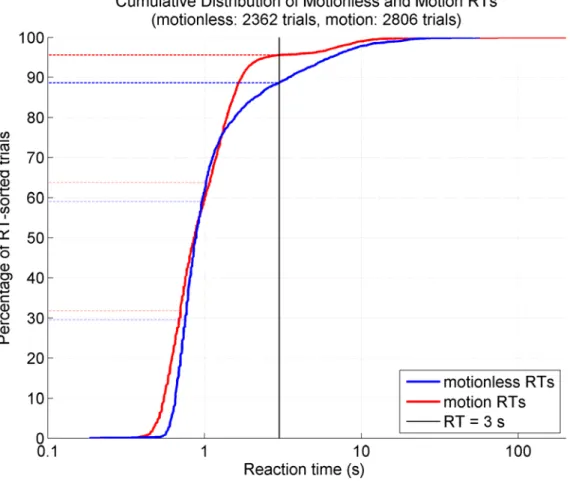
Fig. 4-1 showed the cumulative distribution of group RTs (after artifact removal) in motionless (blue curve) and motion (red curve) conditions, respectively. In motionless condition, the mean of RTs below 3 s was 886.5 ms (SD = 317.2 ms). In motion condition, the mean RTs below 3 s was 956.2 ms (SD = 204.8 ms). The first 50% of RTs in the motion condition were shorter than those in the motionless condition. Both the motionless and motion conditions showed a “bilinear distribution” of cumulative RTs, i.e. the majority of RTs was below 3 s, and RTs increased abruptly above 3 s.
Fig. 4-1 The cumulative distributions of RTs in motion and motionless sessions. The vertical black line indicates 3-s RT.
26
Component number;
subject date duration (hr) F LF RF C P LMu RMu OM BLO TO
Motionless s05 2006/11/1 1.8053 7 3 6;13 10 1;11 s31 2006/11/3 1.7017 5 17 11 10 9 7;12 6 13 s35 2007/3/22 1.5293 6 17 9 16 14 7 21 s36 2006/12/21 1.7562 8 14 9 2 4;16 10 7 5 15 s43 2007/2/8 1.5857 13 15 s44 2007/3/25 1.6525 9 11 10 14 13 mean 1.6718 ± 0.1039
total components/total sessions 3/6 3/6 3/6 4/6 7/6 4/6 3/6 5/6 5/6 3/6
Motion s05 2006/10/19 1.7228 5 10 16 6 12 9 8;17 7 4;18 20 s31 2006/10/20 1.9408 3 13 11 7 10 9 6 15 s35 2007/1/15 1.7264 14 8 7 5 9 3 10 s36 2006/11/22 1.8308 10 14 4 9;20 18;22 11 8 s43 2007/2/2 1.7864 5 7 10 s44 2007/1/26 1.7049 8 14 10 19 mean 1.7853 ± 0.0895
total components/total sessions 3/6 3/6 3/6 5/6 6/6 2/6 6/6 5/6 5/6 5/6 ALL 1.7286 ± 0.1098 6/12 6/12 6/12 9/12 13/12 6/12 9/12 10/12 10/12 8/12 F: frontal; LF: left frontal; RF: right frontal; C: central; P: parietal; LMu: left somatomotor; RMu: right somatomotor; OM:
occipital midline; BLO: bilateral occipital; TO: tangential occipital
27
4.2. Independent Component (IC) Clustering and Source
Localization
Table 4-1 summarizes the datasets (N=6) and IC clusters in this study. The results of left somatomotor, parietal, occipital midline, and bilateral occipital IC clusters are shown in the following sections.
4.2.1. The Left Somatomotor Cluster
Motionless Motion
Fig. 4-2 The grand mean of the scalp maps (upper panels) and their equivalent dipole source locations (lower panels) of the left somatomotor IC clusters in motionless (left panels) and motion (right panels) sessions. The left somatomotor components were identified in four motionless sessions (four subjects) and in two motion sessions (two subjects), respectively.
28
4.2.2. The Parietal Cluster
Motionless Motion
Fig. 4-3 The grand mean of the scalp maps (upper panels) and their equivalent dipole source locations (lower panels) of the parietal IC clusters in motionless (left panels) and motion (right panels) sessions. Seven parietal components were identified from five motionless sessions (five subjects), and six were identified from five motion sessions (five subjects), respectively.
29
4.2.3. The Occipital Midline Cluster
Motionless Motion
Fig. 4-4 The grand mean of the scalp maps (upper panels) and their equivalent dipole source locations (lower panels) of the occipital midline IC clusters in motionless (left panels) and motion (right panels) sessions. Five occipital midline components were identified from five motionless sessions (five subjects), and five were identified from five motion sessions (five subjects), respectively.
30
4.2.4. The Bilateral Occipital Cluster
Motionless Motion
Fig. 4-5 The grand mean of the scalp maps (upper panels) and their equivalent dipole source locations (lower panels) of the bilateral occipital IC clusters in motionless (left panels) and motion (right panels) sessions. Five bilateral occipital components were identified from four motionless sessions (four subjects), and five were identified from four motion sessions (four subjects), respectively.
31
4.3. Brain Dynamics of Four IC Clusters
The section shows the results of four IC clusters, including ERSP images of alert epochs (the first 1/3 epochs below 3-s RT) time-locked to deviation onset, and event-related power images of three sets of epochs time-locked to deviation onset, response onset, and response offset, respectively.
4.3.1. The Left Somatomotor Cluster
Fig. 4-6 shows the ERSP images of motionless (upper panel) and motion (lower panel) conditions of the left somatomotor cluster. Both images show increase in delta band power between deviation onset and response onset, suppression in alpha and
M ot io n M ot io nl es s
Fig. 4-6 ERSP images of motionless (upper panel) and motion (lower panel) conditions of the left somatomotor cluster. Black solid vertical lines: deviation onset. Purple dashed vertical lines: response onset. Red solid vertical lines: response offset.
32
beta band power during response, and beta rebound after response offset.
Fig. 4-7 shows event-related alpha-band power images of motionless (upper panels) and motion (lower panels) conditions. Strong suppression in alpha band power occurred from a few hundred milliseconds before response onset to a few hundred milliseconds after response offset in both motion and motionless conditions. The suppression is stronger in the motion condition than that in the motionless condition. Rebound in alpha band power occurred following response offset in both conditions in long RT epochs.
(A) Deviation Onset (B) Response Onset (C) Response Offset
M ot io n M ot io nl es s
Fig. 4-7 The event-related alpha-band power images, time-locked to (A) deviation onset, (B) response onset and (C) response offset, of motionless (upper panels) and motion (lower panels) conditions of the left somatomotor cluster. The black dashed horizontal lines are the trial of RT = 3 s. Blue solid curves: the mean of power of trials that RT < 3 s. Black solid lines/curves: deviation onset. Purple dashed lines/curves: response onset. Red solid lines/curves: response offset.
33
Fig. 4-8 shows event-related delta-band power images of motionless (upper panels) and motion (lower panels) conditions. Delta power increased between deviation onset and response onset, and the increase was significant in the motionless condition (Fig. 4-8 AB).
Fig. 4-9 shows event-related beta-band power images of motionless (upper panels) and motion (lower panels) conditions. Suppression in beta band power occurred from a few hundred milliseconds before response onset to a few hundred milliseconds after response offset in both motion and motionless conditions. The beta suppression of the voluntary movement (steering) was consistent with previous studies [26]. In motion condition, a slight beta rebound can be observed between
(A) Deviation Onset (B) Response Onset (C) Response Offset
M ot io n M ot io nl es s
Fig. 4-8 The event-related delta-band power image of motionless and motion conditions of the left somatomotor cluster. Other conventions as in Fig. 4-7.
34
response onset and response offset. Both conditions show significant post-movement beta rebound after response offset.
(A) Deviation Onset (B) Response Onset (C) Response Offset
M ot io n M ot io nl es s
Fig. 4-9 The event-related beta-band power images of motionless and motion conditions of the left somatomotor cluster. Other conventions as in Fig. 4-7.
35
4.3.2. The Parietal Cluster
Fig. 4-10 shows the ERSP images of motionless (upper panel) and motion (lower panel) conditions of the parietal cluster. Both images show increases in delta band power between deviation onset and response onset, suppression in alpha and beta band power during response, and rebound after response offset.
Fig. 4-11 shows event-related alpha-band power images of motionless (upper panels) and motion (lower panels) conditions. The baseline alpha power before deviation onset increases significantly when the index is above ~66% of RT < 3 s in motion condition (Fig. 4-11 A, lower panel). However, the increase in baseline power in the motionless condition does not reach the same significance level. Both
M ot io n M ot io nl es s
Fig. 4-10 ERSP images of motionless and motion conditions of the parietal cluster. All conventions as in Fig. 4-6.
36
conditions show suppression in alpha band power from a few hundred milliseconds before response onset to a few hundred milliseconds after response offset. Rebound in alpha band power occurs after response offset in both conditions, and the strength of the rebound is stronger in long RT epochs.
Fig. 4-12 shows event-related delta-band power images of motionless (upper panels) and motion (lower panels) conditions. Significant delta-band power increases occurred between deviation onset and response onset in both conditions (Fig. 4-12 A). In the motion condition, the increase in delta-band power seemed to be time-locked to deviation onset instead of response onset.
(A) Deviation Onset (B) Response Onset (C) Response Offset
M ot io n M ot io nl es s
Fig. 4-11 The event-related alpha-band power images of motionless and motion conditions of the parietal cluster. Other conventions as in Fig. 4-7.
37
Fig. 4-13 shows event-related beta-band power images of motionless (upper panels) and motion (lower panels) conditions. Beta-band power does not increase as RTs increased in the baseline period in both conditions. Beta suppression occurs between response onset and response offset in the motionless condition, but it only occurs near response onset in the motion condition. Beta rebound occurs after response offset in both conditions, and become stronger in long-RT (near or above 3 s) epochs.
(A) Deviation Onset (B) Response Onset (C) Response Offset
M ot io n M ot io nl es s
Fig. 4-12 The event-related delta-band power images of motionless and motion conditions of the parietal cluster. Other conventions as in Fig. 4-7.
38
(A) Deviation Onset (B) Response Onset (C) Response Offset
M ot io n M ot io nl es s
Fig. 4-13 The event-related beta-band power images of motionless and motion conditions of the parietal cluster. Other conventions as in Fig. 4-7.
39
4.3.3. The Occipital Midline Cluster
Fig. 4-14 shows the ERSP images of motionless (upper panel) and motion (lower panel) conditions of the occipital midline cluster. Both images show suppression in alpha and beta band power a few hundred milliseconds before response onset to a few hundred milliseconds after response offset, and rebound predominately in alpha band power after response offset.
Fig. 4-15 shows event-related alpha-band power images of motionless (upper panels) and motion (lower panels) conditions. The baseline (tonic) alpha power increases significantly when the index is above 85% of RTs < 3 s in the motionless condition, and above 33% of RTs < 3 s in the motion condition (Fig. 4-15 A).
M ot io n M ot io nl es s
Fig. 4-14 ERSP images of motionless and motion conditions of the occipital midline cluster. All conventions as in Fig. 4-6.
40
Suppression of alpha-band power occurs between response onset and response offset, and is most significant in the alert epochs (33% of RTs < 3 s) in the motion condition (Fig. 4-15 AB). The suppression lasts for a few hundred milliseconds after response offset. Rebound in alpha band power occur a few hundred milliseconds after response offset, and the strength of rebound become stronger as RTs increase in both motion and motionless conditions (Fig. 4-15 C). In addition, in the motion condition, significant alpha rebound occurs faster in long-RT epochs than in the short-RT epochs.
Fig. 4-16 shows event-related delta-band power images of motionless (upper panels) and motion (lower panels) conditions. There is little suppression in delta-band power between response onset and response offset during short-RT epochs in
(A) Deviation Onset (B) Response Onset (C) Response Offset
M ot io n M ot io nl es s
Fig. 4-15 The event-related alpha-band power images of motionless and motion conditions of the occipital midline cluster. Other conventions as in Fig. 4-7.
41
motionless condition. Significant delta-band power increases occur between deviation onset and response onset during long-RT epochs in the motion condition.
Fig. 4-17 shows event-related beta-band power images of motionless (upper panels) and motion (lower panels) conditions. There is little suppression in beta-band power between response onset and response offset in both motionless and motion conditions. The suppression does not occur until a few hundred milliseconds before response onset in long-RT epochs (Fig. 4-17 B). Rebound in beta-band power occur a few hundred milliseconds after response offset, and its strength increases with RTs.
(A) Deviation Onset (B) Response Onset (C) Response Offset
M ot io n M ot io nl es s
Fig. 4-16 The event-related delta-band power images of motionless and motion conditions of the occipital midline cluster. Other conventions as in Fig. 4-7.
42
(A) Deviation Onset (B) Response Onset (C) Response Offset
M ot io n M ot io nl es s
Fig. 4-17 The event-related beta-band power images of motionless and motion conditions of the occipital midline cluster. Other conventions as in Fig. 4-7.
43
4.3.4. The Bilateral Occipital Cluster
Fig. 4-18 shows the ERSP images of motionless (upper panel) and motion (lower panel) conditions of the bilateral occipital cluster. Both images show suppression in alpha and beta band power between deviation onset and response offset. The alpha suppression lasted for a few hundred milliseconds after response offset. Prolonged power rebound occurs at high-alpha and low-beta bands after response offset.
Fig. 4-19 shows event-related alpha-band power images of motionless (upper panels) and motion (lower panels) conditions of the bilateral occipital cluster. The baseline (tonic) alpha power increases significantly before 3-s RT and become non-significant again above 3-s RTs in the motion condition (Fig. 4-19 A, lower panel).
M ot io n M ot io nl es s
Fig. 4-18 ERSP images of motionless and motion conditions of the bilateral occipital cluster. All conventions as in Fig. 4-6.
44
This trend in alpha band power is often referred to as ‘bi-phasic’ pattern [27]. In the motionless condition, the baseline alpha-band power increases slightly as RTs increase, but does not reach significant level. In the motionless condition, strong suppression in alpha band power occurs from a few hundred milliseconds before response onset to a few hundred milliseconds after response offset (Fig. 4-19 BC, upper panels). In the motion condition, transient suppression in alpha band power occurs near response onset and response offset events (Fig. 4-19 BC, lower panels). There is strong rebound in alpha band power a few hundred milliseconds after response offset in the motion condition, and the strength of the rebound is significant across all RTs. However, the strength of rebound is only significant above 3-s RTs in the motionless condition. The overall patterns of alpha suppression and rebound suggest a qualitative difference between motion and motionless conditions.
(A) Deviation Onset (B) Response Onset (C) Response Offset
M ot io n M ot io nl es s
Fig. 4-19 The event-related alpha-band power images of motionless and motion conditions of the bilateral occipital cluster. Other conventions as in Fig. 4-7.
45
Fig. 4-20 shows event-related delta-band power images of motionless (upper panels) and motion (lower panels) conditions of the bilateral occipital cluster. There is little to no suppression in delta-band power between response onset and response offset in both motionless and motion conditions. In the motion condition and during long-RT epochs, significant delta-band power increase between deviation onset and response onset, follow by suppression between response onset and offset, and increased again (rebound) after response offset.
Fig. 4-21 shows event-related beta-band power images of motionless (upper panels) and motion (lower panels) conditions of the bilateral occipital cluster. The overall patterns of suppression and rebound in beta-band power are similar to those in
(A) Deviation Onset (B) Response Onset (C) Response Offset
M ot io n M ot io nl es s
Fig. 4-20 The event-related delta-band power images of motionless and motion conditions of the bilateral occipital cluster. Other conventions as in Fig. 4-7.
46
alpha-band power. However, the strength of suppression and rebound is weaker in the beta-band power than that in the alpha-band power.
(A) Deviation Onset (B) Response Onset (C) Response Offset
M ot io n M ot io nl es s
Fig. 4-21 The event-related beta-band power images of motionless and motion conditions of the bilateral occipital cluster. Other conventions as in Fig. 4-7.
47
Chapter 5 Discussions
Driving is a complex task that involves visual attention, spatial cognition, decision making, and sensorimotor coordination. In order to prevent accidents, the drivers are required to pay attention to events or situations on the road and make prompt responses. When the drivers become fatigue or drowsy, their responses to unanticipated events are usually slowed down. This study shows a comprehensive picture of EEG dynamics of multiple independent brain processes while the subjects participated in an event-related lane departure task during simulated driving on a motion platform. The results show EEG spectral power changes before, during, and after the lane departure event for each IC cluster, and how these activities were affected by the increase of reaction time. The influences of kinesthetic stimuli on brain activities were also discussed here.
5.1. Tonic Changes in Baseline EEG Power Spectra
As reaction time increased, the parietal (Fig. 4-11 A), occipital midline (Fig. 4-15 A), bilateral occipital (Fig. 4-2019 A) and tangential occipital (Fig. 5-1 A) clusters showed significant increase in baseline alpha-band power predominantly in the motion condition. However, the tonic increases in alpha band power only reached significant level when RTs were near or above 3 s in the motionless condition. These differences suggest that kinesthetic stimuli have major influence on the tonic EEG patterns. Therefore, in order to develop a valid drowsiness detection system, it is essential to conduct simulated driving on a motion platform, which provides realistic and multisensory stimuli similar to real-life driving. The tonic increase in alpha band power could potentially be used as an index of drowsiness level. However, it should be noted that the bilateral occipital cluster of the motion condition showed a
48
“bi-phasic” phenomenon in alpha band power [27]. The bi-phasic phenomenon was not reported by a recent study by Huang et al. [22], where only 5% of overall RTs were above 3 s.
5.2. Event-Related Delta Power Increase
In this study, transient (phasic) delta-band power increased a few hundred milliseconds after deviation onset in the frontal (Fig. 5-2 AB), central (Fig. 5-3 AB), parietal (Fig. 4-12 AB), left somatomotor (Fig. 4-8 AB) and tangential occipital (Fig. 5-4 AB) clusters. In the central (Fig. 5-3 AB), parietal (Fig. 4-12 AB), and tangential occipital (Fig. 5-4 AB) clusters, the delta-band power increases were most prominent and time-locked to deviation onset in the motion conditions. The transient delta-band power increases in long-RT epochs suggested that the brains were responsive to the kinesthetic stimuli generated by the motion platform even when the subjects were
(A) Deviation Onset (B) Response Onset (C) Response Offset
M ot io n M ot io nl es s
Fig. 5-1 The event-related alpha-band power images of motionless and motion conditions of the left tangential occipital cluster. Other conventions as in Fig. 4-7.
49
drowsy. Similar transient delta-band power increases before manual responses have been reported [28].
(A) Deviation Onset (B) Response Onset (C) Response Offset
M ot io n M ot io nl es s
Fig. 5-2 The event-related delta-band power images of motionless and motion conditions of the frontal cluster. Other conventions as in Fig. 4-7.
50
(A) Deviation Onset (B) Response Onset (C) Response Offset
M ot io n M ot io nl es s
Fig. 5-3 The event-related delta-band power images of motionless and motion conditions of the central cluster. Other conventions as in Fig. 4-7.
51
5.3. Event-Related Desynchronization (ERD)
Previous studies have shown event-related desynchronization (ERD) in beta band power started 2 s before the onset of voluntary movement and were more prominent over contra-lateral sensorimotor cortex and extended bilaterally after movement onset [29][30]. Our results showed ERD in alpha and beta band power in the somatomotor, parietal, and occipital regions in both motion and motionless conditions. In all four clusters reported, ERD occurred a few hundred milliseconds before response onset and ended a few hundred milliseconds after response offset. During drowsy periods, ERD did not occur until response onset. Therefore, the absence of ERD right after deviation onset could serve as an index of drowsiness.
The left somatomotor cluster showed stronger ERD in alpha band power in the
(A) Deviation Onset (B) Response Onset (C) Response Offset
M ot io n M ot io nl es s
Fig. 5-4 The event-related delta-band power images of motionless and motion conditions of the tangential occipital cluster. Other conventions as in Fig. 4-7.
52
motion condition than that in the motionless condition. However, the bilateral occipital cluster showed stronger ERD in alpha band power in the motionless condition than that in the motion condition. Data from more subjects are required to support this phenomenon in the future.
5.4. Event-Related Synchronization (ERS)
Significant rebound (ERS) in beta band started a few hundred milliseconds after response offset in both motion and motionless conditions of the left somatomotor
cluster. Little to no post-movement rebound in alpha band was found over left
somatomotor cluster in short-RT epochs in both conditions (and motion condition on right somatomotor cluster). These ERS patterns in sohrt-RT epochs were consistent with previous results in magnetoencephalography (MEG) study [30].
In addition, ERS in alpha band occurred a few hundred milliseconds after response offset in the occipital and parietal clusters. The strength of ERS in alpha band increased as RTs prolonged during potentially drowsy periods. The presence of ERS in multiple IC clusters after response offset could be interpreted as a state of relaxation when the car returns to cruising mode after the lane departure event.
53
Chapter 6 Conclusions
In order to prevent accidents due to drowsy driving, event-related brain dynamics from alertness to drowsiness were studied during simulated driving. Subjects participated in an event-related lane departure task in a VR-based driving environment on a motion platform. This study reveals a comprehensive picture of tonic and phasic brain dynamics before, during, and after the lane departure event in simulated driving experiments. Independent component analysis (ICA) was used to decompose 30-channel EEG data into spatially independent brain processes. Independent components with similar topographic maps, dipole source locations, and spectral profiles were grouped into IC clusters. In the parietal and occipital clusters, the tonic increases in alpha band power prior to deviation onset could be used as an index for drowsiness detection system. In the motion condition, the transient delta power increases after deviation onset in the central and parietal clusters could result from kinesthetic stimuli generated by the motion platform. Following deviation onset and right before response onset, several IC clusters showed event-related desynchronization (ERD) in alpha and beta bands. ERD in the parietal and occipital regions could be explained by visual-spatial attention to the lane departure event, while ERD in the somatomotor regions is associated with motor responses during compensatory steering. Therefore, the absence or delay of ERD could be used as an index to drowsiness. In addition, the strength of ERD was stronger in the motion condition than that in the motionless condition. After response onset, several IC clusters showed event-related synchronization (ERS) or rebound in alpha and beta bands. The presence of ERS in multiple IC clusters after response offset could be interpreted as a state of relaxation of the driver after the car returns to cruising position. To summarize, this study demonstrates a framework for analyzing
54
event-related brain dynamics during simulated driving. The tonic and phasic EEG patterns reported here could serve as foundation for studying brain dynamics of more complicated tasks during real-life driving.
55
Reference
[1] A. Pack, A. Pack, E. Rodgman et al., “Characteristics of crashes attributed to the driver having fallen asleep,” Accident; analysis and prevention, vol. 27, no. 6, pp. 769, 1995.
[2] J. Horne, and L. Reyner, “Driver sleepiness,” Journal of sleep research, vol. 4, no. s2, pp. 23-29, 1995.
[3] J. Horne, and L. Reyner, “Sleep related vehicle accidents,” British Medical
Journal, vol. 310, no. 6979, pp. 565-567, 1995.
[4] G. Kecklund, and T. kerstedt, “Sleepiness in long distance truck driving: an ambulatory EEG study of night driving,” Ergonomics, vol. 36, no. 9, pp. 1007-1017, 1993.
[5] P. Thiffault, and J. Bergeron, “Monotony of road environment and driver fatigue: a simulator study,” Accident Analysis & Prevention, vol. 35, no. 3, pp. 381-391, 2003.
[6] T. Akerstedt, “Work hours and sleepiness,” Neurophysiologie Clinique/Clinical
Neurophysiology, vol. 25, no. 6, pp. 367-375, 1995.
[7] Q. Ji, and X. Yang, “Real-time eye, gaze, and face pose tracking for monitoring driver vigilance,” Real-Time Imaging, vol. 8, no. 5, pp. 357-377, 2002.
[8] J. McCall, and M. Trivedi, "Performance evaluation of a vision based lane tracker designed for driver assistance systems." pp. 153-158.
[9] K. Kozak, J. Pohl, W. Birk et al., "Evaluation of lane departure warnings for drowsy drivers."
[10] N. Galley, R. Schleicher, and L. Galley, “Blink parameters as indicators of driver's sleepiness–possibilities and limitations,” Vision in vehicles. Amsterdam: Elsevier, 2004.
![Fig. 2-1 Illustration of the event-related lane-departure paradigm [22].](https://thumb-ap.123doks.com/thumbv2/9libinfo/8491685.184713/18.892.137.804.120.304/fig-illustration-event-related-lane-departure-paradigm.webp)