PERGAMON Carbon 39 (2001) 523–534
Effects of pore structure and temperature on VOC adsorption
on activated carbon
a ,
*
b cYu-Chun Chiang
, Pen-Chi Chiang , Chin-Pao Huang
a
Department of Mechanical Engineering, Yuan Ze University, 135 Yuan-Tung Rd., Chung-Li, Taoyuan, Taiwan
b
Graduate Institute of Environmental Engineering, National Taiwan University, 71 Chou-Shan Rd., Taipei, Taiwan
c
Department of Civil and Environmental Engineering, University of Delaware, Newark, DE 19716, USA Received 19 February 2000; accepted 9 June 2000
Abstract
This research was undertaken to investigate the pore structure of three activated carbons and determine the temperature dependence of the adsorption of VOCs onto activated carbon. Three kinds of activated carbon made of different raw materials and four VOC species were chosen. The microporosity of activated carbon was assessed by the pore size distribution. The adsorption of VOCs showed that only C H exhibited the activated entry effect. The VOC adsorption6 6 capacity of peat-derived carbon was less dependent on temperature. A characteristic curve was observed for the peat-derived carbon. Benzene adsorption was the most preferable compared to other three VOCs because of higher heats of adsorption and lower entropy change. Results indicate physical adsorption played a critical role during adsorption processes in this study system. 2001 Elsevier Science Ltd. All rights reserved.
Keywords: A. Activated carbon; C. Adsorption, BET surface area; D. Porosity, Thermodynamic properties
1. Introduction structure of porous activated carbons. According to the BET classification of isotherm, in general, adsorption on Due to ubiquity in the environment and risk to human porous solids would belong to the Type IV isotherm [1], health, volatile organic compounds (VOCs) have received which is characterized by a hysteresis loop. de Boer [2] great attention in the field of environmental control. The first proposed five major distinct hysteresis loops. The adsorption of VOCs onto porous adsorbents, such as IUPAC (International Union of Pure & Applied Chemistry) activated carbons, has been suggested as an innovative later recommended a different classification system and treatment technology. Activated carbon adsorption has categorized hysteresis loops into four groups, Type H1, been considered to be one of the promising methods for H2, H3 and H4 [3]. The lower closure point of the controlling VOCs of low concentrations with potential to hysteresis loop occurs at a relative pressure which is recover valuable vapors. Activated carbon characterized almost independent of the nature of adsorbent but mainly with heterogeneously porous structures, generally, can be relies on the properties of the adsorbate. For example, it made from a variety of raw materials such as peat, coal, occurs at P/P 60.42 for nitrogen at 77 K and at P/o
nut shell, lignite, saw dust, and synthetic polymers. P 60.28 for benzene at 298 K [4].o
The adsorption capacity of activated carbon depends The profile of hysteresis loop is closely related to both strongly on its surface microstructure. Consequently, in- the shapes of pores and the pore size distribution. Kelvin formation on the surface characteristics of activated carbon was the first to calculate the pore size using a cylindrical is important to adsorption process design. To date, ad- model [1]. However, the Kelvin equation is only applicable sorption isotherms of inert gases, such as nitrogen and in the range of P/P .0.42. In order to predict the poreo
argon, are the most widely used to determine the physical size distribution under low pressure conditions, Lippens and de Boer [5] developed the t-method which was later modified by Mikhail et al. [6] proposing the micropore *Corresponding author. Tel.: 1886-3-463-8800 ext. 476; fax:
method, MP-method. Horvath and Kawazoe [7] based on 1886-3-455-8013.
E-mail address: [email protected] (Y.-C. Chiang). the concept of average potential function, developed a slit 0008-6223 / 01 / $ – see front matter 2001 Elsevier Science Ltd. All rights reserved.
model for predicting the pore size distribution in micropore of benzene adsorption on coconut shell-derived carbon carbons; however, the model failed to predict the pore size modified by ozonation. It was reported that when the distribution of larger pores. temperature increased from 283 to 393 K and at an inflow Gas adsorption at the solid surface is a spontaneous concentration of 5000 ppm, the uptake of benzene on process when the change in free energy, DG, of the system non-modified carbon was reduced by 28% only, while that decreases. Since the adsorbed gas is less mobile than its on the modified carbon was decreased by 40%. Apparent-gaseous state, the entropy change, DS, is negative [8]. At a ly, the modified activated carbon has larger micropore given relative pressure and under most circumstances, the volume; therefore, it is temperature-dependent.
amount of gas adsorbed decreases with increasing tempera- Temperature plays an important role on the design of ture. However, some researchers have observed that the adsorption system. This research was initiated to study the adsorbed amount at a given temperature is larger than that temperature dependence of the adsorption of volatile measured at a lower temperature in the same gas / solid organic compounds (VOCs) by various activated carbon system. This behavior, defined as the activated entry effect, adsorbents. It was also to determine the thermodynamic is responsible for the temperature-dependent nature of parameters, such as heat of adsorption and entropy change, equilibrium adsorption [9]. This abnormal phenomenon is for different gas / solid systems, as a means to shed light on speculated as caused by the diffusion of gas molecules the mechanisms of the adsorption process.
through narrow constrictions into micropores, where the rate of entry into the pores will have a positive temperature
coefficient. At a sufficiently high temperature, the ap- 2. Experimental methods
proach to equilibrium will be fast enough so that the gas
uptake will decrease as the temperature increases. 2.1. Materials At constant pressure the heat evolved is usually
consid-ered the heat of adsorption, DH, which is also a measure- Three different types of activated carbon made of ment of the interactions between adsorbate molecules and different raw materials were used in this study. Sorbonorit adsorbent lattice atoms. The heat of adsorption is associ- 3 (designated as carbon A), a peat-derived carbon from ated with the adsorption equilibrium constant, K, by the Norit (Netherlands), is pelletized and has a diameter of 3 van’t Hoff equation: mm. Filtrasorb 400 (designated as carbon B), supplied by Calgon (Pittsburgh, USA) and made of bituminous coal, is granular with a size of 12 / 40 mesh (0.915 mm). Unicarb
DH ]
K 5 K exp0
S
2D
(1) (designated as carbon C), a coconut shell-derived carbon RTof granular form with a size of 4 / 8 mesh (3.57 mm), is Note that Eq. (1) is applicable to ideal gas only. Conse- provided by Liangchien (Taiwan). All activated carbon quently, by plotting K against 1 /T, DH can be determined. samples were pretreated at 2508C in an oven purged with Chihara et al. [10] found that there was a linear relation- pure nitrogen gas in vacuo overnight for removing the ship between the heats of adsorption and the carbon moisture and other contaminants prior to experiments. A numbers in the hydrocarbon-activated carbon adsorption total of four volatile organic compounds including carbon system. In addition, it was reported that the heat of tetrachloride (CCl ),4 chloroform (CHCl ),3 benzene adsorption in molecular sieve carbon (MSC) was 2.6 times (C H ), and methylene chloride (CH Cl ) were studied.6 6 2 2 to the heats of vaporization of the corresponding adsorbate Carbon tetrachloride and benzene are typically non-polar [10]. This value was twice as large as that of graphitized and inert compounds, and have been extensively studied. thermal carbon black. The result can be attributed to the Both chloroform and methylene chloride are common enhanced interactions between the adsorbates and the polar volatile chemical derivatives of carbon tetrachloride. carbon layers in MSC. Table 1 summarises some chemical properties of those
Findenegg and Liphard [11] studied the adsorption of adsorbates. higher n-alkanes (C –C ) from dilute solutions of16 32
nonpolar organic solvents onto graphitized carbon. They 2.2. Methods found that the enthalpy of adsorption was a function of the
fraction of surface covered. Meanwhile, the enthalpy of 2.2.1. Adsorption isotherms of inert gases
adsorption increased at higher surface concentration due to Adsorption isotherms of nitrogen and argon, as well as lateral interactions from close-packed adsorbates. Tsai [12] the amount of mercury intrusion were obtained as to observed the temperature effect on the adsorption of analyze the surface structure characteristics of activated chlorinated volatile organic compounds and suggested that carbon. Adsorption isotherms of nitrogen and argon gases when the temperature increased from 283 to 313 K and at were measured using the ASAP 2000 system (accelerated an inflow concentration of 440 ppm, the uptake of methyl- surface area and porosimetry system, V2.02, 1992). Before ene chloride on activated carbon BPL was reduced by measurements, the activated carbon samples were degassed 60%. Chiang [13] investigated the temperature dependence at 2508C. To determine the characteristics of macro- and
Table 1
Summary of the characteristics of adsorbates
Adsorbate CAS Molecular Boiling Dipole Liquid Cross
No. weight point moment density sectional
23 2 (K) (Debyes) (g cm ) area (nm ) CCl4 56-23-5 153.82 349.9 0 1.584 (298 K) 0.32 CHCl3 67-66-3 119.38 334.3 1.1 1.489 (293 K) 0.28 C H6 6 71-43-2 78.11 353.2 0 0.885 (289 K) 0.43 CH Cl2 2 75-09-2 84.93 313.0 1.8 1.317 (298 K) 0.25
meso-pores ( .2 nm), adsorption–desorption isotherm of to 353 K, was controlled by a water bath. The pure liquid the nitrogen gas at 77 K was recorded against different adsorbate, contained in a volumetric flask, was immersed relative pressures, lasting about 12 h. A similar experimen- in a separate water bath. Purging the nitrogen gas over the tal approach was also employed for the analysis of pure liquid adsorbate generated the VOC vapor continuous-micropores ( ,2 nm) except replacing the nitrogen gas ly. The VOC concentration depended on the flow rate of with the argon gas. At relative pressures were below 0.001, the nitrogen gas and the temperature of the water bath. The the adsorption isotherm was obtained by an active mode VOC concentration was monitored by gas chromatography
3 21
using 3.00 cm g dose amount (ASAP 2000, V3.00, with a flame ionization detector (HP 5890 serious II with a 1993). In addition, the amounts of mercury intrusion into VOCOLE capillary column). In this study, the concen-pores were measured with a mercury porosimeter, Auto- tration of VOCs was controlled at about 400 ppmv. The pore II 9220 V1.05. The mercury has a contact angle of nitrogen gas carried the VOC vapor into the U-shaped
21
130 degrees and the surface tension of 485 dyne cm . glass tube containing weighted activated carbon sample. The range of applied pressure was from 0 to 380 MPa [14]. The contact time of VOC vapor and activated carbon sample was 24 h [18]. The amount VOC adsorbed was determined by weighing the activated carbon sample 2.2.2. Density analysis
before and after adsorption process. The relative standard The determinations of density followed the procedures
deviation of this experimental procedure was about 5.4%. of Smisek [15] and Jankowska [16]. The true density ( rHe)
of activated carbon was determined by gas pycnometer (Accupyc 1330, Micromeritics), using helium gas at a
3
pressure of 20 psia. An activated carbon sample (10 cm )
3. Results and discussion
was weighted and pre-conditioned several times with helium gas before measurements. Then the mean value of
3.1. Adsorption isotherms of nitrogen 10 runs for each sample was calculated. The apparent
density ( rHg) of activated carbon was analyzed utilizing
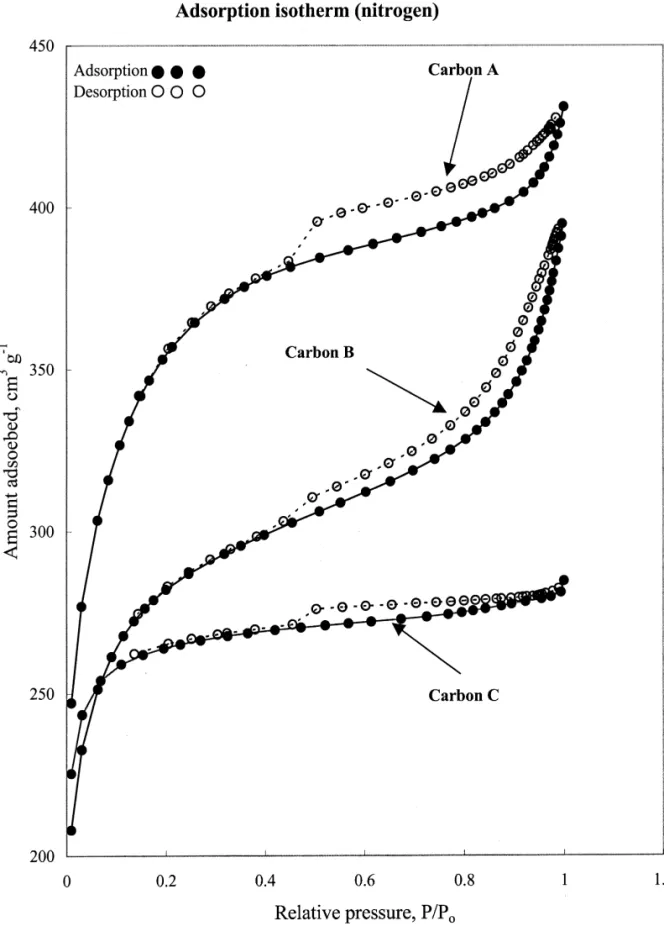
Fig. 1 shows the adsorption–desorption isotherms of mercury intrusion technology, which was based on the
nitrogen at 77 K on carbons A, B and C. All isotherms assumption that mercury does not penetrate into the pores
exhibit a Type IV profile according to the BET classifica-with a diameter less than 15,000 nm at 1 atm. The
tion. Each isotherm shows a distinct hysteresis loop, which apparatus of this method was simple and easy to operate,
is characteristic of porous adsorbents. This phenomenon is but the result was slightly dependent on the shape of
associated with capillary condensation in mesopores [19]. activated carbons. Once the true density and apparent
The lower end of the hysteresis loop in each isotherm density were determined, the total pore volume (Vpore) and
approximately occurs at a relative pressure of 0.4, in porosity (e) could be determined by the following
equa-accordance with the findings reported in literature [4]. It tions:
also means that the capillary condensation might start from
1 1 the pore size at about 3 nm. The hysteresis loop of carbon
] ]
Vpore5r 2r (2)
B is significantly indicative of Type H3 profile, which is
Hg He
associated with aggregates of plate-like particles or
slit-e 5 1 2 (r /r ) (3) shaped pores. The Type H4 loop occurs in the isotherms of
Hg He
Carbon A and Carbon C, which explicates the nature of 2.2.3. VOCs adsorption experiments their narrow slit-like pores. The isotherms reveal that The VOC adsorption experiments followed the ASTM multilayer adsorption in Carbon A is not so significant as D3467-94 method for the determination of carbon tetra- in Carbon B. On the other hand, having a Langmuir-type chloride activity [17]. A given amount of activated carbon isotherm, nitrogen adsorption on Carbon C is approximate-(ca. 300 mg) was weighed and placed into a U-shaped ly monolayer. Accordingly, it is speculated that Carbon A glass tube. The adsorption temperature, ranging from 278 provides an excellent adsorption capacity; Carbon B
should have a larger mean pore size; Carbon C has a the Kelvin equation and the mercury porosimetry was narrow pore size distribution and a small mean pore size. used. Table 3 gives details of surface pore characteristics of activated carbons. It is seen that Carbon B has a broad 3.2. Surface area pore volume distribution. However, the pore volumes of micropore and mesopore of Carbons A and C are much Table 2 gives the specific surface areas of activated predominant than their macropore volumes. Specifically, carbons calculated by various equations, e.g., BET and the percentage of micropore volume of Carbon C was Langmuir. It was observed that the BET equation only 84%. This is indicative of the microporosity. Due to high applied in the range of relative pressure of P/P ,0.14.o mesopore and macropore volumes, Carbon B possesses a This finding implies that the pore size distribution might be large mean pore size. The mesopore volume appears to be skew toward to the smaller end. The C values of the BET associated with the size profile of the hysteresis loop, equation for all carbons are greater than 100. Wherein the which suggests that the capillary condensation should be in coconut shell-derived carbon (Carbon C), having a specific mesopores. Generally, the sum of the percentages of
2 21
surface area of 975 m g , has the highest C value of 761 micropore and mesopore volumes for all three carbons over a range of relative pressures from 0.01 to 0.08. The C exceeds 95%, which should bring about Langmuir iso-value is related to the enthalpy of adsorption in the first therm. Furthermore, the nature of porosity was determined adsorbed layer. Although it does not give a quantitative by the measurements of true density and apparent density measurement of the enthalpy of adsorption, it is an (Table 3). It is noted that the apparent density of Carbon B
23
indication of the magnitudes of the adsorbent–adsorbate is high at 1.25 g cm and its total pore volume is only
3 21
interaction energy [4]. Apparently, the interaction energy 0.344 cm g , which makes Carbon B different from the between the adsorbent and adsorbate for Carbon C is other two carbons. Because of smaller particle sizes, this stronger than Carbon A. This observation could be inter- might be attributed to the fact that the capillary condensa-preted by the microporosity of Carbon C which is made tion in the inter-particles gives extra capacities for mercury from coconut shell as indicated by the sharp knee in the intrusion. Consequently, the bituminous coal-derived car-isotherm. The Langmuir equation only describes mathe- bon has a broader pore size distribution, the coconut matically Type I isotherms. Therefore, only for Carbon C shell-derived carbon is obviously microporous, and the can it make sense. Table 2 also shows the ratio of the peat-derived carbon has a marked adsorption capacity due monolayer adsorbed amount obtained from the BET to its high pore volume.
equation to that obtained from the Langmuir equation for
Carbon C. This ratio is close to unity, which indicates that 3.4. Activated entry effect micropores contribute the primary adsorption capacity of
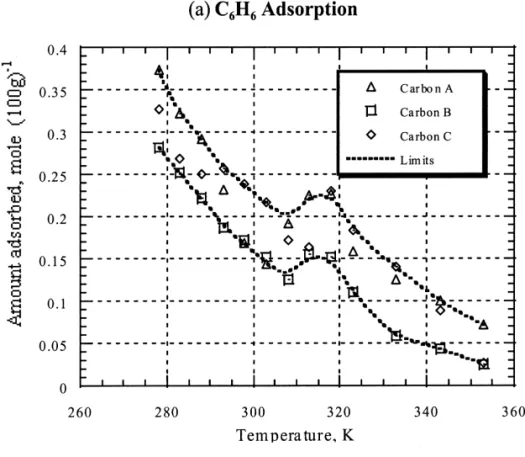
Carbon C with a narrow pore size distribution. This is Fig. 2 shows clearly that at a given VOC concentration, consistent with the above-mentioned findings. the VOC adsorbed amount decreases as the temperature increases. Fig. 2(a) illustrates the benzene adsorption on 3.3. Characteristics of porosity three activated carbons. It is noted that for all three activated carbons, there exists an adsorption hill at the Since none of the current methods is capable of pro- temperature of about 313 K. However, in the case of CCl ,4
viding a measurement of the pore size distribution over the CHCl and CH Cl , as shown in Fig. 2(b), this adsorption3 2 2 whole relative pressure range, an integrated approach hill was absent. Benzene is a disc-like molecule [20] with a
2
consisting of the Horvath and Kawazoe (H–K) method, cross-sectional area of 0.43 nm which is apparently Table 2
a
Summary of specific surface areas of three activated carbons and the related information calculated from BET and Langmuir equations
b
Activated BET method Langmuir method VmB/VmL
c d e f carbon P/Po SB C VmB SL VmL 2 21 3 21 2 21 3 21 range (m g ) (cm g ) (m g ) (cm g ) Carbon A 0.05–0.14 1472 126 397 – – – Carbon B 0.05–0.12 1027 361 277 – – – Carbon C 0.01–0.08 975 761 263 1196 323 0.81 a
The parameter estimations are determined by the adsorption isotherms of argon gas.
b
Applied to Carbon C only.
c
S : The specific surface area calculated from the BET equation.B d
VmB: Monolayer adsorption capacity calculated from the BET equation.
e
S : The specific surface area calculated from the Langmuir equation.L f
Table 3
Summary of surface pore characteristics of activated carbons
f g
Activated Pore volume Mean pore True Apparent Vpore Porosity
3 21 e 3 21
carbon (cm g ) size , v (nm) density, density, (cm g ) e (%)
a b c d 23 23
Vmicro Vmeso Vmacro Vtotal rHe (g cm ) rHe (g cm )
Carbon A 0.515 0.255 0.015 0.785 1.524 2.27 0.88 0.697 61 (66%) (32%) (2%) Carbon B 0.380 0.258 0.028 0.665 1.794 2.19 1.25 0.344 43 (57%) (39%) (4%) Carbon C 0.353 0.057 0.007 0.417 1.394 2.07 0.99 0.525 52 (84%) (14%) (2%) a
Micropore volume estimated from Horvath and Kawazoe method.
b
Mesopore volume estimated from Kelvin equation.
c
Macropore volume estimated from mercury intrusion method.
d
Total pore volume summed up by Vmicro, Vmesoand Vmacro.
e
Mean pore size calculated from the equation of v 5 4 3 Vs total/S .Ld
f
Pore volume calculated from the equation of Vpore51 /rHg21 /r .He g
Porosity calculated from the equation of e 5 1 2 r /r .
Hg He
different from the molecular structure of the other com- example, at 278 K the amounts of benzene adsorbed on pounds [21]. As a result, this adsorption hill occurred on activated carbons were almost twice as those at 298 K, benzene adsorption could be attributed to the activated regardless of the types of activated carbon. This can be entry effect. Specifically, the rise in temperature facilitates attributed to physical adsorption being predominant in low the diffusion of benzene molecules, which helps to propel temperature ranges. However, in high temperature ranges, the benzene molecules through narrow constrictions in the chemical interactions between activated carbon and VOC micropore network. Subsequently, the adsorption capacity take place. The adsorptive capacity of carbon A (the
is enhanced. peat-derived carbon) was markedly superior to other
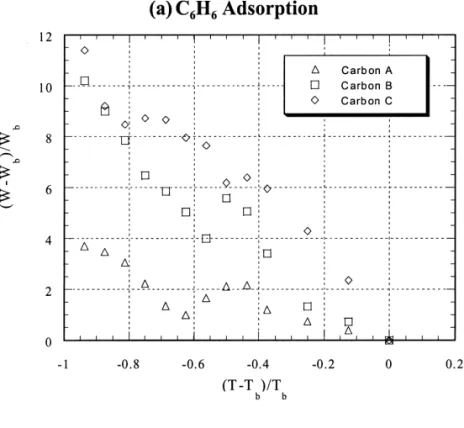
carbons, e.g., carbon C (the coconut shell-derived carbon). 3.5. Adsorption characteristic curve As mentioned above, Carbon C has a micropore volume greater than that of carbon A. It was also found that the Since liquid-like condensation plays a role in VOC adsorbed amount of VOC on carbon A was inversely adsorption on activated carbon, the boiling point of VOC proportional to the dipole moment especially at high would be an important factor. Fig. 3(a) gives a plot of temperatures. Consequently, the more polar the adsorbate, (W 2 W ) /Wb b versus (T 2 T ) /Tb b for the adsorption of the greater the adsorbed amount is affected by temperature. benzene onto three activated carbons. Results indicate that
there is a distinct divergence in the lower temperature 3.6. Thermodynamic parameters ranges for benzene adsorption. Since chemical adsorption
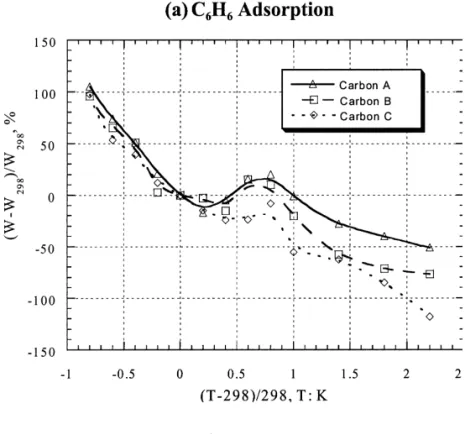
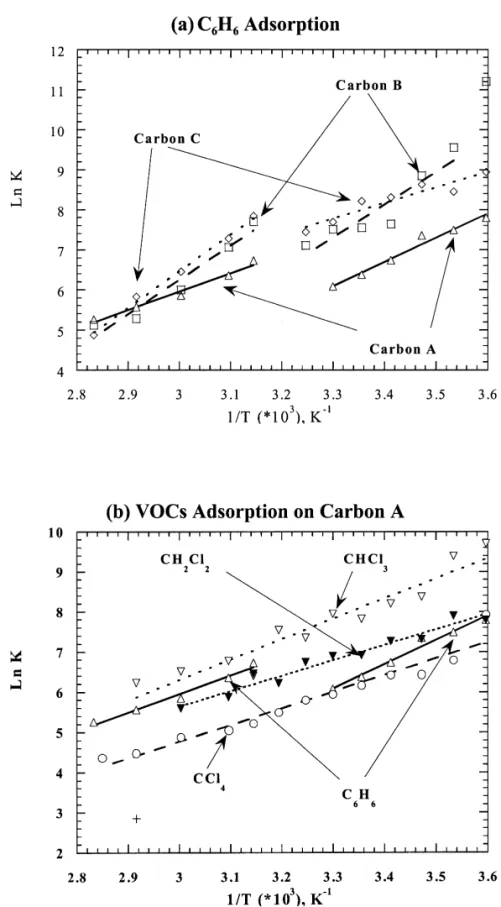
could be negligible at low temperatures, the surface Fig. 5(a) presents the van’t Hoff plots of benzene structural characteristics of activated carbon should be the adsorption. Two distinct linear segments were identified in major factor controlling the adsorption process. Fig. 3(b) the low temperature range from 278 K to 303 K and the shows the adsorption of four selected VOCs onto Carbon high temperature region from 318 K to 353 K. In the low A using the plot of (W 2 W ) /W versus (T 2 T ) /T , andb b b b temperature range, the heat of benzene adsorption on the observations are induced to a characteristic curve. carbon B was the highest and almost twice as that of From this characteristic curve, it is possible to predict the adsorption on carbon C. For carbons A and B, the heat of adsorption density of VOC by a specific activated carbon adsorption was nearly identical in the two temperature at any temperature. regions. But for activated carbon C, the heat of adsorption It is further noted that the dimensionless temperature in the high temperature region was obviously greater than with respect to boiling point is not readily available for that in the low temperature. The result implies that the multi-component systems due to lack of information on the adsorption potential for the carbons with predominant lump of boiling points of VOCs. Consequently, the micropores is greatly increased at high temperatures. dimensionless temperature with respect to the room tem- However, the heats of adsorption for CCl , CHCl4 3 and perature (298 K) is intended. Fig. 4 gives plots of (W 2 CH Cl2 2 on Carbon A remain constant over the whole W298) /W298 versus (T 2 T298) /T298. It is noted that in the temperature range [Figs. 5(b)].
low temperature range, benzene adsorption on activated Table 4 lists the heats of adsorption and entropy changes carbons is independent of the type of activated carbon. For for the adsorption processes of VOCs onto activated
25 21
Fig. 3. Dimensionless plot of adsorption density (W ) versus temperature (T ) based on the boiling point of VOC (T ). Note: W is theb b
25 21
adsorption density at T . VOC concentration was about 1.7310b mol l at 298 K.
carbons. The difference in adsorption energy between entry effect. Generally, a high heat of adsorption means benzene and other selected VOCs may be related to the strong interactions between the adsorbent and adsorbate non-equilibrium adsorption of benzene caused by activated molecules. In the high temperature region, although
ben-Fig. 4. Dimensionless plot of adsorption density (W ) versus temperature (T ) based on room temperature (298 K). Note: W298 is the
25 21
adsorption density at 298 K. VOC concentration was about 1.7310 mol l at 298 K.
21 zene adsorption on carbons B and C yields high heat of A, the heats of adsorption are close to 40 kJ mol which adsorption, their adsorption capacities are less than that on implies physical adsorption as the predominant mechanism carbon A. This clearly shows that physical adsorption for adsorption processes.
plays an important role on benzene adsorption. In the Table 4 also shows the change of entropy for each adsorption of C H , CCl , CHCl and CH Cl on carbon6 6 4 3 2 2 system. It was observed that the adsorbed amount was
Fig. 5. Van’t Hoff plots of VOC adsorption on activated carbons. (a) Benzene adsorption on three activated carbons. (b) Four VOC adsorption on carbon A.
related to the entropy change. For the adsorption of temperature region. This is consistent with the general benzene on activated carbon A, the entropy change in the premise that the system becomes more energetic when the high temperature region was smaller than that in the low temperature increases. In the case of benzene adsorption on
Table 4
Summary of thermodynamic parameters regarding the VOCs adsorption on activated carbons
21 21 21
Activated VOC 2DH (kJ moler ) 2DS (kJ K mole )
carbon I (low T ) II (high T ) III (whole) I (low T ) II (high T ) III (whole)
B C H6 6 68.41 71.13 – 0.163 0.163 – C C H6 6 32.84 76.36 – 0.042 0.176 – A C H6 6 50.12 38.03 – 0.113 0.063 – A CCl4 – – 34.43 – – 0.063 A CHCl3 – – 42.13 – – 0.075 A CH Cl2 2 – – 31.71 – – 0.050
activated carbon B, the entropy change before and after ly temperature-dependent. An adsorption characteristic adsorption processes was not sensitive to temperature. curve of peat-derived activated carbon was established for However, for the case of benzene adsorption on activated predicting the VOC adsorption capacities. Considering the carbon C, the heat of adsorption increased twice and the heat of adsorption and the entropy change for each entropy change also increased when the temperature adsorption system, the physical adsorption was the pre-increased. This was indicative of increasing the degree of dominant mechanism in the adsorption process. At high interactions between benzene and carbon C as temperature temperature, the benzene adsorption on bituminous coal increased. At the meantime, the system gradually ap- and coconut shell-derived activated carbons increased proached to steady state. Nevertheless, the benzene ad- which implied the enhancement of the interactions between sorption decreased significantly which implied that phys- benzene molecules and the activated carbon. Nevertheless, ical adsorption was predominant mechanism. For CCl ,4 the increase from these interactions on adsorbed amount CHCl3 and CH Cl , the higher the degree of chlorine2 2 was negligible as compared to the actions of physical substitution, the less the dipole moment. The heat of adsorption.
adsorption or entropy change for these VOCs on Carbon A did not change in order of their properties, however.
Benzene adsorption was more preferable than other
Acknowledgements
VOC species as indicated by its large heat of adsorption and entropy change. The vibrations of heat of adsorption
The authors express their sincere thanks to the National and entropy change caused by temperature change suggest
Science Council, Taiwan, ROC for its financial support that physical adsorption is the predominant VOC
ad-(Contract no. NSC 86-2221-E-002-071) of this study. sorption mechanism. However, results also reveal an
enhancement of interactions between VOC species and activated carbons in the high temperature range.
References 4. Conclusions
[1] Gregg SJ, Sing KSW. Adsorption, surface area and porosity, 1st ed, London: Academic Press, 1967.
The adsorption–desorption isotherms of nitrogen gas [2] de Boer JH. The structure and properties of porous materials, implies that the nature of the pores on bituminous coal- London: Butterworth, 1958.
derived carbon was slit-shaped capillaries or resulted from [3] Zhdanov VP. Application of percolation theory to describing aggregates of the plate-like particles; however, the peat- kinetic processes in porous solids. Adv Catal 1993;39:1–50. derived carbon and the coconut shell-derived carbon [4] Sing KSW, Everett DH, Haul RAW, Moscou L, Pierotti RA, Rouquerol J, Siemieniewska T. Reporting physisorption data possessed much narrow and slit-like pores. The adsorption
for gas / solid systems with special reference to the de-occurring in mesopores was associated with capillary
termination of surface area and porosity. Pure Appl Chem condensation. The C value of BET equation interpreting
1985;57(4):603–19. the interaction energy between adsorbent and adsorbate
[5] Lippens BC, de Boer JH. Studies on pore systems in molecules is indicative of microporosity of coconut
shell-catalysts V. The t-method. J Catal 1965;4:319–23. derived carbon. Over 95% of pore volume was located in
[6] Mikhail RS, Brunauer S, Bodor EE. Investigations of a micropores and mesopores for all activated carbons complete pore structure analysis. J Coll Inter Sci studied. Due to the difference in molecular structure 1968;26:45–53.
among VOC species, only C H6 6 adsorption signified the [7] Horvath G, Kawazoe K. Method for calculation of effective activated entry effect. The benzene adsorption on the pore size distribution in molecular sieve carbon. J Chem Eng activated carbon with high micropore volume was obvious- Jap 1983;16:470–5.
[8] Tompkins FC. Chemisorption of gases on metals, New York: [16] Jankowska H, Swiatkowski A, Choma J. Active carbon, New
Academic Press, 1978. York: Ellis Horwood, 1991.
[9] Gregg SJ, Sing KSW. Adsorption, surface area and porosity, [17] Annual book of ASTM standards, vol. 15.05, Philadelphia, 2nd ed, London: Academic Press, 1982. PA: American Society for Testing and Materials, 1996. [10] Chihara K, Suzuki M, Kawazoe K. Adsorption rate on [18] Chiang PC. Effects of physicochemical characterizations of
molecular sieving carbon by chromatography. AIChE J activated carbons on adsorption and / or desorption of
hazard-1978;24:237–45. ous air pollutants. In: Technical report, Taipei, Taiwan:
[11] Findenegg GH, Liphard M. Adsorption from solution of National Science Council, 1998, NSC 86-2221-E-002-071. large alkane and related molecules onto graphitized carbon. [19] Warhurst AM, Fowler GD, McConnachie GL, Pollard SJT.
Carbon 1987;25:119–28. Pore structure and adsorption characteristics of steam
[12] Tsai WT. Study of activated carbon adsorption and catalyst pyrolysis carbons from moringa oleifera. Carbon combustion of VOCs. In: PhD thesis, Taipei, Taiwan: 1997;35:1039–45.
National Taiwan University, 1994. [20] Rodriguez-Reinoso F. The role of carbon materials in [13] Chiang HL. Influences of physicochemical properties of heterogeneous catalysis. Carbon 1998;36:159–75.
activated carbon on VOC adsorption. In: PhD thesis, Taipei, [21] McClellan AL, Harnsberger HF. Cross-sectional areas of Taiwan: National Taiwan University, 1995. molecules adsorbed on solid surfaces. J Coll Inter Sci [14] Adamson AW. Physical chemistry of surfaces, New York: 1967;23:577–99.
John Wiley, 1982.
[15] Smisek M. Active carbon: manufacture, properties and applications, New York: Elsevier, 1970.