行政院國家科學委員會專題研究計畫 成果報告
集團企業的繼承與創新(第 3 年)
研究成果報告(完整版)
計 畫 類 別 : 個別型 計 畫 編 號 : NSC 98-2410-H-004-048-MY3 執 行 期 間 : 100 年 08 月 01 日至 101 年 07 月 31 日 執 行 單 位 : 國立政治大學科技管理研究所 計 畫 主 持 人 : 溫肇東 計畫參與人員: 博士班研究生-兼任助理人員:莊皓鈞 報 告 附 件 : 赴大陸地區研究心得報告 公 開 資 訊 : 本計畫涉及專利或其他智慧財產權,2 年後可公開查詢中 華 民 國 101 年 11 月 30 日
中 文 摘 要 : 本研究發現,隸屬集團將有助於公司的創新,而家族企業雖 傾向較非家族企業創新,但隸屬於集團的家族企業卻較隸屬 於集團的非家族企業較不創新,再深入分析發現,家族集團 非交叉持股型、及具有超額控制權的企業是屬於較不創新的 一群,但隸屬於集團的非家族企業則較會利用超額控制權來 有效分散風險、增加創新。 中文關鍵詞: 創新、家族偏好、集團子公司、代理成本、風險分散 英 文 摘 要 : 英文關鍵詞:
1
INTRODUCTION
In this study, we attempt to make a contribution to the literatures on the corporate
governance and innovation. Innovation has been considered as a source of
competitive advantage for an enterprise (Sundaram, John, & John, 1996). However,
agency costs are often the impediment for a large corporation to do innovative
projects (Holmstrom, 1989). In order to solve this problem, Francis and Smith (1995)
empirically prove that concentrated ownership monitoring is an effective means to
alleviate the high agency costs associated with innovation. Unfortunately, there
remains a lack of consistent results with regard to the effect of ownership structure on
innovation (Belloc, 2011).
Revisiting Holmstrom’s (1989) work on agency cost and innovation, we can find that
the possible missing link between corporate governance and innovation may be
caused by the omitting of a large shareholder’s risk preference and ability to share risk.
For group-affiliated firms in pyramidal groups the divergence between voting rights
and cash flow rights is often high. This arrangement of ownership structure allows
their ultimate controllers control a firm and share risk simultaneously.
Traditionally, the studies of corporate governance only focus on the costs of agency
problems (Villalonga & Amit, 2006) while omitting the advantage of risk sharing on
venturous investments, like innovative projects. While Admati, Pfleiderer, & Zechner
(1994) point out that concentrated ownership not only encourages a high rate of
monitoring by large shareholders but leads to a potential loss of risk-sharing benefits
that usually requires diffused shareholders. When the effectiveness of large
shareholders’ monitoring does not increase with their holdings, large shareholders will
2
risk-sharing purposes. Accordingly, large publicly traded firms which are
characterized as highly diffuse ownership structures are supposed to have the
preference to invest in riskier and more innovative projects.
Along the same vein, we suggest that the arrangement of pyramidal structure may not
for the purpose of appropriation but for risk-sharing benefits. Pyramidal groups are
often featured as high divergence between voting rights and cash flow right. This
contingence provides us a good field to test our conjectures.
Our empirical analysis is conducted using Top 3000 public manufacturing firms in
Taiwan between 2000 and 2005. And we collect these firm’s patent data, which is
granted by United States Patent and Trademark Office, to measure their
innovativeness. The results confirm our conjecture that pyramidal control mechanism
is for the purpose of risk sharing. We also find that family businesses are risk averted
while they have the propensity to do innovation for the sake of their longer investment
horizons.
THEORY AND HYPOTHESES Family preference and innovation
Until now, there is weak agreement and understanding about the relationship between
family preferences and innovative investments. Firstly because of long-payoff horizon
and risk (Holmstrom, 1989; Lee & O'Neill, 2003), a family will be reluctant to bet its
reputation and wealth of innovative projects (Dyer & Whetten, 2006). Moreover,
innovative projects are also characterized as complexity and costly and need the
involvement of outside experts and venture capitalists. But it’s hard for a family to
cede its control rights. Thu, investments with long-term uncertain payoffs are seen by
3 & Kintana, 2010).
On the other hand, innovation has been considered as a source of competitive
advantage for an enterprise (Sundaram et al., 1996). Although R&D investments
provide long-term benefits (Del Monte & Papagni, 2003; Hall, 1932), professional
managers of large public firms do not have the incentive to invest in innovative
projects because it’s more costly than routines. But the presence of a large, controlling
shareholder like a family, can influence investment decisions from the long-horizon
perspective and mitigate myopic loss aversion (Shleifer & Vishny, 1986). According
to the discussions above, we suggest the following competitive hypotheses:
H1a: Risk-averse firms will have less innovation.
H1b: Risk-taking firms will have more innovation. Ownership structure, risk preference and innovation Expropriation Perspective
The separation of ownership and control is the root of agency problems. In United
State, widely held firms are the archetype of large corporations. Because dispersed
ownership reduce shareholders’ incentives to monitor professional managers, the rise
of large corporations often accompany with the concentrated power of professional
managers (Berle & Means, 1932). The separations of interests between managers and
shareholders then cause the so-called principle-agent problems.
Holmstrom (1989) argues that agency problem can be a critical obstruction for large
firms to invest in innovative projects. Within a firm, it is costly to monitor and
4
pressures from the capital market influence a firm’s risk-taking behavior; past
performances determine whether a firm can get new capital from the capital market.
Thus, large public firms would rather avoid investing in innovative yet risky projects.
The agency problems in business groups stem from high diversion of cash flows. La
Porta, Lopez-de-Silanes, and Shleifer (1999) show that most large corporations
around the world have controlling owners and control pyramids are ubiquitous.
Although control pyramids can be taken as devices for circumventing inadequate
institutions – this argument implicitly presumes that the controlling shareholder’s
allocation of resources across groups are efficient enough – the ownership structure
might also cause conflicts of interests between controlling and minority shareholders.
Control pyramids allow the controlling shareholders to secure control rights without
commensurate cash flow rights. Therefore, controlling shareholders share only a small
part of monetary payoffs but retain all of the private benefits in any investment. This
situation leads the controlling owners to pursuit of private benefits while let all group
members bear high cost of capital (Almeida & Wolfenzon, 2006; Morck, Wolfenzon,
& Yeung, 2005).
The agency problems in business groups result from high diversion of cash flows
often deteriorate group member firms’ innovativeness due to three reasons. The first
reason is about incentives and monitors. Berle & Means (1932) argue that the
separation of ownership and control in pyramidal groups is similar to those in widely
held firms. Thus we expect that controlling shareholders can get rid of minority
shareholders’ scrutiny and invest less in innovation. Secondly, the divergence between
control rights and cash flow rights will induce capital misallocation. When the
5
benefits with non-controlling shareholders while then also have the access to all of the
retained earnings. Therefore controlling shareholders will prefer to invest in projects
with high net present value than risk failure. Thirdly, since lower-tier firms in
pyramidal groups also bear tunneling problems(Johnson, La Porta, Lopez-de-Silanes,
& Shleifer, 2000). The controlling shareholder can lift assets and income from lower
to higher tier firms, and dumps losses and liabilities from higher to lower levels of the
pyramid (Morck, Wolfenzon, and Yeung, 2005); lower-tier firms in control pyramids
are vulnerable to divergence of interest and entrenchment problems simultaneously.
Thus it is hard for them to obtain sufficient resources to innovate. Taken together, we
propose the following hypotheses:
H2a: The effect of pyramid ownership structure will negatively affect a firm’s incentive to do innovation.
H3a: The higher a firm’s degree of divergence between voting rights and ownership, the lower a firm’s incentive to do innovation.
H4a: The lower layer a firm is placed at in a business group, the less a firm’s incentive to do innovation.
Risk-Sharing Perspective
Conventional wisdom on risk-sharing hypothesis suggests that business groups enable
member firms to share risks by smoothing the variance of operating profit (Nakatani,
1984). However the data from 13 countries do not provide consistent evidence for this
hypothesis and the motivation for smoothing is still unknown (Khanna & Yafeh,
2005).
In order to shed light on the issue about risk sharing and business group, we draw on
6
focuses on the paradox of large shareholder activism. Admati, Pfleiderer, & Zechner
(1994) suggest that the monitoring of large shareholders is a public good for minority
shareholders and to increase large shareholders’ monitoring level by increased
holdings will cause the loss of risk-sharing benefits. It is supposed that yielding the
advantage of risk sharing would impel large shareholders to act more cautiously on
risky investment and innovation projects are considered to be risky, unpredictable,
long-term, multi-stage, labor intensive and idiosyncratic (Holmstrom, 1989). Thus we
suggest that large publicly traded firms which are characterized as highly diffuse
ownership structures are ought to have the preference to invest in riskier and more
innovative projects.
The divergence between voting rights and ownership is regarded as the cause of
agency problems in business groups. In business groups, high divergence between
voting rights and ownership often occur in the pyramid structure. When firms are
controlled by the pyramidal ownership structure or at the bottom of the pyramid, their
ultimate controllers hold only a fraction of shares of those firms yet have the control
rights of these firms. This means that ultimate controllers do not only have incentives
to use the advantage of risk sharing but also have the power to make investment
decisions. Hence, while from the perspective of risk sharing, the arrangement of
pyramidal structure may not for the purpose of expropriation but for risk-sharing
benefits. Accordingly, we propose the competitive hypotheses below:
H2b: The effect of pyramid ownership structure will positively affect a firm’s incentive to do innovation.
H3b: The higher a firm’s degree of divergence between voting rights and ownership, the more a firm’s incentive to do innovation.
7
H4b: The lower layer a firm is placed at in a business group, the more a firm’s incentive to do innovation.
Ownership structure, risk preference and exploration innovation
In order to full understand family’s risk preference, we apply the notion of exploration
innovation to our study. The theory of exploration-exploitation is originated from
James March’s (1991) seminal work, “Exploration and Exploitation in Organizational
Learning”. March defines exploration as “search, variation, risk-taking,
experimentation, play, flexibility, discovery, and innovation”, while exploitation is
“refinement, choice, production, efficiency, selection, implementation and execution”; the distinction between exploration and exploitation is the degree of dependence on an
organization’s prior knowledge (Lavie, Stettner, & Tushman, 2010). Because
exploration involves the more distant search for new knowledge, we suggest that the
creation and acquirement of exploration innovations is more risky than exploitation
innovations. Therefore, we propose the following hypotheses:
H5a: Family firms will have a lower percentage of exploration innovations H5b: Family firms will have a higher percentage of exploration innovations.
In addition, we similarly test the moderating effect of pyramidal control mechanisms
as described above. The moderating effect of pyramidal control mechanisms is
assumed to be negative when we adopt the expropriation perspective. On the contrary,
this effect will become positive when we embrace the risk-sharing perspective. In the
same vein, we propose the following competitive hypotheses:
H6a: Pyramidal control mechanisms will negatively affect family firms’ incentive to do exploration.
8 exploration.
DATA AND METHODS Data source and sample
To test our hypotheses we use manufacturing firms included in the Taiwan Economic
Journal top 3000 from 2000 to 2005. The Taiwan Economic Journal (hereafter TEJ) is the most credible database in Taiwan and subscribed by many authoritative
international database providers, including DATASTREAM, Dialog, QUICK (in
Japan), Capital Interactive Prospective, BARRA, REUTERS, Thomson Financial, etc.
Besides the financial statement data of all publicly traded firms in Taiwan, TEJ also
construct the database of business groups in Taiwan from 1999. Masulis et. al. (2011)
also use TEJ’s business groups database to make international comparison. TEJ uses
weakest-link principle (La Porta et al., 1999) to identify the ultimate controllers for
each firm, then distinguish the relationship between these ultimate controllers. If
shared identity, interlocking directorate or cross holding occurs, the firms connected
by these relationships are considered as a business group.
Dependent variable
Innovation. The basic unit of analysis in our study is a firm. To measure firms’ innovation we collected the number of granted patents for each firm from United
States Patent and Trademark Office (hereafter USPTO). We also backdate to the
application date when we count the number for the sake of possible time-lag between
application for a patent and issue of a patent.
Exploration Innovation. In order to test the risk preference of family business, we use exploration innovation as a proxy for high risky investment. We construct this
variable according to Benner & Tushman’s definition (2002). Using a firm’s patent
9
citations or self-citations for each patent. Exploration innovations are patents that
depart entirely from prior firm knowledge (less repeat citations or self-citations). So,
we count the number of patents by year for each firm that constitute 10 percent or less,
20 percent or less, and 40 percent or less, respectively, of the citations to prior
knowledge of the focal firm. Then we can create the ratio of exploration innovations
to total patent counts at 10 percent, 20 percent, and 40 percent levels.
Independent variables and controls
Family. The way to determine a firm as family business in this research is through the
identity of ultimate controllers. The ultimate controllers can be team members, family
members. When one or more family members of the ultimate controller are officers,
directors, or blockholders, and when this family is the largest voteholder or the largest
shareholder in a firm, we define this firm as family business.
FamilyGroup. The definition of group is described in the section about data source
and sample. For the purpose of compare difference between family groups and
non-family groups, we create familygroup variable by multiplying binary family
variable and binary group variable.
Pyramidal control. La Porta et al. (1999) define pyramidal groups as a chain of firms
controlled by the controlling shareholder through at least one publicly traded firm.
Thus, we define pyramidal control mechanism as indirectly holdings; a firm held by
another publicly traded firm through either direct holdings or cross-holdings.
Divergence between voting rights and cash flow rights. Voting rights is the seats that
the ultimate controllers hold on the board. And the cash flow rights are the sum of
10
flow rights are the sum of indirect holdings. If ultimate controller A holds 5 % shares
of firm 1, 6% shares of firm2, and firm1 also holds 20% shares of firm 2, for A,
his/her indirect holdings of firm 2 is 1 percent. Then A’s cash flow rights is equal to
6% (5% + 1%). The divergence between voting rights and cash flow rights equal to
voting rights minus cash flow rights.
Layer. This variable is a firm’s layer position in pyramidal groups. The firm at the top
of the pyramidal group is coded 1. And the lower tier a firm is positioned, the larger
number it is coded.
Interactions. To test H6a and H6b, we investigate the interactions between family
groups and non-family groups and pyramidal control mechanisms. Because we want
to untangle the family effects and the group effects, we create two moderator
variables by multiplying the binary group variable and binary family groups by each
of the three pyramidal control mechanisms (pyramidal control, divergence between
voting rights and cash flow rights, and layer). Controls
Following prior studies related to the patenting behavior of firms (Hall & Ziedonis,
2001; Mansfield, 1986), we control pharmaceutical, semiconductor and other
capital-intensive industries in Taiwan, like components, electrical, machinery,
photoelectric, and communication. In addition, we use the log of the number of employee to control the effect of firm size (Scherer, 1965; Soete, 1979). Firm age
(Chrisman & C., 2011) and CEO duality (Villalonga & Amit, 2006) are also
controlled for the sake of possible entrenchment in family firms. To control for firm
performance we use ROA. A firm’s incentive scheme and R&D investment my also
11
sales. In order to exclude other group effects, we also use internal trading (sales), loan, endorsement and focal firm’s re-investment to assets as proxies to control the possible effect of internal market. Lastly, year dummies are also included.
Data analysis.
Table 1 presents descriptive statistics. The average patent counts for each firm is 3.69
while its standard deviation is very high (29.65). This initial screening of our data
suggests that means our dependent variable is overdipersion. In addition, only less
than quarter (21%) firms have at least one patent. Thus, to test H1 and H2 is
vulnerable to estimation bias due to excess zeros and overdispersion. Following prior
studies where the number of patent counts is the dependent variable (Chang, Chung,
& Mahmood, 2006; Mahmood & Zheng, 2009), we use robust zero-inflated negative
binomial (ZINB) models to test the hypotheses. Besides that, we also use two-year
time lag of all independent variables as determinants of innovations.
RESULTS Ownership structures and innovation
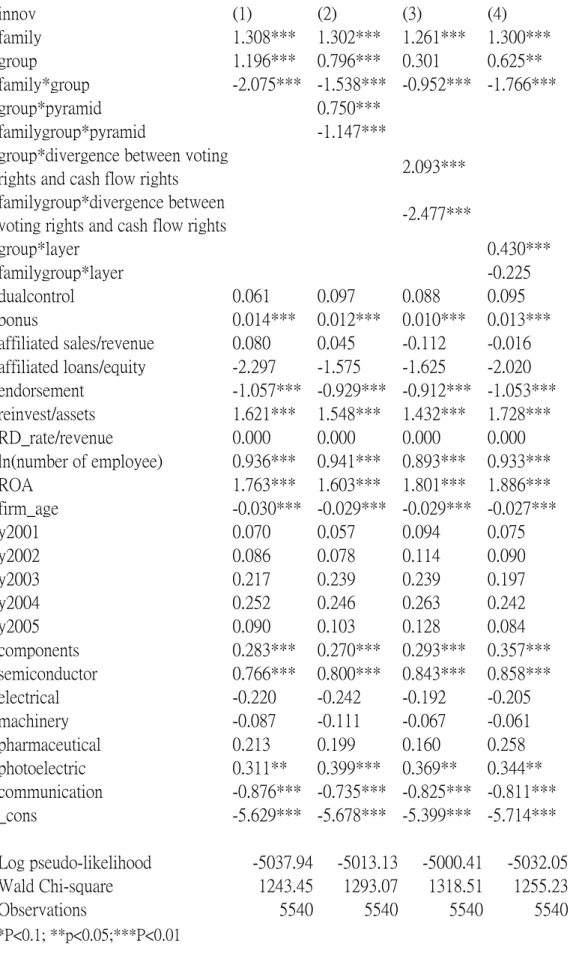
Table 2 presents the results using total patent counts as the dependent variable. In
order to understand the difference between non-family groups and family groups, we
involve family effect and group effect simultaneously. Model 1 show that, while both
group effect and family effect are positively associated with patent counts, the
interaction of group effect and family effect is negatively associated with patent
counts. It seems that family businesses have the propensity to do innovation (β
=1.308; p<0.01) but when family business formed into a business group, they become
less innovative (β=-2.075; p<0.01). Besides that, group effect is positively associated
12
For the purpose of untangling the group effect, we further create three interaction
terms by multiplying three different kinds of ownership structures (pyramidal control,
divergence between voting rights and cash flow rights, and layer) with group variable
and family group variable and include them separately into our model (from model 2
to model 4). The results show that group affiliation with pyramidal control has
positive effect on innovation for non-family business (β= 0.750; p<0.01) while has
negative effect on family business (β= -1.147; p<0.01). Secondly, group affiliation
with high divergence between voting rights and cash flow rights is positively related
to patent counts for non-family businesses (β= 2.093; p<0.01) but is negatively
related to patent counts for family businesses (β= -2.477; p<0.01). Thirdly, the lower
layer a firm is placed at in a non-family business group the more a firm’s incentive to
do innovation (β= 0.430; p<0.01), while the layer position do not have significant
effect on innovation for the members of family business group (β= -0.225; p>0.1).
Ownership structures and exploration innovation
To test competitive hypotheses 5a, 5b and 6a, 6b, we use three different levels of
exploration innovation. The results present separately in table3, table4, and table5.
Overall, the effect of non-family groups is not significant while family group
affiliation induce higher percentage of exploration innovation. Moreover, in
pyramidal control, firms in non-family groups have lower percentage of exploration
innovation, whereas firms in family groups have higher percentage of exploration
innovation. Take the results in table 3 as an example, group affiliation with pyramidal
control is negatively related to the percentage of exploration innovation for
non-family businesses (β= -0.064; p<0.01), while is positively related to the percentage of exploration innovation for family businesses (β= 0.086; p<0.01).
13
Secondly, group affiliation with high divergence between voting rights and cash flow
rights is negatively related to patent counts for non-family businesses (β= -0.143; p<0.01) but is positively related to patent counts for family businesses (β= 0.197=; p<0.01). Thirdly, the higher layer a firm is placed at in a non-family business group the more a firm’s incentive to do innovation (β= -0.039; p<0. 1), while the layer position do not have significant effect on innovation for the members of family
business group (β= 0.045; p>0.1). DISCUSSION AND CONCLUSION
The ownership structures in business groups are different from that in freestanding
firms. However related empirical studies are still scant. We intend to fill this void in
the field of corporate governance. Drawing on risk-sharing perspective, we propose
that one way to directly test whether the arrangement of pyramidal structure is for the
purpose of appropriation or for risk-sharing benefits is to investigate its effect on risky
investments, like innovations.
Using longitudinal data of business groups in Taiwan, we show that how different
traits of pyramidal control mechanism influence non-family and family group
affiliates’ incentive to do innovation. We began by analyzing family effect and group
effect on innovation and found that group affiliates prefer to do innovation while
family group affiliates object to do innovation. Based on this finding, we argue that
group affiliates are risk takers (H1b), whereas family group affiliates are risk averters
(H1a). Moreover, we found that pyramidal control mechanisms increase group
affiliates’ incentive to do innovation, but deteriorate family group affiliates’ intent to
do innovation. This result seems to imply that risk takers (non-family business) would
14
contrast, risk averters instead take pyramidal control mechanisms as a means to
expropriation (H2a, H3a, and H4a).
To verify our temporary conjecture, we replaced the dependent variable with the
percentage of exploration innovations. The further investigation suggest that, though
family group affiliates gain less innovations, they have higher percentage of
exploration innovations (H5b). We also found that most pyramidal control
mechanisms encourage family group affiliates to gain higher percentage of
exploration innovations (H6b).
As described above, our study makes contributions to three separately streams of prior
research: corporate governance, business groups, and innovations. In terms of the
studies on innovation, we add insights into how control mechanisms influence firm’s
incentive to acquire innovations. Existing literature on innovations has underlined
innovation as a result of corporate ownership and controls, like family firms’ aversion
to the loss of socioemotional wealth (Chrisman & C., 2011), the effects of internal
controls and strategic controls (Hitt, Hoskisson, Johnson, & Moesel, 1996), and the
diminishing discipline over innovative projects (Nohria & Gulati, 1996). We do not
intend to refute these arguments but we doubt the implicit assumption that active
involvement in the market for corporate control can impede their pursuit of
innovations. These studies which focus on monitoring and controls omit the
risk-sharing benefit derive from diffuse ownership structures (Admati et al., 1994).
Although Hoskisson, Hitt, Johnson, & Grossman (2002) has specified the influence of
ownership structures on corporate innovation strategies and there are ample studies in
15
corporate governance and innovation, there is scant research and understanding on
firms’ purpose of the arrangement of the ownership structures. Focusing on the
arrangement of the ownership structures, our research contributes to the main stream
research by underlining how firms arrange ownership structure to achieve risk-sharing
benefits. That is to say, the use of control mechanisms can be not only for
expropriation, but also for risk-sharing. These findings also dissolve the risk
preference of family business groups. Families are very cautious with risky projects;
even risk-sharing is possible family business groups acquire fewer innovations than
non-family business groups. But families still have the propensity to do innovation in
nature (longer investment horizons), thus they have higher percentage of exploration
innovation.
We also intend to contribute to research on business groups by adopting risk-sharing
perspective. Although internal market hypothesis dominate the theories of business
group and there is ample evidence from around the world (Belenzon & Berkovitz,
2010; Chang et al., 2006; Masulis et al., 2011), our research sheds light on the effect
of corporate ownership in a scenario to decide to do high risk investment or not. After
controlling the internal capital market factors, we find pyramidal mechanisms
facilitate group affiliates’ incentive to gain more innovation. This results support
risk-sharing hypothesis and explain why the present of business groups in markets
with relatively complete institution (for example, high-tech companies in Taiwan, like
16
Table1. Mean, Standard Deviations, and Correlations
Variable Mean Std. Dev. innov family group fgroup pyramid1
divergence between voting rights and cash flow rights
layer dualcontrol bonus affiliated sales/revenue affiliated loans/equity endorsement Reinvest /assets RD_rate /revenue ln(number of
employee) ROA firm_age
innov 3.687584 29.65198 1 family 0.610855 0.487593 -0.0879* 1 group 0.799554 0.400364 0.0535* 0.0148 1 fgroup 0.491301 0.499962 -0.0594* 0.7844* 0.4921* 1 pyramid1 0.334275 0.471772 0.0887* -0.0460* 0.2863* 0.0956* 1 divergence between voting rights and cash flow rights 0.340537 0.260748 0.1192* -0.0792* 0.1839* 0.0392* 0.4188* 1 layer 1.152252 0.416933 0.0201 -0.1224* 0.1798* -0.0337* 0.4135* 0.1914* 1 dualcontrol 0.658885 0.474119 -0.0450* 0.0684* -0.1072* -0.0019 -0.1510* -0.1349* -0.1360* 1 bonus 7.509854 34.75274 0.0641* -0.0578* 0.0083 -0.0430* -0.0117 -0.0027 0.0042 -0.0235 1 affiliated sales/revenue 0.14976 0.202947 0.0408* -0.0585* 0.1878* 0.0448* 0.1560* 0.1092* 0.1808* -0.0326* 0.0123 1 affiliated loans/equity 0.010178 0.0725 -0.0144 0.0149 0.0353* 0.0352* 0.0041 0.0145 -0.0169 -0.0108 -0.0182 -0.0025 1 endorsement 0.060429 0.22326 -0.0126 0.0478* 0.1019* 0.0980* 0.0754* 0.1164* -0.0231 -0.0371* -0.023 0.0717* 0.2661* 1 reinvest/assets 0.168288 0.157631 0.0296 0.1673* 0.3592* 0.3264* 0.1535* 0.1961* -0.0639* -0.0951* -0.0273 0.1403* 0.0183 0.2048* 1 RD/revenue 0.474682 21.06188 -0.0016 0.0067 -0.0396* -0.0193 -0.0128 -0.0101 -0.0057 0.0123 -0.0106 -0.0132 -0.0029 -0.0058 -0.016 1 ln(number of employee) 5.589005 1.133262 0.2328* 0.0334* 0.2307* 0.1503* 0.2398* 0.2956* 0.0760* -0.1146* 0.0125 0.1157* -0.002 0.1490* 0.1993* -0.0375* 1 ROA 0.052178 0.123065 0.0594* -0.0222 0.0092 -0.0305 -0.1259* -0.1430* -0.0315* 0.0017 0.1994* -0.0004 -0.1286* -0.1169* 0.0193 -0.0331* 0.0334* 1 firm_age 19.7557 12.07034 -0.0294 0.3162* 0.1526* 0.3325* 0.0715* 0.1361* -0.1512* 0.0148 -0.1314* -0.0428* 0.0634* 0.1682* 0.3785* -0.0307 0.3039* -0.0636* 1
17
Table 2. Results of zero-inflated negative binomial (ZINB) regression for total number of patents
innov (1) (2) (3) (4) family 1.308*** 1.302*** 1.261*** 1.300*** group 1.196*** 0.796*** 0.301 0.625** family*group -2.075*** -1.538*** -0.952*** -1.766*** group*pyramid 0.750*** familygroup*pyramid -1.147***
group*divergence between voting
rights and cash flow rights 2.093***
familygroup*divergence between
voting rights and cash flow rights -2.477***
group*layer 0.430*** familygroup*layer -0.225 dualcontrol 0.061 0.097 0.088 0.095 bonus 0.014*** 0.012*** 0.010*** 0.013*** affiliated sales/revenue 0.080 0.045 -0.112 -0.016 affiliated loans/equity -2.297 -1.575 -1.625 -2.020 endorsement -1.057*** -0.929*** -0.912*** -1.053*** reinvest/assets 1.621*** 1.548*** 1.432*** 1.728*** RD_rate/revenue 0.000 0.000 0.000 0.000 ln(number of employee) 0.936*** 0.941*** 0.893*** 0.933*** ROA 1.763*** 1.603*** 1.801*** 1.886*** firm_age -0.030*** -0.029*** -0.029*** -0.027*** y2001 0.070 0.057 0.094 0.075 y2002 0.086 0.078 0.114 0.090 y2003 0.217 0.239 0.239 0.197 y2004 0.252 0.246 0.263 0.242 y2005 0.090 0.103 0.128 0.084 components 0.283*** 0.270*** 0.293*** 0.357*** semiconductor 0.766*** 0.800*** 0.843*** 0.858*** electrical -0.220 -0.242 -0.192 -0.205 machinery -0.087 -0.111 -0.067 -0.061 pharmaceutical 0.213 0.199 0.160 0.258 photoelectric 0.311** 0.399*** 0.369** 0.344** communication -0.876*** -0.735*** -0.825*** -0.811*** _cons -5.629*** -5.678*** -5.399*** -5.714*** Log pseudo-likelihood -5037.94 -5013.13 -5000.41 -5032.05 Wald Chi-square 1243.45 1293.07 1318.51 1255.23 Observations 5540 5540 5540 5540 *P<0.1; **p<0.05;***P<0.01
18
Table3. Results of OLS regression for 10 percent level of exploration innovation (%)
10% exploration (5) (6) (7) (8) family -0.119*** -0.116** -0.115** -0.117*** group 0.034 0.067* 0.095** 0.087* family*group 0.118** 0.076 0.035 0.059 group*pyramid -0.064*** familygroup*pyramid 0.086***
group*divergence between voting
rights and cash flow rights -0.143***
familygroup*divergence between
voting rights and cash flow rights 0.197***
group*layer -0.039* familygroup*layer 0.045 dualcontrol -0.006 -0.008 -0.007 -0.007 bonus 0.001* 0.001* 0.001** 0.001* affiliated sales/revenue -0.039 -0.027 -0.022 -0.032 affiliated loans/equity 0.595** 0.568** 0.585** 0.579** endorsement -0.073 -0.074 -0.073 -0.069 reinvest/assets 0.040 0.033 0.036 0.030 RD_rate/revenue 0.000 0.000 0.000 0.000 ln(number of employee) -0.044*** -0.044*** -0.042*** -0.044*** ROA -0.094 -0.091 -0.092 -0.094 firm_age 0.000 -0.001 -0.001 -0.001 y2001 -0.025 -0.025 -0.026 -0.026 y2002 -0.042 -0.043 -0.043 -0.042 y2003 -0.020 -0.021 -0.023 -0.020 y2004 -0.019 -0.018 -0.021 -0.019 y2005 -0.020 -0.021 -0.024 -0.020 components -0.007 -0.009 -0.001 -0.006 semiconductor -0.028 -0.024 -0.021 -0.028 electrical -0.041 -0.037 -0.037 -0.041 machinery -0.184*** -0.182*** -0.182*** -0.183*** pharmaceutical -0.046 -0.047 -0.041 -0.047 photoelectric 0.001 -0.002 0.010 -0.001 communication 0.043 0.035 0.048 0.041 _cons 1.132*** 1.131*** 1.116*** 1.135*** R-squared 0.0843 0.0914 0.093 0.0867 Observations 1242 1242 1242 1242
19
Table4. Results of OLS regression for 20 percent level of exploration innovation (%)
20% exploration (9) (10) (11) (12) family -0.128*** -0.125*** -0.125*** -0.127*** group 0.005 0.035 0.056 0.054 family*group 0.120*** 0.085** 0.053 0.066 group*pyramid -0.059*** familygroup*pyramid 0.071***
group*divergence between voting
rights and cash flow rights -0.122***
familygroup*divergence between
voting rights and cash flow rights 0.155***
group*layer -0.036 familygroup*layer 0.042 dualcontrol -0.005 -0.008 -0.007 -0.007 bonus 0.001 0.001 0.001 0.001 affiliated sales/revenue -0.022 -0.011 -0.008 -0.016 affiliated loans/equity 0.510** 0.485** 0.500** 0.494** endorsement -0.010 -0.012 -0.010 -0.006 reinvest/assets 0.069 0.064 0.068 0.060 RD_rate/revenue 0.000 0.000 0.000 0.000 ln(number of employee) -0.031*** -0.030*** -0.029*** -0.031*** ROA -0.061 -0.062 -0.061 -0.061 firm_age -0.002** -0.002** -0.002** -0.002** y2001 -0.026 -0.026 -0.026 -0.027 y2002 -0.044 -0.045 -0.045 -0.044 y2003 -0.018 -0.019 -0.020 -0.018 y2004 -0.010 -0.010 -0.012 -0.010 y2005 -0.017 -0.018 -0.020 -0.017 components -0.009 -0.011 -0.005 -0.008 semiconductor -0.036 -0.032 -0.030 -0.035 electrical -0.003 0.001 0.000 -0.002 machinery -0.152*** -0.152*** -0.151*** -0.151*** pharmaceutical 0.016 0.015 0.019 0.015 photoelectric -0.006 -0.009 0.000 -0.008 communication 0.032 0.024 0.036 0.030 _cons 1.124*** 1.121*** 1.108*** 1.127*** R-squared 0.0783 0.0855 0.0859 0.081 Observations 1242 1242 1242 1242
20
Table5. Results of OLS regression for 40 percent level of exploration innovation (%)
40% exploration (13) (14) (15) (16) family -0.059** -0.057** -0.057** -0.059** group 0.019 0.040 0.054** 0.049 family*group 0.060** 0.034 0.018 0.026 group*pyramid -0.042*** familygroup*pyramid 0.053***
group*divergence between voting
rights and cash flow rights -0.087***
familygroup*divergence between
voting rights and cash flow rights 0.094***
group*layer -0.022 familygroup*layer 0.027 dualcontrol -0.007 -0.009 -0.009 -0.008 bonus 0.000 0.000 0.000** 0.000 affiliated sales/revenue -0.018 -0.010 -0.009 -0.015 affiliated loans/equity 0.213 0.195 0.205 0.204 endorsement -0.049 -0.050 -0.049 -0.047 reinvest/assets 0.003 -0.001 0.007 -0.002 RD_rate/revenue 0.000 0.000 0.000 0.000 ln(number of employee) -0.019*** -0.018*** -0.016*** -0.019*** ROA -0.040 -0.040 -0.043 -0.040 firm_age -0.001 -0.001 -0.001 -0.001 y2001 -0.044*** -0.044*** -0.044*** -0.044*** y2002 -0.035** -0.035** -0.036** -0.035** y2003 -0.039** -0.040** -0.041** -0.039** y2004 -0.026 -0.026 -0.028 -0.026 y2005 -0.034** -0.034** -0.036** -0.034** components -0.003 -0.004 -0.001 -0.002 semiconductor -0.042*** -0.040*** -0.038*** -0.042*** electrical 0.024 0.027 0.026 0.024 machinery -0.024 -0.024 -0.024 -0.024 pharmaceutical -0.023 -0.024 -0.021 -0.023 photoelectric -0.026 -0.028 -0.022 -0.027 communication 0.014 0.008 0.016 0.013 _cons 1.100*** 1.098*** 1.085*** 1.102*** R-squared 0.0596 0.0678 0.067 0.0619 Observations 1242 1242 1242 1242
21 References
Admati, A. R., Pfleiderer, P., & Zechner, J. 1994. Large Shareholder Activism, Risk Sharing, and Financial Market Equilibrium. Journal of Political Economy, 102(6): 1097-1130.
Almeida, H. V., & Wolfenzon, D. 2006. A theory of pyramidal ownership and family business groups. Journal of Finance, 61(6): 2637-2680.
Belenzon, S., & Berkovitz, T. 2010. Innovation in Business Groups. Management
Science, 56(3): 519-535.
Belloc, F. 2011. Corporate governance and innovation: a survey. Journal of Economic
Surveys, In Press.
Benner, M. J., & Tushman, M. 2002. Process management and technological innovation: A longitudinal study of the photography and paint industries.
Administrative Science Quarterly, 47(4): 676-706.
Berle, A. A., & Means, G. C. 1932. The modern corporation and private property. New York: Macmillan.
Chang, S. J., Chung, C. N., & Mahmood, I. P. 2006. When and how does business group affiliation promote firm innovation? A tale of two emerging economies.
Organization Science, 17(5): 637-656.
Chrisman, J. J., & C., P. P. 2011. Variations in R&D Investments of Family and
Non-family Firms: Behavioral Agency and Myopic Loss Aversion Perspectives.
Academy of Management Journal, In Press.
Del Monte, A., & Papagni, E. 2003. R&D and the growth of firms: empirical analysis of a panel of Italian firms. Research Policy, 32(6): 1003-1014.
Dyer, W. G., & Whetten, D. A. 2006. Family firms and social responsibility: Preliminary evidence from the S&P 500. Entrepreneurship Theory and Practice, 30(6): 785-802.
Francis, J., & Smith, A. 1995. Agency Costs and Innovation Some Empirical-Evidence.
Journal of Accounting & Economics, 19(2-3): 383-409.
Gomez-Mejia, L. R., Makri, M., & Kintana, M. L. 2010. Diversification Decisions in Family-Controlled Firms. Journal of Management Studies, 47(2): 223-252. Hall, B. 1932. "Land" and Taxes on Monopolists. American Economic Review, 22(4):
693-694.
Hall, B. H., & Ziedonis, R. H. 2001. The patent paradox revisited: an empirical study of patenting in the US semiconductor industry, 1979-1995. Rand Journal of
Economics, 32(1): 101-128.
Hitt, M. A., Hoskisson, R. E., Johnson, R. A., & Moesel, D. D. 1996. The market for corporate control and firm innovation. Academy of Management Journal,
22 39(5): 1084-1119.
Holmstrom, B. 1989. Agency Costs and Innovation. Journal of Economic Behavior &
Organization, 12(3): 305-327.
Hoskisson, R. E., Hitt, M. A., Johnson, R. A., & Grossman, W. 2002. Conflicting voices: The effects of institutional ownership heterogeneity and internal governance on corporate innovation strategies. Academy of Management Journal, 45(4): 697-716.
Johnson, S., La Porta, R., Lopez-de-Silanes, F., & Shleifer, A. 2000. Tunneling.
American Economic Review, 90(2): 22-27.
Khanna, T., & Yafeh, Y. 2005. Business groups and risk sharing around the world.
Journal of Business, 78(1): 301-340.
La Porta, R., Lopez-de-Silanes, F., & Shleifer, A. 1999. Corporate ownership around the world. Journal of Finance, 54(2): 471-517.
Lavie, D., Stettner, U., & Tushman, M. L. 2010. Exploration and Exploitation Within and Across Organizations. Academy of Management Annals, 4: 109-155. Lee, P. M., & O'Neill, H. M. 2003. Ownership structures and R&D investments of US
and Japanese firms: Agency and stewardship perspectives. Academy of
Management Journal, 46(2): 212-225.
Mahmood, I. P., & Zheng, W. T. 2009. Whether and how: Effects of international joint ventures on local innovation in an emerging economy. Research Policy, 38(9): 1489-1503.
Mansfield, E. 1986. Patents and Innovation - an Empirical-Study. Management
Science, 32(2): 173-181.
March, J. G. 1991. Exploration and Exploitation in Organizational Learning.
Organization Science, 2(1): 71-87.
Masulis, R. W., Pham, P. K., & Zein, J. 2011. Family Business Groups around the World: Financing Advantages, Control Motivations, and Organizational Choices.
Review of Financial Studies, 24(11): 3556-3600.
Morck, R., Wolfenzon, D., & Yeung, B. 2005. Corporate governance, economic entrenchment, and growth. Journal of Economic Literature, 43(3): 655-720. Nakatani, I. 1984. The economic role of financial corporate grouping. In M. Aoki (Ed.),
the economic analysis of the Japanese firm. New York: North-Holland.
Nohria, N., & Gulati, R. 1996. Is slack good or bad for innovation? Academy of
Management Journal, 39(5): 1245-1264.
Scherer, F. M. 1965. Firm Size, Market-Structure, Opportunity, and the Output of Patented Inventions. American Economic Review, 55(5): 1097-1125.
Shleifer, A., & Vishny, R. W. 1986. Large Shareholders and Corporate-Control. Journal
23
Soete, L. L. G. 1979. Firm Size and Inventive Activity - Evidence Reconsidered.
European Economic Review, 12(4): 319-340.
Sundaram, A. K., John, T. A., & John, K. 1996. An empirical analysis of strategic competition and firm values - The case of R&D competition. Journal of
Financial Economics, 40(3): 459-486.
Villalonga, B., & Amit, R. 2006. How do family ownership, control and management affect firm value? Journal of Financial Economics, 80(2): 385-417.
1
國科會補助專題研究計畫項下赴國外(或大陸地區)出差或研習心得報告
日期: 年 月 日一、國外(大陸)研究過程
此次出國目的有二,一是至大陸拜訪可能的訪問對象,二是到香港參加 2012
IACMR Conference。
大陸參訪過程:
實務上對台商而言,大陸不止能提供製造業相對低廉的勞工,更提供了一個廣大
的消費市場,然而,大陸仍為一政府主導的市場,對外資企業而言,如何在一個
制度不完善、但政治穩定度高的國家中制定正確的策略,是一個急待研究的議
題,更重要的是,實務上大陸目前正處於從出口導向型經濟轉向為內需導向型經
濟,過去研究探討制度對集團企業的影響多著重於當地集團企業如何因應制度環
境的改變,而較少從外資如何面對制度變遷此一面向出發,目前的研究結果告訴
我們隨著市場越來越完善,集團企業的重要性會降低,建立內部市場的門檻也會
增加,但若集團企業能有能力利用一些特殊的無形資產(如政商關係)進行轉型
投資,集團企業反而較非集團企業有優勢,然而制度的轉型過程中,外資所扮演
的角色卻是很少被研究的,因此這次大陸參訪的重點在於瞭解集團企業在大陸的
概況並尋求可能的參訪對象。
相對於以中小企業台商為主的珠三角地區,長三角地區的台商則多為大型集團,
其中包括傳統業與電子業,如統一、華碩等,至今大型餐飲集團也逐漸進軍大陸,
如王品。此行透過友人的安排接觸了幾間工廠、一間餐廳及一個服務品牌的負責
人,然而最大的收獲則是認識了安信國際投顧的胡總。
胡總是 1997 年到蘇州獨立創業的,一開始對大陸資本市場有興趣而開始收集大
陸政策法規及各個上市公司的經營狀況,然而,因為當時大陸股市不確定性太
高,於是胡總轉而利用手上收集的市場資訊來服務在大陸投資的台商。從每週舉
計畫編號
NSC
98-2410-H-004-048
-MY3
計畫名稱
集團企業的繼承與創新
出國人員
姓名
莊皓鈞
服務機構
及職稱
政大科管所博士候選人
出國時間
101 年 6 月 20 日至
101 年 6 月 24 日
出國地點
大陸地區及香港
附件五2
辦一次的免費經濟講座開始做起,經營了一年多,許多有接觸的台商開始相信安
信團隊的專業,於是開始聘請胡總在長江三角洲地區替他們選擇適合的投資地
點,由於安信團隊長期、大量地收集當地市場資訊,因此能做到比大陸人更瞭解
大陸投資環境,1999 年起五年內已經為 50 多家台商找到適合的投資地點,在提
供政策訊息、商情諮詢上也擁有 70 多家固定客戶。
這次我參與的座談會中,胡總也分享了他對未來大陸經濟情勢的看法,他認為長
期而言中國還是會持續成長,雖然短期內因為歐美經濟不景氣,中國出口減少,
可能使得人民幣在短期內較弱,但從長期趨勢來看,他認為中國經濟仍會持續成
長,主要原因在於大陸會從出口經濟轉向內需經濟,未來隨著中產階級的興起,
中國經濟可望持續成長,同時,中產階級興起也會帶動服務業的成長。
雖然還不確定未來中國的生活型態與服務業的發展型式,但從這次參訪可以發
現,已經台商已經開始引入休閒農場及啤酒屋等行業,一服飾公司的做法則是在
當地風景區建立通路販售過季商品,將觀光與購物結合在一起,種種跡象也與胡
總的看法不謀而合。我們相信這些經驗與人脈則有助於本研究未來將研究主題延
伸至「集團企業的國際投資策略」上。
參加 2012 IACMR Conference:
IACMR 為在美華人為致力於華人管理研究與發展而創立的協會,創辦人徐淑英
(Anne S. Tsui)為唯一同時獲得 ASQ 與 AMJ 最佳論文獎的華人管理學者,目前
為 AOM 會長(2011-2012)
,曾擔任 AMJ 主編,做為華人最有成就的學者之一,其
創新 IACRM 的目的在為建立一個華人研究的平台,這幾年下來,在兩岸三地辦過
多場研究方法工作坊,二年一度的會議除了邀請國際一流的學者來分享最新的研
究趨勢與成果外,更設計活動創造新進學者與大師面對面的機會,這是一個知識
分享、創造與合作的平台,聚集了世界級的精英,並且重視華人脈絡,對一個致
力於本土學術研究的新進學者而言,這個會議能幫助其研究成果讓世界看到。
這次是我第一次參加,會議貼心的安排了新進會員介紹會,在介紹會中除了有有
趣的活動幫助新進人員瞭解整個學會的歷史與 mission,還有學生代表現身說
法,Dong Lui 畢業於 University of Washington,目前任教於 Georgia Institute
of Technology,他在博士班其間積極利用 IACMR 提供的資源,他認為參與工作
坊與研討會幫助他將文章修改得更好,因此他也非常願意回饋學會,擔任學生代
表與 reviewer,並鼓勵我們將作品拿到會議中與大師討論。
參加這次的會議與本研究相關的議題集中在第二天關於公司治理與家族企業的
議題,我希望透過這次的會議瞭解此領域的發展方向,除此之外,其他時間我盡
量透過參與 Keynote panel 瞭解目前管理學最新的研究議題。
3
第一天:
早上的 Keynote 由陳明哲教授開場,他一上台就說美國人通常會以笑話開場,但
華人卻往往是以抱歉開場,他除了以這一個例子說明中西差異外,更想表達華人
企業研究的必要性,接著他以他自己的動態競爭理論為例點出東方思想如何幫助
他建立理論。
他說他一直在問一個問題:什麼是競爭?在他眼中,競爭是 dyad 的,是一來一
往動態的,在這個互動的過程中,其機制為競爭雙方是否察覺(awareness)對
手的行動、是否產生競爭的動機(motivation),以及是否有能力來回應
(capability),他說這一整套的動態競爭理論包含了華人固有的思想
(indigenous)。除此之外,他還分享了他對華人企業的觀察,他認為華人企業
與西方企業不同之處在於受到儒家思想的影響,我們的企業在競爭上比較不傾向
打倒對手,此外也可以看到一些甘於做小的企業,我們的企業也比較傾向合作而
不是競爭,他認為這些都是未來的研究議題。
最後他鼓勵後進學者要能專一與堅持。
下午 social structure and organizations 的主講人有著名的制度理論學家
Woody Powell 以及社會學家 Mark Granovetter,分別提出他們最新的研究議題。
Powell 收集了美國 1970 年代開始生技產業中全部的 the dedicated biotech
firm (DBF),並研究這些新創新公司在前十年的創業行為,他發現新企業的出現
主要是透過兩種機制:recombination and transposition。所謂 recombination
指的是在大公司中的執行長結合過去實務經驗與新的科學技術而成立,並以商業
化為主要目標(In science to do business),相反的,transposition 指的是
將技術移植至實務界而形成的新企業,其創辦人多半是腳跨學術與實務界的科學
家所(amphibious scientist-founders)
,而形成研究導向的企業(In business
to do science)。他認為雖然透過 transposition 機制形成的企業本質上存在新
進者的劣勢(liability of newness)
,但能產生重大發明的卻也是這些企業。
Mark Granovetter 過去提出弱連結的優勢(the strength of weak ties),他
發現點頭之交對於找工作的人比較有幫助,他認為弱連結較多元,是對外性的連
結,因此能促進連結外部資訊。他這次則是用弱連結的觀點來檢視 Facebook 或
Twitter 等線上的社會媒體(online social media),他認為因為人們因為時間
跟認知的限制而無法全面瞭解自己的社會網絡,這使得人們使用線上社會媒體來
瞭解自己所處的社會網絡面向,但線上社會媒體還能幫助人們恢復失聯的關係、
維持關係,甚至建立新的弱連絡,從中東社會革命運動來看,就可以發現這些線
上社會媒體的影響力。
4
第二天
在 Corporate Governance and Ownership 這場中總共有四篇文章,前三篇文章
與所有權有關:
第一篇文章 The Ownership and Performance of Asian Firms: A Meta-analysis
of the Effects of Institutional Voids and Ownership Identity 回顧了 145
個過去的實證研究進行 meta-analysis,其結果發現所有權對績效的關係受到制
度的影響,此研究中顯示,東亞 14 個國家中所有權集中程度對績效有正向影響
的有 4 個國家(南韓、新加坡、約旦及香港),有負向影響的包括了日本及
Armenia,其他國家則無影響。所有者類型則是另一個影響所有權與績效關係的
因素,外資(foreign owners)及散戶(market owners)比重越高,廠商的績
效也越好,相反地,stable owner 卻有負向影響。
第二篇文章 Does Owner Type Matter for Firm Performance? Manufacturing
Firms in China 1998-2007 使用的是中國製造業的資料,但與第一篇文章一樣
關心「誰是所有者?」這個問題,這篇文章將所有者分成 central government,
financial institutions, corporations, private individuals, foreign
investors 四類,並比較所有者的影響與廠商特性(資源與能力)何者的影響較
大,結果發現,雖然所有者對廠商績效有影響,但更重要的是廠商特性。但問題
是,這裡所指的廠商特性是 error term,這個指標過於模糊。
第三篇文章 FOREIGN INSTITUTIONAL INVESTORS, POLITICAL TIES, AND CORPORATE
GOVERNANCE REFORMS IN EMERGING ECONOMIES 是台灣的研究,這篇文章認為政
商關係有 2 種效果,一方面,有政商關係的廠商能取得額外資源,因此較能低抗
對抗外部壓力,另一方面,有政商關係的廠商必須配合政府政策,因此當政策改
變時(改善公司治理)有政商關係的廠商反而有義務配合。這篇文章發現,外資
有助於廠商改善公司治理(獨立董監比例高),而政商關係則會阻礙廠商改善公
司治理,但外資與政商關係的交互作用卻反而正向影響公司治理的改善。
在 Business Group and Family Firms 這場也有四篇文章,其中就有三篇是使用
台灣集團企業的資料,一篇是中國大陸的資料,其中一位是台灣的學者,其他三
位都是國立新加坡大學的博士生。
第一篇文章試圖比較型一代理問題與型二代理問題的影響,這篇文章主要的發現
是在家族企集團中,CEO duality 能降低型一代理問題,而金字塔的控制結構對
未公開發行公司而言能降低代理問題,但對公開發行公司卻會增加代理問題,作
者藉此發現意圖推論對台灣家族集團企業而言,型一代理問題重於型二代理問
題。
5
第二篇文章在討論外資所有權對家族控制董事會席次的影響,其結果發現外資持
股越高,家族控制董事會席次越少,而家族所有權越高家族較不會失去控制權,
此外,regulation(台灣走向西方公司治理模式)會增加外資的影響力,因此外
資持股對降低家族控制的影響會增強,而家族控制的影響也會減少。
第三篇文章 DOES OWNERSHIP MATTER? 使用的是中國的資料,大陸研究集團企業
與台灣明顯不同的是他們比較重視政府的角色,台灣在解除管制後,政府的角色
弱化,但目前中國的國營企業仍佔很大的影響力,此研究發現,非國營的集團母
公司代理問題較少,CEO 學經歷對國家所有權集團績效的影響弱於民營與地方集
團,國家所有權較地方或民間所有權有利於集團間無形資產的分享,而民間所有
權則有利於集團間有形財務資產的分享。
第四篇文章也是台灣集團企業的資料,這個研究企圖說明家族特性對廠商多角化
的影響,從代理觀點出發,多角化的目的在於實現家庭利益(而非企業利益),
因此當家族認知鑲嵌程度大時,廠商會選擇成立獨立子公司達成多角化,而非成
立內部部門。
第三天:
John Child 認為中國的特色是政治及政府介入商業活動極深,並有其歷史淵
源,中國的資本主義也因此被認為是一種變型的資本主義──國家資本主義
(state capitalism)。因此國家所有權及對廠商的影響就變得非常重要,過去
學者就曾討論過國家、地方及民營企業因文化與制度不同,對經濟協調與控制也
有不同的回應方式,這三種不同的系統中也呈現出對立的價值,不同的所有權、
控制權以及不同的資本或資源取得方式。因此在討論中國企業時必不可忽略政治
及制度觀點。同樣地,政府或制度對於廠商的海外投資也有直接的影響(如提供
低成本的財務資助)
,而政府及制度代理人對地方企業及民營企業國際化的影響
卻是目前為止仍很少被討論的。
為了解決上述問題,John Child 提供了一個「制度限制」及「政治穩定度」兩
構面的架構給大家參考,他的分析中美國屬於制度完整、政治穩定高的國家,而
中國則屬於制度不完整、政治穩定度高的國家,透過這個架構我們能瞭解不同地
區研究的差異性。
接著 John Child 的是 Oded Shenkar,他認為雖然中國研究常常受到評論質疑其
資料可靠度及合法性,其知識體系、出口及對外投資方式都與西方有很大的差
異,而使得中國研究不被重視。要改善這種情況必須有像 John Child 如此富有
名聲的學者來投入,才能使得管理研究需要中國的野田,也使得管理研究能對中
國有所幫助。他也提出了與 John Child 類似的、可能的研究觀點:
6
2. Context
3. Institution
4. History
5. Chinese perspective
6. SMEs
7. 聯盟的共演化
8. 政治對策略制定的影響
最後 Redding 接著提出他的中國商業系統的觀點(business system)
。他比較中
國式的資本主義與其他國家的資本主義發現,中國在下一個十到二十年之內都很
難形成美國式的資本主義,但比較容易走向南韓的路線。不過這條路仍存在兩個
主要的問題:一、經濟上的創新能力;二、在管理上能否授權。前者隨著大學、
資本市場及智財權的強化而能獲得改善,但後者在中國卻是一個難題。其主要原
因在於華人社會普遍缺乏制度信任、老闆常常親力親為或只信任少數親信,這對
於發展有效率、世界級、能處理複雜任務的管理系統是很大的阻礙。雖然從匯流
研究來看,廠商的商業系統會趨同:有同樣的組織行為、策略能力,但這不意味
著所有廠商都會採用相同的技術或例規(routines),從制度理論來看,這是文
化的影響,從複雜理論來看,這意味者在表面上可以看到廠商行為趨同,但不同
的社會特性仍會表現在經濟行為上。
二、心得
IACMR 聚集了全世界對華人世界有興趣的學者,這使得與會者有機會把本土研究
展現給世界,也有助於促使本土研究達到國際水準,如在這次的會議中,我有時
間把研究成果跟國立新加坡大學的鐘基年討論,鐘基年長年研究台灣家族集團企
業,並有許多研究成果發表 ASQ、AMJ、SMJ 等頂級期刊,能與這類型的學者研討
有助於我們將研究做得更好,並提供了未來與知名學者合作的機會。
國科會補助計畫衍生研發成果推廣資料表
日期:2012/11/30國科會補助計畫
計畫名稱: 集團企業的繼承與創新 計畫主持人: 溫肇東 計畫編號: 98-2410-H-004-048-MY3 學門領域: 策略管理無研發成果推廣資料
98 年度專題研究計畫研究成果彙整表
計畫主持人:溫肇東 計畫編號:98-2410-H-004-048-MY3 計畫名稱:集團企業的繼承與創新 量化 成果項目 實際已達成 數(被接受 或已發表) 預期總達成 數(含實際已 達成數) 本計畫實 際貢獻百 分比 單位 備 註 ( 質 化 說 明:如 數 個 計 畫 共 同 成 果、成 果 列 為 該 期 刊 之 封 面 故 事 ... 等) 期刊論文 0 0 100% 研究報告/技術報告 0 0 100% 研討會論文 0 0 100% 篇 論文著作 專書 0 0 100% 申請中件數 0 0 100% 專利 已獲得件數 0 0 100% 件 件數 0 0 100% 件 技術移轉 權利金 0 0 100% 千元 碩士生 0 0 100% 博士生 1 1 100% 博士後研究員 0 0 100% 國內 參與計畫人力 (本國籍) 專任助理 0 0 100% 人次 期刊論文 0 0 100% 研究報告/技術報告 0 0 100% 研討會論文 1 1 100% 篇 論文著作 專書 0 0 100% 章/本 申請中件數 0 0 100% 專利 已獲得件數 0 0 100% 件 件數 0 0 100% 件 技術移轉 權利金 0 0 100% 千元 碩士生 0 0 100% 博士生 0 0 100% 博士後研究員 0 0 100% 國外 參與計畫人力 (外國籍) 專任助理 0 0 100% 人次其他成果