Service Distance and Ratio-Based Location-Allocation
Models for Siting Recycling Depots
Jehng-Jung Kao, M.ASCE
1; Long-Mao Wen
2; and Kun-Hsing Liu
3Abstract: Siting appropriate locations for placing recycling depots is essential for promoting an efficient recycling program. This study develops three optimization models to facilitate siting analysis for district-based, district open, and nondistrict situations. An enhanced model to improve drawbacks of locating recycling depots that mainly serve residents in adjacent districts using the district open model is also proposed. Three factors of service distance, local service ratio, and service ratios for different distance ranges are used to compare the effectiveness of alternatives obtained from different models. A case study involving 16 city districts is implemented to demonstrate the applicability of the proposed models. Findings show that the district-based alternatives have best overall service distance and service ratio, but with a poor local service ratio. The enhanced model obtains alternatives that achieve good local service ratio with acceptable service distance and service ratios for different distance ranges.
DOI: 10.1061/共ASCE兲EE.1943-7870.0000170
CE Database subject headings: Site selection; Optimization; Recycling; Waste management.
Author keywords: Site selection; Optimization; Recycling depot; Service ratio; Environmental systems analysis.
Introduction
Recycling using recycling depots is a commonly adopted ap-proach for recyclable material collection 共e.g., Apotheker 1997; Sparks 1998; Valeo et al. 1998; Flahaut et al. 2002兲. Some local environmental authorities in Taiwan are exploring the possibility of adopting such an approach to replace or enhance the original curbside recycling approach. However, the locations of recycling depots can significantly affect the performance of a recycling pro-gram. Various factors should be evaluated for selecting proper locations for establishing recycling depots. For example, a recy-cling depot without a convenient road access, far from the central population or without sufficient lighting will discourage the resi-dents from dropping off their recyclable materials. Siting appro-priate locations for placing the recycling depots is therefore important. This study develops optimization models to facilitate the decision analysis for siting appropriate recycling depot loca-tions.
Although a comprehensive model such as the life-cycle-based model proposed by Solano et al. 共2002a,b兲 is available, it is too complex to be used for this siting problem. Several simple deci-sion factors are thus adopted or developed. The distance between
a house or apartment and the closest recycling depot is an essen-tial factor for evaluating recycling depot efficiency. A short ser-vice distance will likely increase the recycling rate. Researchers frequently adopt the service distance as a major evaluating crite-rion in many siting researches共e.g., Berman et al. 1991; Gerrard and Church 1995; Kao and Lin 2002; Farhan and Murray 2006; Aras and Aksen 2008兲. This study therefore selects the service distance as one of the major decision factors.
However, if only the service distance was considered, most depots would be located at places near high population density areas, and the disproportional allocation would cause disparity among different regions共Church 1990兲. To improve regional eq-uity, depots should also be placed in the districts with low popu-lation density to avoid significantly long service distances. The regional equity issue should be simultaneously evaluated in de-veloping the siting optimization model.
For a low population density district, selecting total service distance as the objective to minimize for this siting problem will locate a recycling depot close to the adjacent district with high population density. As a result, a recycling depot will primarily serve households located in the adjacent district instead of those in the same district the depot belongs to. The current study there-fore introduces the local service共LS兲 ratio for the ratio of local households in the same district where the recycling depot is lo-cated as another major siting factor. Similar to the method pro-posed by Kao and Lin 共2002兲, this study computes the service ratio by counting households being served in the same district and the distribution of households with different service distances from the closest recycling depot.
Although previous researches rarely address the problem of siting recycling depots, many studies investigate similar location siting problems. For example, many researchers explored the p median problem for minimizing the overall average distance for selecting p depots in an area共e.g., Hakimi 1964, 1965; Teitz and Bart 1968; Järvinen et al. 1972; Narula et al. 1977; Neebe 1978; ReVelle and Elzinga 1989; Church 1990; Gerrard and Church 1995; Figueiredo and Mayerle 2008兲. The siting problem in this 1
Professor, Institute of Environmental Engineering, National Chiao Tung Univ., 1001 University Rd., Hsinchu, Taiwan 30010, Republic of China共corresponding author兲. E-mail: [email protected]
2
Graduate Student, Institute of Environmental Engineering, National Chiao Tung Univ., 1001 University Rd., Hsinchu, Taiwan 30010, Repub-lic of China. E-mail: [email protected]
3
Graduate Student, Institute of Environmental Engineering, National Chiao Tung Univ., 1001 University Rd., Hsinchu, Taiwan 30010, Repub-lic of China. E-mail: [email protected]
Note. This manuscript was submitted on February 27, 2009; approved on September 28, 2009; published online on October 8, 2009. Discussion period open until September 1, 2010; separate discussions must be sub-mitted for individual papers. This paper is part of the Journal of Envi-ronmental Engineering, Vol. 136, No. 4, April 1, 2010. ©ASCE, ISSN 0733-9372/2010/4-444–450/$25.00.
study is a p median problem if only considering one district. However, the siting problem this study explores is not re-stricted to a single area, but also applies for multiple districts. Recycling performances among different administrative districts are competitive and frequently compared by the local environ-mental authority and the general public. Therefore, a method for siting recycling depots in multiple districts is desired. ReVelle and Elzinga共1989兲 developed a two-stage algorithm for selecting fa-cility locations in multiple regions. The first stage solves a p median model for each district. The second stage applies a greedy algorithm to allocate facilities with the sum of weighted distances being minimized. However, the solution obtained from this method may not be the global optimum. Church共1990兲 developed a mixed-integer programming共MIP兲 model to solve a p median problem with limits on the maximal and minimal desired numbers of facilities, and Gerrard and Church共1995兲 modified the model further and developed another MIP model that allows demand to cross zonal boundaries. Recycling depots generally allow service to residents in adjacent districts; therefore, this study adopts siting models that also allow service demand to cross zonal boundaries. The following sections first discuss factors for evaluating sit-ing location effectiveness. Four recyclsit-ing depot sitsit-ing models are then described. The application of the models to an illustrative case for 16 districts in Hsinchu City in Taiwan is demonstrated. Finally, modeling results are compared for their differences, ad-vantages, and disadvantages.
Evaluating Factors
Previous location allocation models generally evaluated total ser-vice distance without considering spatial equity and distribution efficiency. Based solely on service distance, most depots would be located near high population density areas, causing disparity among different regions. The regional equity issue should be si-multaneously assessed in developing a recycling depot siting op-timization model. Therefore, besides service distance, this study proposes LS ratio for evaluating spatial distribution equity and service ratios for different distance ranges in evaluating spatial distribution efficiency. This study uses these three major factors to evaluate effectiveness of results obtained from the siting models presented in the next section. The three factors are described re-spectively as follows.
Average Service Distance
The service distance for a household is the distance between the household and the closest recycling depots. This study uses the average service distance for all households as a major evaluating factor. However, the average service distance does not reflect the spatial distribution of recycling depots. Therefore, two other fac-tors are proposed, as described below.
LS Ratio
If total service distance is the major objective function to mini-mize it for applying the siting models, some districts with low population density may not be allocated any recycling depot. Each district should have at least one recycling depot as the mini-mal requirement. A large area with low population density may not be allocated enough recycling depots and subsequently some residents may not have service within a reasonable distance to an adjacent recycling depot. Subsequently, the residents may not be
willing to cooperate with the recycling program. Therefore, this study proposes the LS ratio for evaluating this spatial distribution equity problem. The LS ratio is the ratio of local households receiving service. If such a ratio for a district is too low within an acceptable distance, placing at least one additional recycling depot to improve service quality should be considered.
Service Ratios for Different Distance Ranges
This study assumes that each household is served by the nearest depot. According to this assumption, the service ratios for differ-ent distance ranges and the LS service ratios for differdiffer-ent distance ranges are determined. These ratios can be used to evaluate the spatial distribution efficiency of recycling depots to serve local and all households.
Models
This study applies four models for siting recycling depots: district-based共DB兲, district open 共DO兲, nondistrict 共ND兲, and en-hanced district open 共EDO兲 models. The first three models are used to optimize depot allocation for the DB, DO, and ND strat-egies, respectively, and the EDO model is developed to obtain the best compromise solution. The objective functions of the models all aim to minimize the sum or average distances between each household to the closest recycling depot, although their constraint sets are different. These models are respectively described as fol-lows.
DB Model
The DB strategy assumes that residents use only the depots lo-cated in their own districts. Thus, the objective function of the model is to minimize the sum of the distances between each household and its nearest recycling depot in the same district. The model is formulated as follows:
Min
兺
i Widi 共1a兲 Subject to兺
j苸Mi艚Ci 共Dijyij兲 ⱕ di ∀ i 共1b兲兺
j苸Mi艚Ci yij= 1 ∀ i 共1c兲 yijⱕ xj ∀ ij 共1d兲兺
j苸Nr xj ∀ r 共1e兲 xj=共0,1兲 ∀ j 共1f兲where i = index of a household group, and each group includes a different number of households; Wi= number of households in
household group i; didenotes the average distance to the nearest
recycling depot that serves household group i; j represents the index of a candidate recycling depot location; Mi= set of
candi-date recycling depots in the same district with household group i; Ci= set of the candidate depots that can serve household group i;
Dij= average distance between household group i and recycling
depot j; yij= variable that can be 1 and 0 only, for which 1
indi-cates that household group i is served by recycling depot j; xj
= binary integer variable, for which 1 indicates that a recycling depot is placed at candidate location j; r = index of a district; Nr
= set of all candidate recycling depots in district r; and Rr
= desired number of recycling depots in district r.
Eqs.共1b兲 and 共1c兲 determine the nearest recycling depot loca-tion serving each household group. Eq.共1d兲 ensures that yijmust
be smaller than xj, and combined with the driving force provided
by the objective function and Eq.共1d兲, yij’s will be either 0 or 1.
Thus, there is no need to set them as 关0,1兴 binary integer vari-ables, that can significantly save model solving time. Eq.共1e兲 sets the desired number of recycling depots in each district. Eq. 共1f兲 defines all xj’s to be关0,1兴 integer variables.
DO Model
This model assumes that the residents always choose the nearest recycling depot for recycling, without considering whether the nearest recycling depot belongs to the same district or not. The model is formulated and described as follows:
Min
兺
i Widi 共2a兲 Subject to兺
j苸Ci 共Dijyij兲 ⱕ di ∀ i 共2b兲兺
j苸Ci yij= 1 ∀ i 共2c兲 Same as Eqs. 1共d兲 – 1共f兲Eqs.共2b兲 and 共2c兲 are different from Eqs. 共1b兲 and 共1c兲, for which household group i and recycling depot j need not be in the same district. Other constraints are the same as those used in the DB Model.
ND Model
The ND model regards the entire area as one single region and attempts to select proper locations for establishing recycling de-pots without considering the district regions.
Min
兺
i Widi 共3a兲 Subject to兺
j苸J xj= R 共3b兲Same as Eqs. 2共b兲, 2共c兲, 1共d兲, and 1共f兲
where j = set of all candidate depots; and R = desired number of recycling depots. Eq. 共3b兲 sets the desired number of recycling depots. All other constraints are the same as those used in previ-ous models.
EDO Model
The DO model may place recycling depots at locations that can serve most residents in adjacent districts, instead of those in the local district. An enhanced DO model is thus developed by adding
constraints to set the limit for the minimal acceptable district LS ratio. Although these new constraints set all LS ratios to be larger than a prespecified limit, it may drive some yij’s to be values
between 0 and 1. Setting all yij’s as a binary integer variable can
resolve this problem, but significantly increases the number of binary integer variables that make the problem hard to solve in a timely manner. Thus, these variables are not set to be binary in-teger variables. Any existing yijequal to a value between 0 and 1
in the solution can be resolved either selecting the better one of the two new solutions obtained by setting the variable to be 1 and 0, or implementing a branch-and-bound procedure. This model is formulated as below. Min
兺
i Widi 共4a兲 Subject to兺
i苸Orj苸M兺
i艚Ci Wiyijⱖ SⴱWIr ∀ r 共4b兲Same as Eqs. 2共b兲, 2共c兲, and 1共d兲 – 1共f兲
where Or= set of the household groups in district r; S = minimal
limit for LS ratios; and WIr= number of households in district r.
Eq. 共4b兲 lets the LS ratio of each district to be larger than the prespecified limit. All other constraints are the same as those used in previous models.
Case Study
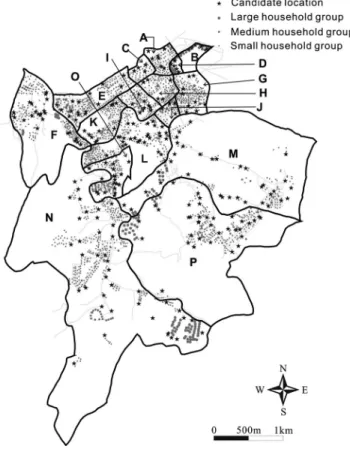
This study applies the models to the 15 districts in the east region and one district in the north region of the Hsinchu City, totaling 16 districts. Fig. 1 illustrates district locations. A district is a mu-nicipal administrative unit in a local city. Each district has its own office to handle district issues. Districts in Taiwan typically derive from small villages, covering relatively large areas, and gradually dividing into multiple smaller but highly populated districts as their population grew. The entire study area comprises 18,008 households, 58,518 residents, and 21.18 km2. Recyclable
materi-als in most districts are collected with a recycle truck following a garbage truck along the streets. Local residents are required to physically bring out their recycling materials and hand the mate-rials the collector on the truck, with the truck stopping at each collection point for just a few minutes. This collection method is expensive and inconvenient for residents who are unable to bring out their recyclable materials at the collection time. Although in-creasing the collection frequency or providing a convenient con-tainer may increase the participation rate共Noehammer and Byer 1997兲, the associated cost may be more than the local authority can bear. This work thus assesses the applicability of the alterna-tive for providing recycling depots.
Each model is applied to optimize the depot allocation for a specific recycling depot collection strategy. The DB strategy as-sumes that the residents in each district use only the depots lo-cated in their own district. Currently, the recycling rates of all districts are individually calculated and regularly announced to the general public. The DO strategy allows residents to bring their recycling materials to the closest recycling depot in an adjacent district. The ND strategy assumes that the recycling program is managed by the city government instead of by individual district
offices. Furthermore, the EDO strategy can resolve the regional disparity problem and enable most residents to access a depot within a reasonable distance.
In this study, each household represents a typical local family, but households are not individually processed because most fami-lies in Taiwan live in a building or apartment with others. Instead, they are grouped with their neighbors from aerial photographs, with 16 households at most in a group. In total, there are 2,437 household groups. From the same set of aerial photographs, 253 sites are selected as candidate locations for placing recycling de-pots. Fig. 1 illustrates locations of the household groups and can-didate sites. To avoid wasting time checking inappropriate service distance between a household group and a recycling depot, the maximal acceptable service distances are set as 2,220 m for dis-tricts M, N, and O, and 820 m for the other 13 disdis-tricts. The distance is measured as the Euclidean distance between two given locations, although it slightly differs from the street distance.
After gathering the data for household groups, candidate recy-cling depot locations, and preparing the distance between each household group and each recycling depot, this study applies and solves the models by CPLEX 共ILOG 2007兲. Two scenarios are evaluated. Scenario I establishes one depot per district for a total number of 16 recycling depots. Scenario II adds three extra de-pots because of the sparse population distribution in the three large districts, M, N, and P. If only one depot is established for these three large districts, the service distances would be signifi-cantly longer than those in other districts and thus Scenario II adds three extra depots.
Results and Discussion
The proposed models are applied to both scenarios. Each model represents a different recycling depot collection strategy. And the
three factors of service distance, LS ratio, and service ratios for different distance ranges are applied to measure the performance of each strategy. The results are compared based on the three factors, as discussed below.
Service Distance
Fig. 2 shows average service distances from results obtained by different models, ranging from 60 to 80 m for Scenario I. The shortest one, 60 m, is for the ND result that is about 26 m shorter than that for the DB result, that is about 30% less. However, the same figure shows that the ND result does not place any recycling depot for several districts and thus has poor spatial distribution equity. The DB result has the longest average distance because it only allows the recycle depot to be used within its own district, and residents cannot use the closest depots located in adjacent districts. The average distances of DO and EDO results are quite close and about 8 meters shorter than that of DB because it allows the resident to drop off recycling materials at the depot located in an adjacent district. The average service distances of the results obtained for Scenario II range from 54 to 66 m and are predict-ably less than those for Scenario I because three additional depots are placed in three districts with sparse population distribution. The ND and DB results have the shortest and longest average service distances of 54 and 66 m, respectively. However, the dif-ference is only 12 meters, much smaller than the 26 meters for Scenario I.
LS Ratio
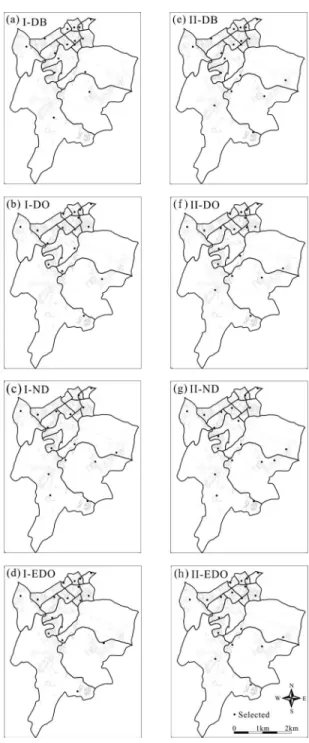
A higher LS ratio implies better local depot placement. Fig. 3 shows the LS ratio of each district and the service ratio of the entire region. For Scenario I, the highest LS ratio of 73% is ob-served for the DB result, because the DB model allows each recycling depot to serve local residents only. Therefore, the de-pots are placed at locations that can serve as many local house-holds as possible. Most districts have high LS ratios except for District L, having only 25% because of the spare population dis-tribution and irregular shape of the district, as shown in Fig. 4共a兲, and most local residents live close to the recycling depots in
Fig. 1. Study area, household groups, and candidate locations
Fig. 2. Average service distances 共m兲 of the results obtained from
different models for both scenarios
Districts K and O. For Scenario II, according to Figs. 3共b兲 and 4共e兲, the DB result again has the highest LS ratio of 78%, while the LS ratio for District L is only 22%.
The DO results in Figs. 3共a兲 and 4共b兲 show that the LS ratios of Districts K, L, and M are all less than 50%, because residents from districts adjacent to these districts are allowed to drop their recycles into the depots located in these districts. These depots are used mostly by residents in adjacent districts rather than local residents. For Scenario II, Figs. 3共b兲 and 4共f兲 show improved LS ratios because of three additional recycling depots, although the LS ratios of Districts H and L are still low.
Figs. 4共c and g兲 show the spatial results obtained from the ND model. The objective of the ND model is to minimize total dis-tance; therefore, the recycling depots are mainly located at places with high population density. Although the ND model obtains results with shortest average distances, Districts A, C, H, J, and L for Scenario I and Districts A, C, H, and J for Scenario II do not have any recycling depot in these districts. Subsequently, resi-dents not living close to highly populated areas will not be served and the LS ratio is thus low for these districts.
Figs. 3共a兲 and 4共d and h兲 show that the EDO results signifi-cantly improved the LS ratios of Districts L and M, as compared to the DO results, although they are still below 50%. The spatial
inequity problem also improves. Fig. 3共b兲 illustrates that the EDO results for Scenario II have high LS ratios exceeding 50%. The recycling depots move to locations that can serve local residents better. The EDO model proves able to significantly improve the low LS ratio problem for the DO results.
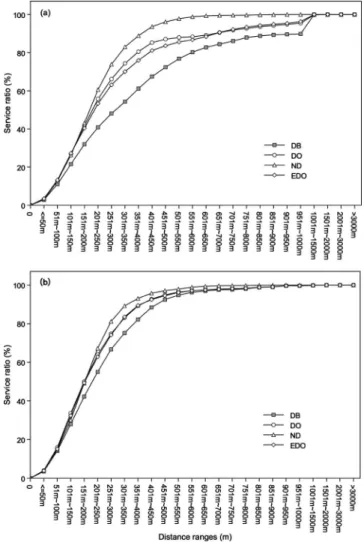
Service Ratios for Different Distance Ranges
Although the LS ratios for different distance ranges of the DB results are superior to other results, as Fig. 5共a兲 shows, the ratio of residents living in the service distance within the range of 1,001 to 1,500 m is significantly high, about 8%. However, Fig. 5共b兲 shows no similar situation for Scenario II. One additional depot for these districts with low population density can significantly
Fig. 3. LS ratios of the results for共a兲 Scenario I; 共b兲 Scenario II
Fig. 4. Solutions obtained for both scenarios using different models:
共a兲 I-DB; 共b兲 I-DO; 共c兲 I-ND; 共d兲 I-EDO; 共e兲 II-DB; 共f兲 II-DO; 共g兲
II-ND; and共h兲 II-EDO
improve service quality. Fig. 6 presents service ratios within var-ied distance ranges for different results for both Scenarios. Fig. 6共a兲 shows substantial increase in the range of 1,001 to 1,500 m, about 10% for the DB results and about 5% for the DO and EDO results. According to Scenario I, results shown in Figs. 5共a兲 and 6共a兲, service ratios for different distance ranges are good for the DB results, but a significant portion of local residents living far from the recycling depots are not served.
For Scenarios I and II, Figs. 6共a and b兲 show that service distances for the ND results are all shorter than 1 km. Although more recycling depots can be established to further improve the LS ratios, the cost of establishing additional depots also increases.
Conclusion
This study develops optimization models to find appropriate lo-cations for installing recycling depots in a city. The performances of the DB, DO, ND, and EDO models for resolving the recycling depot siting problem are compared in terms of the three factors of service distance, LS ratio, and service ratios for different distance ranges. According to the results obtained for the Hsinchu City study area, the LS ratio for DB results is high at 73%, because the DB strategy restricts residents to using depots in their own district
and thus the DB model identifies the depot locations to maximize the LS ratio of each district. However, the average service dis-tances, 86 m for Scenario I and 60 m for Scenario II, for DB results are not as good as those for other solutions due to the irregular shape of District L whose LS ratio is quite low. The average service distances, 60 m for Scenario I and 44 m for Sce-nario II, for ND results are superior to those obtained from the other three models, but the spatial equity problem exists with some districts, e.g., Districts A, C, H, K, and L for Scenario I and Districts A, C, H and K for Scenario II, having no recycling depot. The ND strategy tends to place depots near high population density areas to minimize total service distance and thus leads to some districts having poor LS or no recycling depot. This result thus reveals significant spatial disparity among districts. The DO results compromise the tradeoff between service distance and the LS ratio, and also improve the spatial distribution equity, although the service distance distribution is slightly worse than those of other solutions due to the sparse population distribution in the case study area. After providing additional recycling depots, the difference of average distances and LS ratios among DB, DO, ND, and EDO results is not significant, and thus the LS ratio becomes the essential decision factor. The EDO model provides results with better spatial equity, when no significant difference exists from the other results for the other factors.
Fig. 5. LS ratios within varied distance ranges for共a兲 Scenario I; 共b兲
Scenario II
Fig. 6. Service ratios within varied distance ranges for共a兲 Scenario I;
共b兲 Scenario II
Acknowledgments
The writers thank the National Science Council, R.O.C. for pro-viding partial financial support of this research under Grant No. NSC 96-2221-E-009-056-MY3. The writers also acknowledge the helpful comments and advice received from three anonymous re-viewers regarding the earlier version of this paper.
References
Apotheker, S.共1997兲. “Drop-off deluxe.” Resour. Recycl, 16共1兲, 53–54. Aras, N., and Aksen, D.共2008兲. “Locating collection centers for
distance-and incentive-dependent returns.” Int. J. Prod. Econ., 111共2兲, 316– 333.
Berman, O., Einav, D., and Handler, G.共1991兲. “The zone-constrained location problem on a network.” Eur. J. Oper. Res., 53共1兲, 14–24. Church, R. L.共1990兲. “The regionally constrained p-median problem.”
Geogr. Anal., 22共1兲, 22–32.
Farhan, B., and Murray, A. T.共2006兲. “Distance decay and coverage in facility location planning.” Ann. Reg. Sci., 40共2兲, 279–295. Figueiredo, J. N. D., and Mayerle, S. F.共2008兲. “Designing
minimum-cost recycling collection networks with required throughput.” Transp.
Res. Part E., 44共5兲, 731–752.
Flahaut, B., Laurent, M.-A., and Thomas, I.共2002兲. “Locating a commu-nity recycling center within a residential area: A Belgian case study.”
Profess. Geograph., 54共1兲, 67–82.
Gerrard, R. A., and Church, R. L.共1995兲. “A general construct for the zonally constrained p-median problem.” Environ. Plan. B: Plan. Des.,
22共2兲, 213–236.
Hakimi, S. L.共1964兲. “Optimum locations of switching centers and the absolute centers and medians of a graph.” Oper. Res., 12共3兲, 450–459.
Hakimi, S. L. 共1965兲. “Optimum distribution of switching centers in a communication network and some related graph theoretic problems.”
Oper. Res., 13共3兲, 462–475.
ILOG.共2007兲. Cplex 10.1 user’s manual, ILOG S.A., Gentilly, France. Järvinen, P., Rajala, J., and Sinervo, H.共1972兲. “A branch and bound for
seeking the p-median.” Oper. Res., 20共1兲, 173–178.
Kao, J. J., and Lin, T. I. 共2002兲. “Shortest service location model for planning waste pickup locations.” J. Air Waste Manage. Assoc.,
52共5兲, 585–592.
Narula, S. C., Ogbu, U. I., and Samuelsson, H. M.共1977兲. “An algorithm for the p-median problem.” Oper. Res., 25共4兲, 709–713.
Neebe, A. W.共1978兲. “A branch and bound algorithm for the p-median transportation problem.” J. Oper. Res. Soc., 29共10兲, 989–995. Noehammer, H. C., and Byer, P. H.共1997兲. “Effect of design variables on
participation in residential curbside recycling programs.” Waste
Man-age. Res., 15共4兲, 407–427.
ReVelle, C., and Elzinga, D. J.共1989兲. “An algorithm for facility location in a districted region.” Environ. Plan. B: Plan. Des., 16, 41–50. Solano, E., Dumas, R. D., Harrison, K. W., Ranjithan, S., Barlaz, M. A.,
and Brill, E. D. 共2002a兲. “Life cycle-based solid waste management—1. Model development.” J. Environ. Eng., 128共10兲, 981–992.
Solano, E., Dumas, R. D., Harrison, K. W., Ranjithan, S., Barlaz, M. A., and Brill, E. D. 共2002b兲. “Life cycle-based solid waste management—2. Illustrative applications.” J. Environ. Eng., 128共10兲, 993–1005.
Sparks, K. 共1998兲. “Drop-off recycling in the city.” Resour. Recycl., 17共10兲, 38–40.
Teitz, M. B., and Bart, P.共1968兲. “Heuristic methods for estimating the generalized vertex median of a weighted graph.” Oper. Res., 16共5兲, 955–961.
Valeo, C., Baetz, B. W., and Tsanis, I. K.共1998兲. “Location of recycling depots with GIS.” J. Urban Plann. Dev., 124共2兲, 93–99.