國 立 交 通 大 學
生 物 科 技 學 系
碩 士 論 文
利用虛擬實境模擬系統研究駕駛員從清醒至打瞌
睡過程之腦波變化
Electroencephalographic Spectral Changes from Alertness
to Drowsiness in a Driving Simulator
研 究 生: 鄭 仲 良
指導教授: 林 志 生 博士
梁 勝 富 博士
利用虛擬實境模擬系統研究駕駛員從清醒至打瞌睡過程之腦
波變化
Electroencephalographic Spectral Changes from Alertness to
Drowsiness in a Driving Simulator
研 究 生:鄭 仲 良
Student:Jong-Liang Jeng
指導教授:林 志 生 博士
梁 勝 富 博士
Advisor:Dr. Chih-Sheng Lin
/
Dr. Sheng-Fu Liang
國立交通大學
生物科技學系
碩 士 論 文
A Thesis
Submitted to Department of Biological Science and Technology
National Chiao Tung University
October 2007
Hsinchu, Taiwan, Republic of China
國
立
交
通
大
學
博 碩 士 論 文 全 文 電 子 檔 著 作 權 授 權 書
本授權書所授權之學位論文,為本人於國立交通大學生物科技學系 96
學年度第 一 學期取得碩士學位之論文。
論文題目:利用虛擬實境模擬系統研究駕駛員從清醒至打瞌睡過程之腦
波變化
指導教授:林志生、梁勝富
■ 同意
本人茲將本著作,以非專屬、無償授權國立交通大學與台灣聯合大學系
統圖書館:基於推動讀者間「資源共享、互惠合作」之理念,與回饋社
會與學術研究之目的,國立交通大學及台灣聯合大學系統圖書館得不限
地域、時間與次數,以紙本、光碟或數位化等各種方法收錄、重製與利
用;於著作權法合理使用範圍內,讀者得進行線上檢索、閱覽、下載或
列印。
論文全文上載網路公開之範圍及時間:
本校及台灣聯合大學系統區域網路 ■ 立即公開
校外網際網路
■ 中華民國 98 年 10 月 1 日公開
■ 全文電子檔送交國家圖書館
授 權 人:鄭仲良
親筆簽名:______________________
中華民國 年 月 日
國
立
交
通
大
學
博 碩 士 紙 本 論 文 著 作 權 授 權 書
本授權書所授權之學位論文,為本人於國立交通大學生物科技學系 96
學年度第 一 學期取得碩士學位之論文。
論文題目:利用虛擬實境模擬系統研究駕駛員從清醒至打瞌睡過程之腦
波變化
指導教授:林志生、梁勝富
■ 同意
本人茲將本著作,以非專屬、無償授權國立交通大學,基於推動讀者間
「資源共享、互惠合作」之理念,與回饋社會與學術研究之目的,國立
交通大學圖書館得以紙本收錄、重製與利用;於著作權法合理使用範圍
內,讀者得進行閱覽或列印。
本論文為本人向經濟部智慧局申請專利(未申請者本條款請不予理會)
的附件之一,申請文號為:____________________,請將論文延至____
年____月____日再公開。
授 權 人:鄭仲良
親筆簽名:______________________
中華民國 年 月 日
Electroencephalographic Spectral Changes from
Alertness to Drowsiness in a Driving Simulator
Student: Jong-Liang Jeng
Advisor:Dr. Chih-Sheng Lin
Dr. Sheng-Fu Liang
Department of Biological Science and Technology
National Chiao Tung University
Abstract
Many traffic accidents have resulted from loss of alertness, lack of attention, or poor decision-making of truck and auto drivers. Catastrophic errors can be caused by momentary lapses in alertness and attention during periods of relative inactivity. Therefore, accurate and non-intrusive real-time monitoring of operator alertness would thus be highly desirable in a variety of operational environments. The aim of this study is to investigate the continuous electroencephalogram (EEG) fluctuations from alertness to drowsiness in a realistic virtual-reality-based (VR) driving environment that comprises a 360° virtual reality scene and a driving simulator. Sixteen healthy subjects (aged between 18 and 28) performed 1-hour lane-keeping driving task while their 32-channel EEG signals and driving behavior data were simultaneously recorded at 256 Hz. EEG data, after artifact removal, were processed by independent component analysis (ICA), component cluster analysis and time-frequency analysis to assess EEG correlates of cognitive-state changes. The bi-lateral occipital (BLO), occipital midline (OM), frontal central midline (FCM), central midline (CM), central parietal midline (CPM), left-central parietal (LCP) and right-central parietal (RCP) component clusters exhibited monotonic alpha-band (8-12 Hz) power increase during the transition from alertness to very-slight and slight drowsiness, but remain constant or slight decrease during the extreme drowsiness period. On the other hand, the theta-band (4-7 Hz) power for BLO,
OM, FCM, CM, CPM, LCP and RCP component clusters increased monotonically during the transition from slight to extreme drowsiness. Additionally, we compared the EEG between different component clusters diversity of EEG power changes with respect to the transition from alertness to drowsiness and found that alpha power of BLO and OM component were most stable and desirable EEG feature for very-slight and slight drowsiness detection. The theta power of BLO and OM component were the most stable and desirable EEG feature for slight and extreme drowsiness detection.
Keyword: Drowsiness, Electroencephalogram, Independent Component Analysis, Component Cluster Analysis, Cognitive State, Alpha Wave, Theta Wave.
利用虛擬實境模擬系統研究駕駛員從清醒
至打瞌睡過程之腦波變化
研究生:鄭 仲 良
指導教授:林 志 生 博士
梁 勝 富 博士
國立交通大學生物科技學系碩士班
中文摘要
摘 要
打瞌睡是造成意外事故的主因之一,因此於各種工作環境中,一套可靠、即時的非 侵入式打瞌睡警示系統的建立是有其必要性的。本論文的目標在於利用 360 度虛擬實境 (Virtual-Reality: VR)模擬駕駛系統,藉由一小時將維持車輛在車道中心位置的長時駕駛 工作,探討駕駛員由清醒到打瞌睡的連續腦波(Electroencephalogram: EEG)變化現象。十 六位年齡在 18 到 28 歲間的受測者參與此駕駛模擬實驗,並以 256Hz 取樣頻率同步量測 其 32 通道腦電波與駕駛行為資料。所量測的腦電波在排除雜訊後,利用獨立成分分析 法、時頻分析法,獨立成分分群分析來瞭解人類與清醒到打瞌睡認知狀態改變相關的腦 電波變化,並作為未來發展即時瞌睡警示系統的基礎。 實驗結果顯示,人類在不同打瞌睡的程度之下其腦電波的變化情形也不相同。精神 狀態從清醒至極輕度和輕度瞌睡過程中,在bi-lateral occipital (BLO)、 occipital midline (OM)、 frontal central midline (FCM)、 central midline (CM)、 central parietal midline (CPM)、 left-central parietal (LCP) 與 right-central parietal (RCP)等所得到的獨立成分群 中,α波(8-12Hz)強度會持續性的增強,而進入重度瞌睡時, α波強度則會輕微的降低。 另外,精神狀態從輕度至重度瞌睡過程中,θ波(4-7Hz)強度則持續的增強。實驗結果亦 顯示BLO和OM 的α波是一個較適合用於極輕度打瞌睡的偵測指標,而進入輕度打瞌睡 時,BLO和OM的α和θ波是適合的偵測指標,而重度打瞌睡時,BLO和OM的θ波是一 個較適合的偵測指標。 關鍵字: 打瞌睡、 腦電波、獨立成分分析、獨立成分分群分析、認知狀態、Alpha 波、 Theta 波。 -ii-誌 謝
本論文的完成,首先要感謝交通大學腦科學研究中心的各位教授 林進燈博士、梁 勝富博士、林志生博士及曲在雯博士在過去兩年研究期間,提供豐富的研究資源和實驗 環境,並從旁指導協助,使得本文得以順利完成。 其次,我要感謝我的父母對我的照顧與栽培,教導我做人品德為最,強調人格健全 之發展與學習生活之態度,由於他們辛勞的付出和細心的照顧,才有今天的我。 特別感謝美國加州聖地牙哥大學的 鐘子平教授、段正仁教授及 黃瑞松博士,給予 我研究上最大的協助,從實驗設計、實驗分析、實驗結果討論到論文撰寫,給我最專業 的意見跟看法。 另外,我要感謝腦科學研究實驗室的全體成員,沒有他們也就沒有我個人的成就。 特別感謝 梁勝富教授給予我在各方面的指導,無論是研究上疑難的解答、研究方法、 寫作方式、經驗分享以及生活上壓力調適等惠我良多。另外要感謝明達、弘章以及真如 同學,在過去兩年研究生活中同甘共苦,相互扶持。此外,我也要感謝陳玉潔學姊, 黃 騰毅學長及 柯立偉學長在研究上的幫助,還有感謝柏銓、及玠瑤學弟,在過去這一年 中的相伴。同樣地也感謝實驗室助理在許多事務上的幫忙。 謹以本文獻給我親愛的家人與親友們,以及關心我的師長,願你們共享這份榮耀與 喜悅。 -iii-Contents
Abstract in English
………...………iAbstract in Chinese
………...………..iiAcknowledgement
……….………..iiiContents
………...………...…………ivList of Tables
………..………vList of Figures
………..……….viAbbreviations
………..………...………...vii1. Introduction
………...……….………11.1 Neuroimaging Modalities for Drowsiness Investigation…….……...………….……..1
1.2 EEG Studies related to Drowsiness……….………...2
1.3 Organization of This Thesis………...3
2. System Architecture and Experimental Design
………...……..…………...52.1 3D Virtual Reality Driving Simulation Environment………..………..5
2.2 EEG Data Acquisition……….………...…………..5
2.3 Subjects……….………...………….6
2.4 The Lane Keeping Driving Task……….………..….6
3. Data Analysis
………...………..……….……....83.1 Independent Component Analysis (ICA)………...………..……….…….8
3.2 Smoothed Power Spectral Analysis……….………....10
3.3 Independent Component Clustering……….………..……….…….11
3.4 Sorted Spectral Analysis………..……….………12
4. Results
………..………..………134.1 Independent Component Clusters………..……….………..……13
4.2.1 Bi-Lateral Occipital (BLO) Cluster………....14
4.2.2 Frontal Central Midline (FCM) Cluster………...…………..…….14
4.2.3 Central Midline (CM) Cluster……….…15
4.2.4 Central Parietal Midline (CPM) Cluster………..…………...15
4.2.5 Left Central Parietal (LCP) Cluster……….………….………..…15
4.2.6 Right Central Parietal (RCP) Cluster………..……….………..….16
4.2.7 Occipital Midline (OM) Cluster……….………..………...16
4.3 Summary of Different Component Clusters………….……….16
4.4 The Correlation between Powers of the Different Components.………17
4.5 Comparison of Different Component Clusters………..………...….18
5. Discussion..
……….…………..……….195.1 The EEG Fluctuations from Alertness to Drowsiness……..…….………19
5.2 Lane-Keeping Driving Task Related Cerebral Cortex…………..………..20
5.3 The Fluctuations of EEG Alpha and Theta Power for Detecting Driver’s Drowsiness………..21
6. Conclusions
………...……….………...23References
………...……….….……….24Appendix 1
………...……….……….………59Appendix 2
………...……….………….………63 -iv-List of Tables
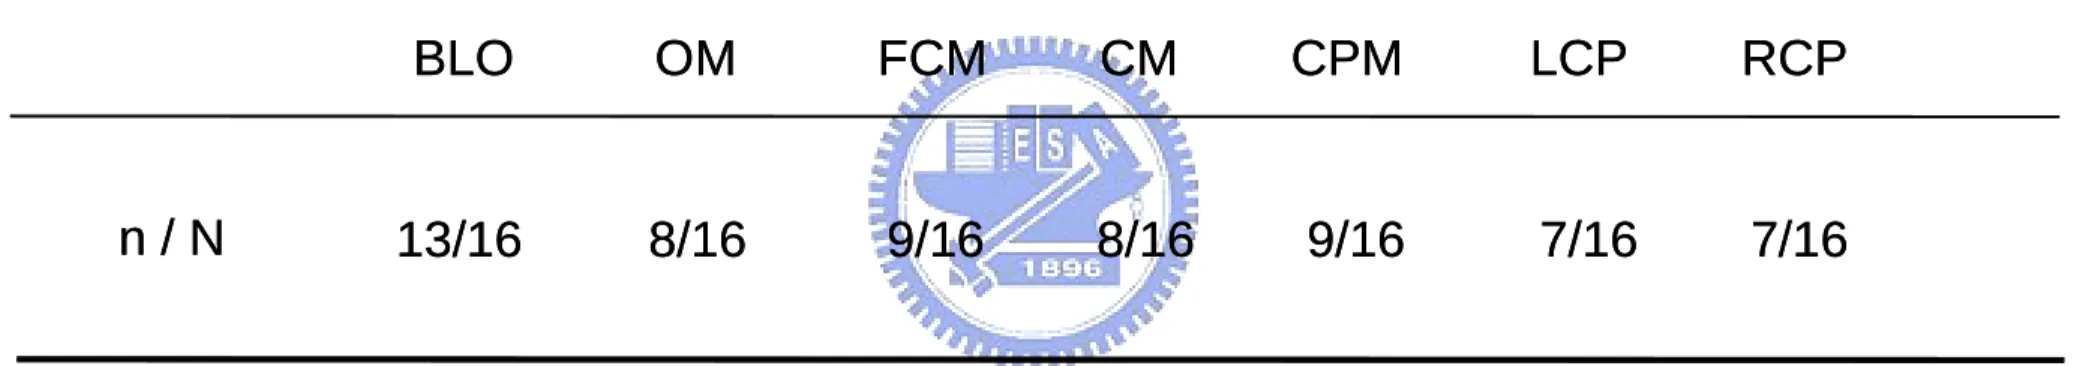
Table I The number of subjects for each cluster………..………...……….31
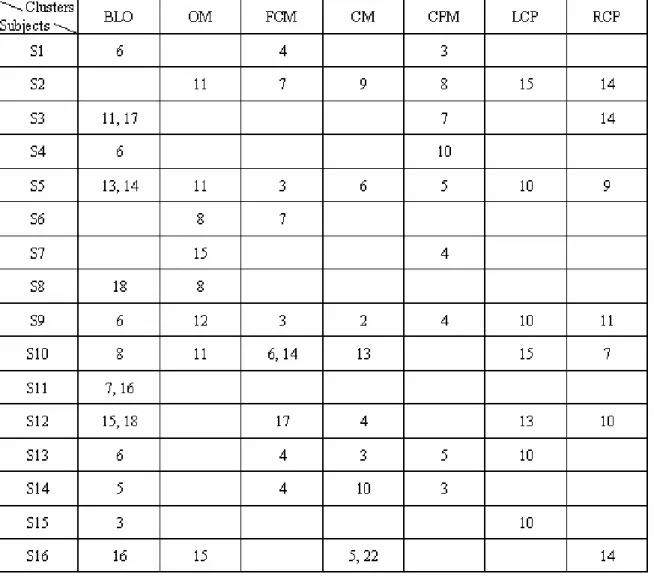
Table II Summary of the component index of subjects in each cluster….………..31
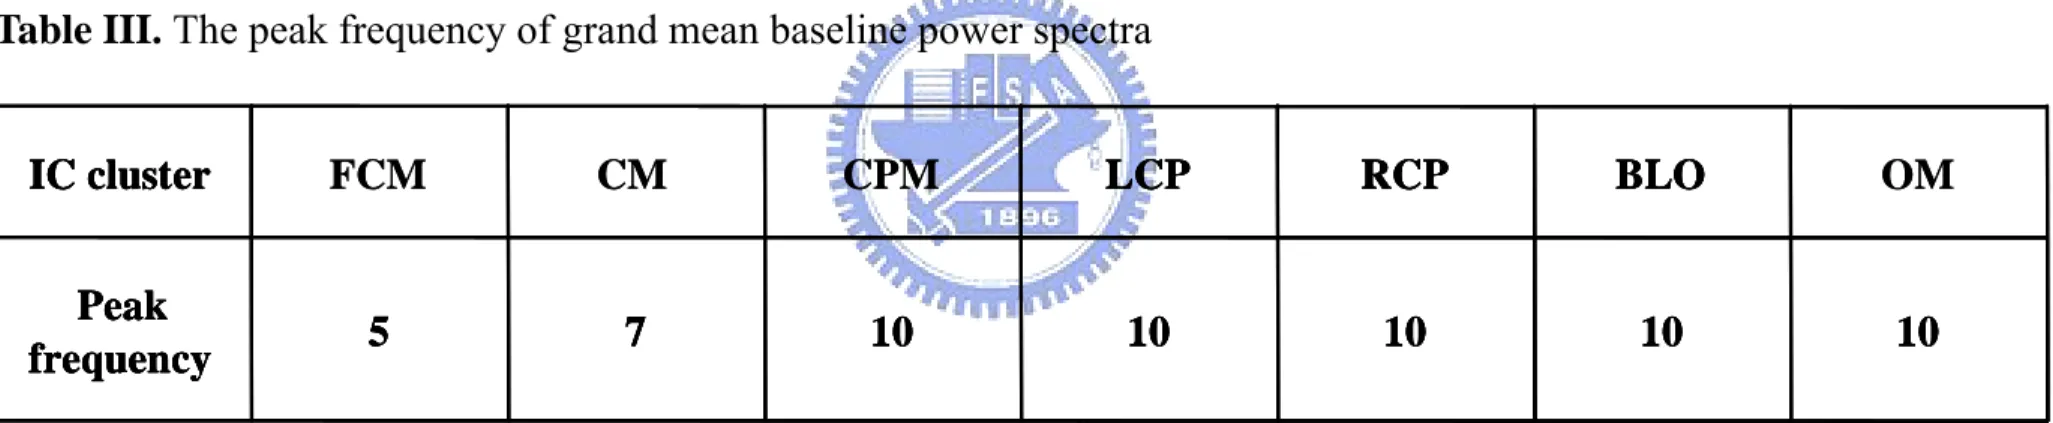
Table III Peak frequencies of grand mean baseline power spectra….……..………..….33
Table IV The percentage of subjects with high correlation between powers of the
different components ………..………..………..31
Table V The R-square values between grand mean of EEG power fluctuations and
first-order linear regression line ………..………….…………...………….…35
Table VI The slop of first-order linear regression line ………..……..…36
Table VII The mean values of standard deviation ………..…..……..…37
List of Figures
Figure 2-1 Block diagram of the VR-based driving simulation environment with the
EEG-based physiological measurement system……….…..38
Figure 2-2 The VR-based four-lane highway scenes are projected into 360° surround screen with seven projectors……….…..……..……39
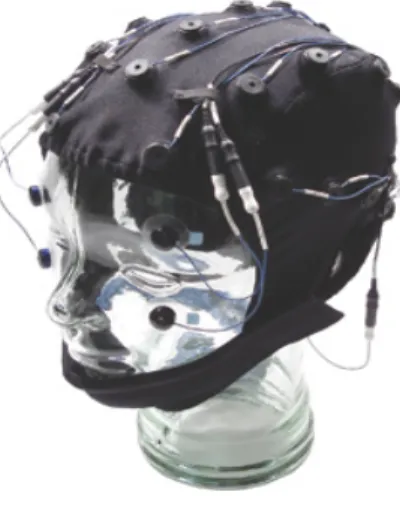
Figure 2-3 The 32 channel EEG cap………40
Figure 2-4 The international 10-20 system of electrode placement………...……..……40
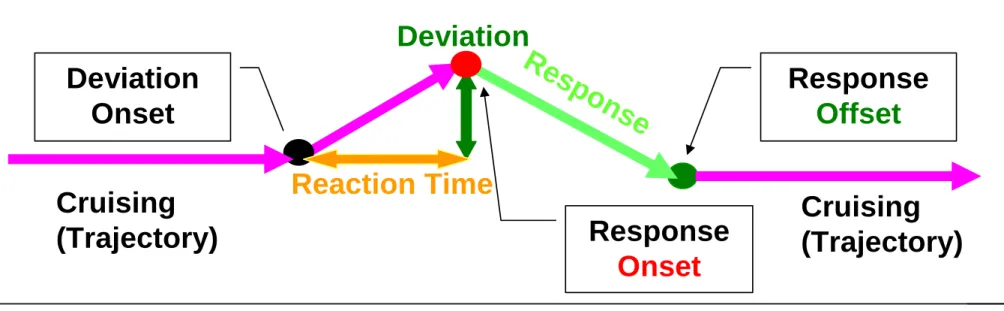
Figure 2-5 The deviation event………..……..……41
Figure 2-6 The digitized highway scene………..42
Figure 2-7 The driving performance………..………..…42
Figure 3-1 The utilized EEG signals processing procedure……….43
Figure 3-2 An example of the scalp topographies of ICA components…………...…………44
Figure 3-3 Time course signals, scalp maps and power spectra of some typical independent components representing different types of artifacts and EEG sources…...………...….45
Figure 3-4 Smoothed power spectral analysis……….……….46
Figure 3-5 Local driving error……….……….46
Figure 3-6 Component clustering analysis….………..………47
Figure 3-7 An example of the sorted spectral analysis……….……...48
Figure4-1 Equivalent dipole source locations and scalp maps for BLO, OM, FCM component clusters………..………...49
Figure 4-2 Equivalent dipole source locations and scalp maps for CM, CPM, LCP, RCP component clusters………..………..50
Figure 4-3 Activations of the BLO component cluster………51
Figure 4-5 Activations of the CM component cluster……….………….53
Figure 4-6 Activations of the CPM component cluster……….………...54
Figure 4-7 Activations of the LCP component cluster……….…………55
Figure 4-8 Activations of the RCP component cluster……….…...…56
Figure 4-9 Activations of the OM component cluster……….….57
Figure 4-10 The grand results of alpha and theta band power spectral density changes accompanying with the sorted LDE for different component clusters…...……58
Abbreviations
Subject Be an Abbreviation for
BLO Bi-Lateral Occipital
CM Central Midline
CPM Central Parietal Midline
EEG Electroencephalogram
FCM Frontal Central Midline
fMRI Functional Magnetic Resonance Imaging
LAN Local Area Network
LCP Left Central Parietal
LDE Local Driving Error
MEG Magnetoencephalography NSF National Sleep Foundation
OM Occipital Midline
PC Personal Computer
PET Positron Emission Tomography
RCP Right Central Parietal
SPECT Single-Photon Emission Computed Tomography
VR Virtual Reality
Chapter 1. Introduction
In the working environment, a human in drowsiness often exhibits relative inattention to environments, eye closure, less mobility, failure to motor control and decision making [1]. Therefore, many disasters and near-disasters can be caused by falling drowsiness especially for machine operators who pose a danger not only to themselves but often also to the public at large. Recently, safety driving has received increasing attention of the public due to the growing number of traffic accidents. Drivers’ fatigue has been implicated as a causal factor in many traffic accidents. The National Sleep Foundation (NSF) reported that 60% of adult drivers (about 168 million people) felt drowsy while driving vehicles and 37% or 103 million people actually fell asleep during driving in 2005. Additionally, the sleep related crashes are most common in young people, especially for adult males and shift workers [2]. NSF also reported that adults aged between 18-29 years old are much more likely to drive while drowsy compared to other age groups. Males are more likely than females to drive while drowsy (56% vs. 45%) and males are almost twice as likely as females to fall asleep while driving (22% vs. 12%) investigated in 2002 [2]. Hence, drowsiness detection and prevention is very important to avoid disasters such as vehicle crashes in working environments.
1.1 Neuroimaging Modalities for Drowsiness Investigation
Drowsiness is a cognitive state of near-sleep, a strong desire for sleep, or sleeping for unusually long periods [3]. The drowsiness is an active brain phenomenon controlled by some brain areas such as brainstem, hypothalamus, and basal forebrain. Among these regions, the ascending arousal system circuitry regulates our sleep and wakefulness [4-5].
A lot of methods have been proposed to investigate the brain activities that include single unit recording, local field potential, functional magnetic resonance imaging (fMRI), positron emission tomography (PET), single-photon emission computed tomography (SPECT),
magnetoencephalography (MEG) and electroencephalography (EEG), etc. These methods can be classified into two main categories: the invasive and non-invasive approaches.
The first approach, invasive recordings, can be further divided into two methods. The first method is the single-unit recording. It uses an electrode to record the electrophysiological activity (action potentials) from a single neuron. Recordings of single neurons in living animals have provided important insights into how the brain processes information, following the hypothesis put forth by Edgar Adrian that unitary action potential events are the fundamental means of communication in the brain [6]. The second method records local field potentials. The local field potential is a particular class of electrophysiological signals, which is related to the sum of all dendritic synaptic activities within a volume of tissue. The local field potential is believed to represent the synchronised inputs into the observed area. The invasive approach has excellent spatial and temporal resolutions, but it needs a surgery to introduce the electrodes into the brain. Therefore, this approach is inconvenient and undesirable for normal subjects.
The second approach is non-invasive imagines that include fMRI, PET, SPECT, MEG and EEG [7-8]. The fMRI, PET, MEG and SPECT have higher spatial resolution than EEG (MRI: 1~1.5 mm, PET: 4 mm, MEG: 5 mm, SPECT: 6-8 mm, EEG: 10-15 mm). However, the EEG and MEG have higher temporal resolution than MRI, PET and SPECT (EEG: 1 msec, MEG: 1 msec, MRI: 3-5 sec, PET: 45 sec, SPECT: >60 sec) [7]. In order to investigate the continuous brain activity changes during the transition from alertness, to very-slight, slight and extreme drowsiness, the temporal resolution is the major concern. Due to high temporal resolution, convenience of recording and feasibility of real world applications, EEG signals were recorded and analyzed in this study.
1.2 EEG Studies related to Drowsiness
drowsiness are not consistent. Parikh and Tzanakou showed that power of the EEG alpha band increased when subjects were drowsy [9]. Schier reported that alpha activity increased during long-term driving task [10]. These studies suggested that alpha power changes are related to drowsiness. On the other hand, Makeig and Jung showed that theta power during drowsy state was higher than that during alert state [11-14]. Lal and Craig found that delta and theta activities were increasing during long-term driving task [15]. Campagne et al. showed that degradation of driving performance is correlated with increased EEG theta power [16-17]. These studies suggested that power increase in theta band accompanied with drowsiness. In our previous study, it showed that alpha and theta power are correlated with drowsiness [18-20]. It is important and meaningful to explain why the EEG features related to drowsiness observed by different studies are not consistent. These studies might observe brain activity changes related to different spots (drowsiness levels) during alertness to extreme drowsiness spread. In addition, lap by lap analysis for simulated driving experiments will also eliminate the EEG fluctuations during within laps [9, 15-16].
Hence, this study attempts to investigate the continuous EEG fluctuations from alertness to drowsiness. Long-term driving in a virtual reality driving simulator will induce various cognitive states of subjects including alertness, very-slight, slight and extreme drowsiness. EEG dynamic changes will be analyzed according to the sorted driving errors that indirectly indicate the continuous transition from alertness to drowsiness. Component cluster analysis and time-frequency analysis are utilized to assess EEG correlates of the cognitive-state changes across subjects. The observations of this study form the base of accurate and non-intrusive real-time monitoring of operator alertness that will be highly desirable in a variety of operational environments.
1.3 Organization of This Thesis
experiment, VR-based driving environment, EEG data collection, instructions, and subjects in the experiments. Section III introduces the EEG analysis procedure including independent component analysis (ICA), clustering analysis, and time-frequency analysis to assess EEG fluctuations in different brain areas that involve in driving or alertness level changes. Section IV shows the experimental results and the discussion is given in Section V. Finally, we conclude our findings in Section VI.
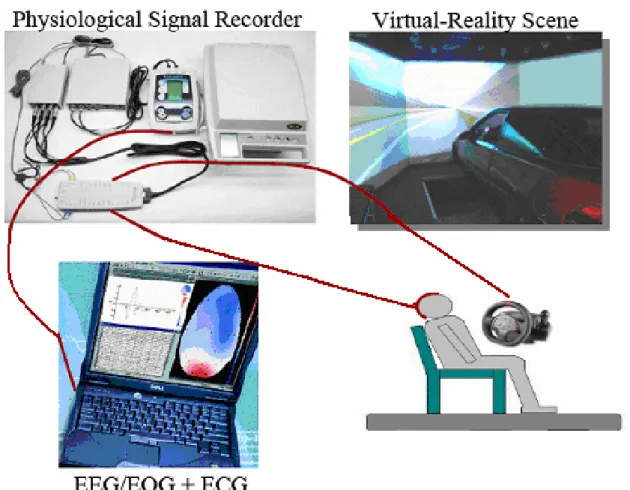
Chapter 2. System Architecture and Experimental Design
In this study, a VR-based driving system was applied for interactive driving experiments [18]. It included two major parts as shown in Fig 2-1: (1) the 3D highway driving scene based on the virtual reality technology and (2) the EEG physiological signal measurement system with 32-channel EEG sensors. The full details of experimental system architecture will describe as flowers.2.1 3D Virtual Reality Driving Simulation Environment
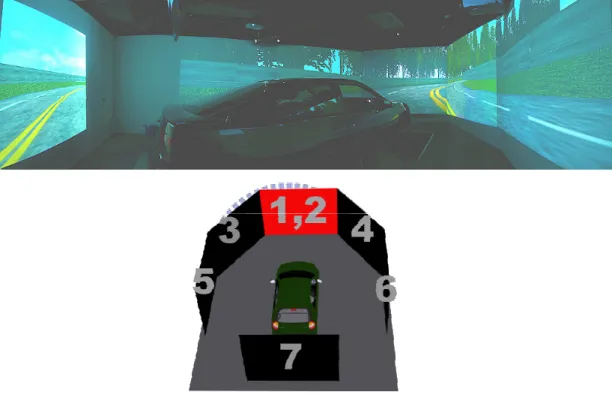
A VR-based 3D high-fidelity interactive highway scene, generated by seven PCs, synchronized by LAN, running the same VR program, was developed to simulate the long-term driving task. The synchronized scenes were projected from seven projectors to constitute a 360o surrounding vision. Additionally, a real vehicle (without the unnecessary weight of an engine and other components) was set in the middle of the VR scene to simulate real driving environments. The VR-based 3D high-fidelity interactive highway scene was showed in Fig 2-2.
2.2 EEG Data Acquisition
Thirty-two channel EEG signals (using sintered Ag/AgCl electrodes and the reference was the mean of the left and right mastoid electrodes), and one 8-bit digital signal representing the driving performance produced from VR scene were simultaneously recorded by the Scan NuAmps Express system (Compumedics Ltd., VIC, Australia). Fig 2-3 shows the 32 channel EEG electrode cap. All EEG channels were located based on a modified International 10-20 system as shown in Fig 2-4 [21]. The 10-20 system is based on the relationship between the locations of an electrode and the underlying area of cerebral cortex. Before acquiring EEG data, the contact impedance between EEG electrodes and the skin was
calibrated to be less than 5kΩ by injecting NaCl based conductive gel. The EEG data were recorded with 16-bit quantization levels at a sampling rate of 500 Hz and were down sampled to 250 Hz for the simplicity of data processing. All EEG data were preprocessed using simple low-pass filter (50Hz) and high-pass filter (0.5Hz) in order to remove the 60Hz line noise, high-frequency artifacts and the electrogalvanic signals for further analysis.
2.3 Subjects
The purpose of this study is to investigate human EEG Changes from alertness to drowsiness in a dynamic driving environment. It is known that the drowsiness often occurs during late nights, early morning, mid-afternoon and especially after meal times [23]. During these periods, alertness may easily diminish within one-hour monotonous working [24-25]. In our experiment, the volunteers participated in the simulated long-term highway lane-keeping driving after lunch in the early afternoon.
Sixteen healthy volunteers (three females and thirteen males, aged from 18 to 28 years) participated in the experiment that includes two or more sessions for each subject. All subjects were instructed to keep the car at the center of the cruising lane by controlling the steering wheel. In all sessions, subjects drove the car continuously for 60 minutes and were asked to try their best to keep alert.
2.4 The Lane Keeping Driving Task
In the long-term driving, the car cruised with a fixed velocity of 100 km/hr on the VR-based highway scene and it was randomly drifted either to the left or to the right away from the cruising position with a constant velocity. The subjects were instructed to steer the vehicle back to the center of the cruising lane as quickly as possible. Fig 2-5 shows the time course of a typical deviation event that embedded in the long-term lane-keeping driving task. Firstly, we need to quantify the volunteer’s drowsiness level in this experiment. When
subjects fall drowsy, they often exhibit relative inattention to environments, eye closure, less mobility, failure to motor control and making decision [1].Hence, the vehicle deviations were defined as the subject’s drowsiness index. The VR-based four-lane straight highway scene was applied in the experiment. In this scene, the four lanes from left to right are separated by a median stripe and the distance from the left side to the right side of the road was equally divided into 256 points indicating the position of the vehicle as the digital output signal of the VR scene at each time instant as shown in Fig 2-6. The width of each lane and the car is 60 units and 32 units, respectively. Fig 2-7 shows an example of the driving performance represented by the vehicle deviation trajectories.
Chapter 3. Data Analysis
The flowchart of the utilized EEG data analysis procedure is showing in Fig 3-1. The EEG data were preprocessed using a simple low-pass filter and a high-pass filter with cut-off frequency above 50 Hz and below 0.5 Hz, respectively, to remove 60Hz line noise, high-frequency artifacts and electrogalvanic signals before further analysis. Firstly, independent component analysis (ICA) was applied to decompose EEG signals into various temporally statistical independent activations (ICA components) and calculated the moving-averaged log power spectra of the resultant ICA components. Then we clustered the components of all volunteers to find the stable and inter-subject consistency components. Finally, we used the sorted spectral analysis to investigate the EEG dynamic changes from alertness to drowsiness. Details of the utilized analysis methods mentioned in above are introduced as flowers.
3.1 Independent Component Analysis
ICA is a signal processing technique that separates multi-channel observation data into temporally independent stationary sources by the obtained un-mixing matrix after training [26]. By using ICA, we attempt to remove EEG artifacts and extract EEG sources in different brain areas that involve in driving or alertness level changes.
ICA methods have been extensively applied to the blind source separation problem since the 1990s [27-30]. Subsequent technical reports [31-37] demonstrated that ICA was a suitable solution to the problem of EEG source segregation, identification, and localization. In this study, we used an extended version of the infomax algorithm of Bell and Sejnowski [38] that can separate sources with either super- or sub-Gaussian distributions, to decompose distinct brain activities.
) t ( ) t ( As x = (1)
where A is a linear transform called a mixing matrix and the s are statistically mutually i
independent. The ICA model describes how the observed data are generated by a process of mixing the components s . The independent components i s (often abbreviated as ICs) are i
latent variables, meaning that they cannot be directly observed. Also the mixing matrix A is assumed to be unknown. All we observed are the random variables x , and we must estimate i
both the mixing matrix and the IC’s s using the i x . i
Therefore, given time series of the observed data
[
]
T N(t) x ) t ( x ) t ( x ) t ( = 1 2 Λ x inN-dimension, ICA will find a linear mapping W such that the unmixed signals u(t) are
statically independent.
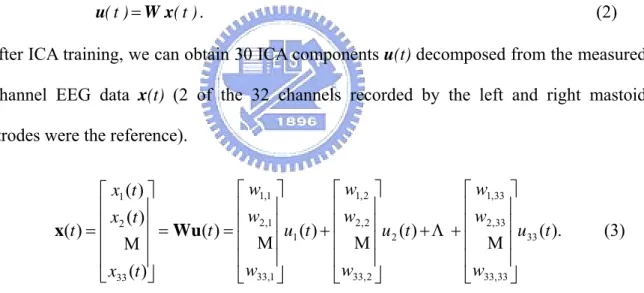
u(t)=W x(t). (2)
After ICA training, we can obtain 30 ICA components u(t) decomposed from the measured 30-channel EEG data x(t) (2 of the 32 channels recorded by the left and right mastoid electrodes were the reference).
). ( ) ( ) ( ) ( ) ( ) ( ) ( ) ( 33 33 , 33 33 , 2 33 , 1 2 2 , 33 2 , 2 2 , 1 1 1 , 33 1 , 2 1 , 1 33 2 1 t u w w w t u w w w t u w w w t t x t x t x t ⎥ ⎥ ⎥ ⎥ ⎦ ⎤ ⎢ ⎢ ⎢ ⎢ ⎣ ⎡ + + ⎥ ⎥ ⎥ ⎥ ⎦ ⎤ ⎢ ⎢ ⎢ ⎢ ⎣ ⎡ + ⎥ ⎥ ⎥ ⎥ ⎦ ⎤ ⎢ ⎢ ⎢ ⎢ ⎣ ⎡ = = ⎥ ⎥ ⎥ ⎥ ⎦ ⎤ ⎢ ⎢ ⎢ ⎢ ⎣ ⎡ = Μ Λ Μ Μ Μ Wu x (3)
Fig 3-2 shows an example of the scalp topographies of ICA weighting matrix W corresponding to each ICA component by projecting each wi,j onto the surface of the scalp,
which provides spatial information about the contribution of each ICA component (brain source) to the EEG channels.
Fig 3-3 shows the time course signals, scalp maps and power spectra of some typical independent components representing different types of artifacts and EEG sources. Fig 3-3 (A) shows the eye blink component which had some large peaks and its physiological origin is
from far frontal site. Fig 3-3 (B) shows the horizontal eye movement component which had large fluctuations and the physiological origin is also from far frontal site. Figs 3-3 (C) and (D) show the temporal muscle component and the channel noise component that also had peaky activations and without spread scalp maps. In addition, there were spectral peaks above 20 Hz for temporal muscle component shown in Fig 3-3 (C). Fig 3-3 (E) shows the EEG source whose scalp map spreads smoothly. Hence we removed the artifact components including eye blink components, eye movement components, temporal muscle components, and channel noise components in our experiment through independent component analysis [39-41]
3.2 Smoothed Power Spectral Analysis
Moving-averaged spectral analysis of the EEG data of the extracted ICA components was first accomplished using a 750-point Hanning window with 250-point overlap. Windowed 750-point epochs were further subdivided into several 125-point subwindows using the Hanning window again with 25-point step. Each 125-point frame was extended to 256 points by zero-padding to calculate its power spectrum by using a 256-point fast Fourier transform (FFT), resulting in power-spectrum density estimation with a frequency resolution near 1 Hz. A moving median filter was then used to average and minimize the presence of artifacts in the EEG records of all sub-windows. Previous studies [42,43] show that the transient amplitudes of EEG power spectrum involved in wake-sleep regulation are very different. The cortex produces low amplitude and fast oscillations during waking, and generates high-amplitude, slow cortical oscillations during the onset of sleep. Their reports also showed that the EEG spectral amplitudes correlated with the wake-sleep transition more linearly in the logarithmic scale than in the linear scale. Thus, the ICA power spectra were further converted into a logarithmic scale. The resultant time series of ICA log power spectra for each session consisted of the power spectra of 30 ICA components across 40 frequencies (from 1 to 40 Hz)
stepping at 2-second (500-point, an epoch) time intervals [18]. Fig. 3-4 shows the smoothed spectral analysis procedure.
Since alertness level fluctuates with cycle lengths longer than 4 minutes [11, 44], we smoothed the ICA power spectra and the driving performance time series by using a causal 90-second square moving-averaged filter to eliminate variances at cycle lengths shorter than 1–2 minutes. The smoothed driving performance was called “local driving error (LDE)” as shown in Fig 3-5. The LDE is an indirect index of the alertness level and we will assess the relationships between subject’s local driving error and his/her smoothed ICA log power spectra to investigate human’s EEG spectral changes from alertness to drowsiness in driving.
3.3 Independent Component Clustering
In order to find the stable and inter-subject consistency sources related to alertness changes, we clustered the EEG sources of all volunteers. The components of all volunteer were clustered semi-automatically based on the gradients values:
[
Gx
i,Gy
i]
(4) of the component scalp maps [41]. K-mean algorithm [45] was utilized for clustering. The K-mean clustering is to classify or to group objects based on attributes/features into K number of groups. K is a positive integer number. The grouping is done by minimizing the sum of squares of distances between the data and the corresponding cluster centroid as:2
∑
− = i i k kx
y
e
(5)where e represent the square error, k x andi y represent the data point and cluster centers, k
respectively. Fig. 3-6 shows the diagram of component clustering analysis.
For each ICA activation map, we perform an EEG source localization procedure to locate its single dipole. By localizing multiple dipoles independently, we substantially reduce our search complexity and increase the likelihood of efficiently converging on the correct solution.
The independent EEG processes and their equivalent dipole source locations were obtained by using the EEGLAB toolbox (Makeig, et al., 2004).
3.4 Sorted Spectral Analysis
Since the LDE is an indirect index of the alertness level, we propose the sorted spectral analysis method that sorts the smoothed ICA log power spectra according to the LDE index to assess the brain dynamics corresponding to the transition from alertness (lower LDE values) to drowsiness (larger LDE values) in driving. Fig. 3-7 shows an example of the sorted spectral analysis. The left subplot of Fig. 3-7 is a subject’s original LDE trajectory (the blue line) and the corresponding alpha power changes (the red line). The right subplot sorts the LDE values in ascending order and shows the transient alpha powers corresponding to the sorted LDE values. It can be found that the alpha power is increasing at the beginning and will decrease at the latter when LDE values are ascending. According to our experimental results presented in Chapter 4, the power changes of some ICA component clusters accompanying with the LDE increasing can be obviously observed. It is noted that we assumed the alertness levels of all subjects in the lowest LDE states were the same and the difference of the lowest LDE values corresponding to different subjects are caused by the individual reaction speed.
Chapter 4. Results
Analysis results of the EEG data and driving trajectories acquired from the sixteen volunteer drivers are presented in this chapter. As shown in Chapter 3, we performed ICA to separate the EEG contributions of distinct brain processes and clustered the resultant ICA components from all volunteers to find the stable and inter-subject consistency components. Finally, we explored the spectral changes of the clustered components through time-frequency analysis and the sorted spectral analysis to investigate the EEG dynamic changes from alertness to drowsiness in long-term driving. The detailed EEG phenomena of components in different component clusters are show in Appendix 1. The results of component clustering and the grand results of the sorted spectral analysis are presented in the following sections.
4.1 Independent Component Clusters
The EEG components were clustered based on their scalp map gradients across subjects. Figs. 4-1 and 4-2 show the equivalent dipole source locations and scalp maps for seven component clusters. In each column, the upper panel is the source locations of the corresponding component cluster in the below panel. Dipole spheres of different volunteers are represented by different colors in the upper panels and the lower panels show the scalp maps of the clustered components. The label above each scalp map represents the index of the volunteer and the component index of the volunteer. In Fig. 4-1, the left, the middle, and the right component clusters represent the Bi-Lateral-Occipital (BLO), the Occipital-Midline (OM), and the Frontal-Central-Midline (FCM) EEG sources, respectively. In Fig. 4-2, the left, the middle-left, the middle-right, and the right component clusters represent the Central-Midline (CM), the Central-Parietal-Midline (CPM), the Left-Central-Parietal (LCP), and the Right-Central-Parietal (RCP) EEG sources, respectively. The number of volunteers for each cluster is shown in Table I and the residual variances and the Talairach coordinates
of the equivalent dipole source of each component cluster are summarized in Appendix 2. The results of clustering analysis are displayed that clusters without involve the components from each subject. Hence, only the subjects that include in clusters were for further analysis. Table II shows the summary of the component index of subjects in each cluster.
4.2 Activations of Component Clusters
4.2.1 Bi-Lateral Occipital Cluster
Fig. 4-3 shows activations of the Bi-Lateral Occipital (BLO) cluster. Fig. 4-3 (A) presents the grand mean of the scalp map and the baseline power spectral. Fig. 4-3 (B) shows the grand mean log power spectral density changes accompanying with the sorted LDE in ascending order. Figs. 4-3 (C) and (D) show the transient alpha and theta powers corresponding to the ascending LDE values, respectively. In Figs. 4-3 (A), (C) and (D), the solid lines represent the grand mean power spectra and the dotted lines represent the variance of the power spectra. These notifications will be utilized in the illustrations of the other component clusters. In Fig. 4-3 (A), we can find that the peak frequency is near 10 Hz for BLO component cluster. Despite variations in EEG recordings across volunteers, the grand mean power spectral density changes accompanying with the sorted LDE values. According to Figs. 4-3 (B), (C) and (D), we can find that the alpha power (8~12 Hz) increases monotonically when the volunteers’ LDE values are less than 20 and the alpha power at LDE = 20 increases about 3 dB compared with the baseline (LDE = 0). Then the alpha power sustains when LDE values are less than 40. Different with the alpha band, the theta power (4~7 Hz) increases monotonically from low LDE to high LDE.
4.2.2 Frontal Central Midline Cluster
Fig. 4-4, the peak frequency of the baseline power spectral is near 5 Hz for FCM component cluster. According to Figs. 4-4 (B)-(D), it can be found that the powers of the alpha band and the theta band increase monotonically from low LDE to high LDE.
4.2.3 Central Midline Cluster
Fig. 4-5 shows activations of the Central Midline (CM) cluster. Fig. 4-5 (A) shows that the peak frequency of the baseline power spectral is near 7 Hz for CM component cluster. Similar to the BLO component, we can find that the alpha power increases monotonically when the volunteers’ LDE values are less than 20 and the alpha power at LDE = 20 increases about 0.7 dB compared with the baseline (LDE = 0). Then the alpha power sustains when LDE values are less than 40. The theta power also increases monotonically from low LDE to high LDE.
4.2.4 Central Parietal Midline Cluster
Fig. 4-6 shows activations of the Central Parietal Midline (CPM) cluster. Fig. 4-6 (A) shows that the peak frequency of the baseline power spectral is near 10 Hz for CPM component cluster. Similar to the BLO component, we can find that the alpha power increases monotonically when the volunteers’ LDE values are less than 20 and the alpha power at LDE = 20 increases about 0.5 dB compared with the baseline (LDE = 0). Then the alpha power sustains when LDE values are less than 40. The theta power also increases monotonically from low LDE to high LDE.
4.2.5 Left Central Parietal Cluster
Fig. 4-7 shows activations of the Left Central Parietal (LCP) cluster. Fig 4-7 (A) shows the peak frequency of the baseline power spectral is near 10 Hz for LCP component cluster. Similar to the BLO component, we can find that the alpha power increases monotonically
when the volunteers’ LDE values are less than 20 and the alpha power at LDE = 20 increases about 0.5 dB compared with the baseline (LDE = 0). Then the alpha power sustains when LDE values are less than 40. The theta power also increases monotonically from low LDE to high LDE.
4.2.6 Right Central Parietal Cluster
Fig. 4-8 shows activations of the Left Central Parietal (RCP) cluster. Fig. 4-8 (A) shows that the peak frequency of the baseline power spectral is near 10 Hz for RCP component cluster. Similar to the BLO component, we can find that the alpha power increases monotonically when the volunteers’ LDE values are less than 20 and the alpha power at LDE = 20 increases about 1 dB compared with the baseline (LDE = 0). Then the alpha power sustains when LDE values are less than 40. The theta power also increases monotonically from low LDE to high LDE.
4.2.7 Occipital Midline Cluster
Fig. 4-9 shows activations of the Occipital Midline (OM) cluster. Fig 4-9 (A) shows that the peak frequency of the baseline power spectral is near 10 Hz for OM component cluster. Similar to the BLO component, we can find that the alpha power increases monotonically when the volunteers’ LDE values are less than 20 and the alpha power at LDE = 20 increases about 3 dB compared with the baseline (LDE = 0). Then the alpha power sustains when LDE values are less than 40. The theta power also increases monotonically from low LDE to high LDE.
4.3 Summary of Different Component Clusters
In this session, we summarize the grand results of power spectral baseline as well as the alpha and theta power spectral density changes accompanying with the sorted LDE for
different component clusters. Table II shows the peak frequency of the grand mean baseline power spectra corresponding to each cluster. We can see that component clusters located in the occipital and parietal lobes have a peak frequency near 10 Hz. In addition, the peak frequency shifts to 7Hz and 5Hz for CM and FCM component clusters, respectively. Fig. 4-10 shows the grand results of alpha and theta band power spectral density changes accompanying with the sorted LDE for different component clusters. Based on the EEG fluctuations, the cognitive states were classified into very-slight drowsiness as portion (1) of Fig. 4-10, slight drowsiness as portion (2) of Fig. 4-10 and extreme drowsiness as portion (3) of Fig 4-10. The results show that alpha band power increased during the transition from alertness to very-slight and slight drowsiness, but remain constant or slight decrease during extreme drowsiness period for each cluster. On the other hand, the theta band power for each component cluster increased monotonically during the transition from slight to extreme drowsiness. Additionally, the EEG fluctuations were greatly in occipital lobe compared with the other lobes.
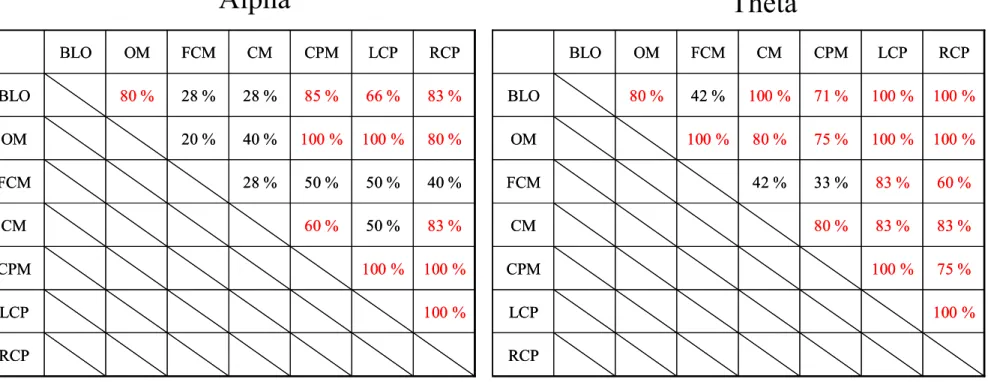
4.4 Correlations between Powers of Different Components
In Fig. 4-10, the grand results show that the trends of alpha and theta power changes from alertness to drowsiness were similar between different brain regions. Hence, we compared the EEG fluctuations in time series between different components of intra-subject. Table III shows the percentage of subjects with high correlations between powers (correlation coefficient > 0.6) of different components. In these results, the alpha powers of BLO, OM, CPM, LCP and RCP components had high cross correlations and the theta powers of BLO, OM, CM, CPM, LCP and RCP components had high cross correlations for most subjects. These results show that drowsiness related alpha and theta rhythm in these different components may be modulated by the same nucleus. It needs and is worth the further study to investigate this co-modulation effect.
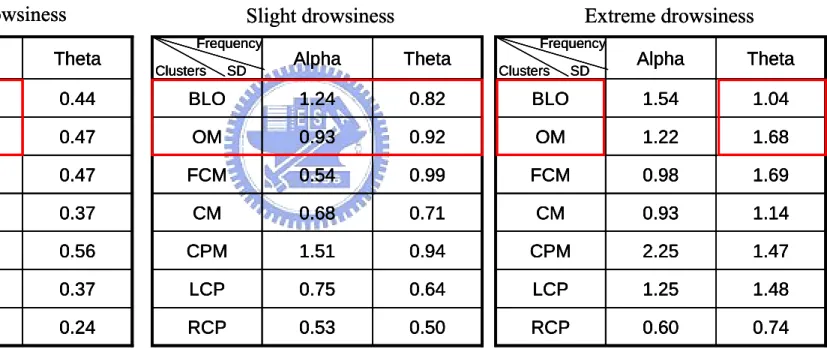
4.5 Comparisons of Different Component Clusters
In this session, we compared the diversity of EEG power changes related to the transition from alertness to drowsiness corresponding to different component clusters. Table I shows the number of volunteers for each cluster. When the value is high, the component is more stable between subjects. In Table IV, we calculated the R-square values between grand mean of EEG power fluctuations and the estimated linear regression line. When the R-square value is high, the EEG power fluctuation is more linear. In Table V, we compared the slop of estimated linear regression line. When the slop value is high, the fluctuations of EEG power are larger when the cognitive state changes from alertness to drowsiness. Finally, we compared the mean value of standard deviation during very-slight, slight and extreme drowsiness for each component cluster and the results were shown in Table VI. When the mean value is high, the variations of EEG power were larger across subjects. Based on these EEG properties, alpha power of BLO and OM components were the most stable and desirable EEG feature for very-slight drowsiness detection. Additionally, the alpha and theta power of BLO and OM component were the most stable and desirable EEG feature for slight drowsiness detection. Lastly, the theta power of BLO and OM component were the most stable and desirable EEG feature for extreme drowsiness detection.
Chapter 5. Discussion
The purpose of this study is to investigate continuous EEG fluctuations from alertness to drowsiness in a realistic VR based driving environment. Firstly, we applied ICA to the EEG collected from each individual separately. Then we clustered the EEG sources from all the volunteer participants based on their scalp map gradients. Seven component clusters were identified: BLO, OM, FCM, CM, CPM, LCP and RCP clusters. Secondly, time-frequency analysis is used to assess consistent EEG correlates of the cognitive-state changes across subjects. The results show that alpha band power increase during the transition from alertness to very-slight and slight drowsiness, but remain constant or slightly decrease during extreme drowsiness period for all the clusters. On the other hand, the theta band power of each component cluster increased monotonically during the transition from slight to extreme drowsiness. The experimental results show that previous studies might just investigate parts of transition from alertness to drowsiness.
5.1 The EEG Fluctuations from Alertness to Drowsiness
The EEG fluctuations from alertness to drowsiness during this experiment were comparable to the results that reported in previous studies [46]. In traditional sleep EEG studies, the alpha-power decrease and theta-power increase were the EEG characteristics of sleep stage 1 (also called “Drowsiness”) and microsleep [42-43, 47-48]. It is similar to the results in our extreme drowsiness periods. This study focuses on the cognitive-state transition during wakefulness and finds the theta power not only increases from wakefulness to sleep stage 1 but also from alertness to drowsiness.
The alpha rhythm is the first defined EEG rhythm (Berge, 1929). EEG synchronization within the alpha band is an electrophysiological correlate of cortical idling [49-50]. The areas that are not processing sensory information or motor output can be considered to be in an
idling state.Therefore, drowsiness could an idling state of the brain.
The trends of alpha- and theta-power changes from alertness to drowsiness were similar between different brain regions. Additionally, Table III also shows that high percentage of subjects with high correlation between powers of the different components. Hence, the drowsy related alpha and theta rhythm in these components maybe modulated by the same nucleus [51-55]
5.2 Lane-Keeping Driving Task related Cerebral Cortex
According the Brodmann’s map, the BLO and OM clusters were located in visual cortices (Area 17, 18, a.k.a. V1, V2). The V1 cortex is the simplest, earliest cortical visual area. It is highly specialized for processing information about static and moving objects and was excellent in pattern recognition [56-57]. It seems physiologically feasible that V1 which includes very large attentional modulation [58-59] involves in this task. V2 was the second major area in the visual cortex. It received strong feedforward connections from V1 and sended strong connections to V3, V4, and V5. Functionally, V2 had many properties in common with V1 and recent research had shown that V2 cells exhibit a small amount of attentional modulation [59]. Therefore, the inclusion of V2 in this lane-keeping driving task seems also plausible.
The CPM component cluster was located near areas 7 and 19 (V3). V3 was a term used to refer to the regions of cortex located immediately in front of V2. V3 can be divided into two subareas, dorsal V3 and ventral V3. Dorsal V3 was normally considered to be a part of the dorsal stream. Recent work with fMRI had suggested that area V3 may play a role in the processing the information of global motion [60]. The area 7 was a somatosensory association cortex that involves in locating objects in space. It served as a point of convergence between vision and proprioception to determine where objects are in relation to parts of the body [61-62]. In this study, the experimental setup was based on 360o VR technology. When the car
drifted in this VR environment, the subject received the motion and spatial information during the epxeriments, which might explain the involvement of Aera 7.
The LCP, RCP and CM clusters located near Brodmann areas 1, 2, 3, 4 and 6. The areas 1,2 and 3 are also called primary somatosensory cortex which consists of the various sensory receptors that trigger the experiences labelled as touch or pressure, temperature (warm or cold), pain (including itch and tickle), and the sensations of muscle movement and joint position including posture, movement, and facial expression (collectively also called proprioception) [42]. Areas 4 and 6 are primary motor cortex and pre-motor cortex which plan and execute movements [63-64]. In this study, the subject needs to respond to lane deviation by steering the wheel. Therefore, the muscle movement and joint position including posture were sensed by somatosensory cortex. Whereas the action of steering wheel were planned and executed by pre-motor cortex and primary motor cortex.
The FCM cluster located near Brodmann areas 9 and 46 that play a role in sustaining attention and working memory [65]. In our study, the subject needs to keep attention on the lane-keeping driving task. Therefore, the attentional network unavoidably involved in the task.
5.3 The Fluctuations of EEG Alpha and Theta Power for Detecting Driver’s
Drowsiness
In previous studies that suggested the use of EEG signals is potentially the best for detecting vigilance while driving. [66-68] In the present study, we compared the EEG between different component clusters diversity of EEG power changes with respect to the transition from alertness to drowsiness and found that alpha power of BLO and OM component were most stable and desirable EEG feature for very-slight drowsiness detection. Additionally, the alpha and theta power of BLO and OM component were most stable and desirable EEG feature for slight drowsiness detection. Lastly, the theta power of BLO and
OM component were most stable and desirable EEG feature for extreme drowsiness detection. As the characteristic of drowsiness related EEG activity described above, if a person is very-slight drowsiness, the alpha wave will tend to be superior in EEG activity, and its power will increase time after time in occipital lobe, remarkably. After that, if the person tends to fall slight drowsiness, the power of alpha and theta will increase time after time in occipital lobe, remarkably. After that, if the person tends to fall extreme drowsiness, the power of alpha will decrease while the theta will still increase time after time in occipital lobe. With these results, we can quantify the driver’s consciousness level based on their EEG activity in the frequency domain of occipital lobe. Additionally, we also can develop an alarm system for motor vehicle crash prevention.
Chapter 6. Conclusions
In this study, we investigated the continuous EEG fluctuations from alertness to drowsiness in a realistic VR driving environment. Several component clusters exhibited monotonic alpha-band (8-12 Hz) power increase during the transition from alertness to very-slight and slight drowsiness, but remain constant or slight decrease during the extreme drowsiness period. On the other hand, the theta-band (4-7 Hz) power for each component cluster increased monotonically during the transition from slight to extreme drowsiness. Hence, these controversial results may be in part caused by the different drowsiness levels of volunteers. Additionally, drowsy related alpha and theta rhythm in these component clusters maybe modulated by the same nucleus. Lastly, we compared the EEG between different component clusters diversity of EEG power changes with respect to the transition from alertness to drowsiness and found that alpha power of BLO and OM component were most stable and desirable EEG feature for very-slight and slight drowsiness detection. The theta power of BLO and OM component were the most stable and desirable EEG feature for slight and extreme drowsiness detection.
References
1. K. A. Brookhuis, D. D. Waard, and S. H. Fairclough, “Criteria for driver mpairment,”
Ergonomics, Vol 46, 433-445, 2003.
2. URL: http://www.sleepfoundation.org/. 3. URL: http://en.wikipedia.org/wiki/drowsiness.
4. J. A. Hobson, “Sleep is of the brain, by the brain and for the brain,” Nature, Vol 437, 1254-1256, 2005.
5. C. B. Saper, T. E. Scammell, and J. Lu, “Hypothalamic regulation of sleep and circadian rhythms,” Nature, Vol 437, 1257-1263, 2005.
6. E. D. Adrian, “The basis of sensation,” The Quarterly Review of Biology, Vol 39, 416, 1928.
7. N. D. Volkow, B. Rosen, and L. Farde, “Imaging the living human brain: Magnetic resonance imaging and positron emission tomography,” Proceedings of the National
Academy of Sciences, Vol 94, 2787-2788, 1997.
8. A. Parry, and P. M. Matthews, “Functional magnetic resonance imaging (fMRI): A ‘window’ into the brain,” Centre for Functional Magnetic Resonance Imaging of the Brain- Department of Clinical Neurology-University of Oxford, The John Radcliffe Hospital 2002.
9. P. Parikh, and M. E. Tzanakou, “Detecting drowsiness while driving using wavelet transform,” Bioengineering Conference: Proceedings of the IEEE 30th Annual Northeast, 17-18, 2004.
10. M. A. Schier, “Changes in EEG alpha power during simulated driving: a demonstration,”
International Journal of Psychophysiology, Vol 37, 155-162, 2000.
11. S. Makeig and T. P. Jung, “Tonic, Phasic, and Transient EEG Correlates of Auditory Awareness in Drowsiness”, Cognitive Brain Research, Vol 4, 15-25, 1996.
12. S. Makeig and M. Inlow, “Lapse in alertness: coherence of fluctuations in performance and EEG spectrum,” Electroencephalogram and Clinical Neurophysiology, Vol 86, 23-35, 1993.
13. T. P. Jung, S. Makeig, M. Stensom, and T. J. Sejnowski, “Estimating alertness from the EEG power spectrum”, IEEE Transactions on Biomedical Engineering, Vol 44, 60-69 1997.
14 S. Makeig, T. P. Jung, and T. J. Sejnowski, “Awareness during Drowsiness: Dynamics and Electrophysiological Correlates,” Canadian Journal of Experimental Psychology, Vol 54, 266-273, 2000.
15. K. L. Lal and A. Craig, “Driver fatigue: Electroencephalography and psychological assessment,” Psychophysiology, Vol 39, 313-321, 2002.
16. A. Campagne, T. Pebayle, and A. Muzet, “Correlation between driving errors and vigilance level: influence of the driver’s age,” Physiology & Behavior, Vol 80, 515– 524, 2004.
17 J. Beatty, A. Greenberg, W. P. Deibler, and J. O. Hanlon, “Operant control of occipital theta rhythm affects performance, in a radar monitoring task,” Science, Vol 183, 871-873, 1974.
18. C. T. Lin, R. C. Wu, S. F. Liang, W. H. Chao, Y. J. Chen, and T. P. Jung, “EEG-based drowsiness estimation for safety driving using independent component analysis,” Circuits
and Systems I: Fundamental Theory and Applications, Vol 52, 2726- 2738, 2005.
19. S. F. Liang, C. T. Lin, R. C Wu, Y. C. Chen, T. Y. Huang, and T. P. Jung, “Monitoring Driver's Alertness Based on the Driving Performance Estimation and the EEG Power Spectrum Analysis,” 27th Annual International Conference of the Engineering in
Medicine and Biology Society, 5738-5741, 2005
20 C. T. Lin, S. F. Liang, Y. C. Chen, L. W. Ko, “Driver's drowsiness estimation by combining EEG signal analysis and ICA-based fuzzy neural networks,” IEEE International
Symposium on Circuits and Systems, 2125-2128, 2006.
21 F. Sharbrough, G. E. Chatrian, R. P. Lesser, H. Lüders, M. Nuwer, and T. W. Picton, “American Electroencephalographic Society Guidelines for Standard Electrode Position Nomenclature,” Journal of Clinical Neurophysiology, Vol 8, 200-202, 1991.
22 J. Malmivuo, and R. Plonsey, Bioelectromagnetism: Principles and applications of bioelectric and bio-magnetic Fields, Oxford University Press, New York, 1995.
23 D. Benton and P. Y. Parker, “Breakfast, blood glucose, and cognition,” The American
Journal of Clinical Nutrition, Vol 67, 772S-778S, 1998.
24 J. Hendrix, “Fatal crash rates for tractor-trailers by time of day,” Proceedings of the
International Truck and Bus Safety Research and Policy Symposium, 237-250, 2002.
25 H. Ueno, M. Kaneda, and M. Tsukino, “Development of drowsiness detection system,”
Proceedings of the Vehicle Navigation and Information Systems Conference, Vol 31,
15–20, 1994.
26 D. E. Johnson, “Applied multivariate methods for data analysis,” Cole publishing company, California, 1998.
27 C. Jutten, and C. Herault, “Blind separation of sources I. An adaptive algorithm based on neuromimetic architecture,” Signal Process, Vol 24, 1-10, 1991.
28 P. Comon, “Independent component analysis -- A new concept,” Signal Processing, Vol. 36, 287–314, 1994.
29 M. Girolami, “An alternative perspective on adaptive independent component analysis,”
Neural Computation, Vol 10, 2103–2114, 1998.
30 T. W. Lee, M. Girolami, and T. J. Sejnowski, “Independent component analysis using an extended infomax algorithm for mixed sub- and super-Gaussian sources,” Neural
Computation, Vol 11, 606-633, 1999.
31 T. P. Jung, C. Humphries, T. W. Lee, S. Makeig, M. J. McKeown, V. Iragui, and T. J. Sejnowski, “Extended ICA removes artifacts from electroencephalographic recordings,”
Advances in Neural Information Processing Systems, Vol 10, 894-900, 1998.
32 T. P. Jung, S. Makeig, C. Humphries, T. W. Lee, M. J. McKeown, V. Iragui, and T. J. Sejnowski, “Removing electroencephalographic artifacts by blind source separation,” Sychophysiology, Vol 37, 163-78. 2000.
33 T. P. Jung, S. Makeig, W. Westerfield, J. Townsend, E. Courchesne, and T. J. Sejnowski, “Analysis and visualization of single-trial event-related potentials,” Human Brain
Mapping, Vol 14, 166-85. 2001.
34 A. Yamazaki, T. Tajima, and K. Matsuoka, “Convolutive independent component analysis of EEG data,” Annual Conference on the Society of Instrument and Control Engineering, Vol 2, 1227-1231.2003.
35 A. Meyer-Base, D. Auer, and A. Wismueller, “Topographic independent component analysis for fMRI signal detection,” Proceedings of the International Joint Conference on
Neural Networks, Vol 1, 601-605, 2005.
36 M. Naganawa, Y. Kimura, K. Ishii, K. Oda, K. Ishiwata, and A. Matani, “ Extraction of a plasma time-activity curve from dynamic brain pet images based on independent component analysis,” IEEE Transactions on Biomedical Engineering, Vol 52, 201–210, 2005.
37 R. Liao, J. L. Krolik, and M. J. McKeown, “An information-theoretic criterion for intrasubject alignment of FMRI time series: motion corrected independent component analysis,” IEEE Transactions on Medical Imaging, Vol 24, 29-44, 2005.
38 A. J. Bell, and T. J. Sejnowski, “An information-maximization approach to blind separation and blind deconvolution,” Neural Computation, Vol 7, 1129–1159, 1995.
39 T. P. Jung, S. Makeig, M. Westerfield, J. Townsend, E. Courchesne, and T. J. Sejnowski, “Removal of eye activity artifacts from visual event-related potentials in normal and clinical subjects,” Clinical Neurophysiology, 1745-1758, 2000.
Sejnowski, “Removing electroencephalographic artifacts by blind source separation”
Psychophysiology, Vol 37, 163-178, 2000.
41 J. Onton, M. Westerfield, J. Townsend, and S. Makeig, “Imaging human EEG dynamics using independent component analysis,” Neuroscience and Biobehavioral Reviews, Vol 30, 808–822, 2006.
42 M. F. Bear, B. W. Connors, and M. A. Paradiso, “Neuroscience: Exploring the brain” Lippincott Williams and Wilkins, 2001.
43 L. D. Gennaro, M. Ferrara and, M. Bertini, “The Boundary between wakefulness and sleep: quantitative electroencephalographic changes during the sleep onset period,”
Neuroscience, Vol 107, 1-11, 2001.
44 S. Makeig, T. P. Jung, and T. J. Sejnowski, “Awareness during drowsiness: dynamics and electrophysiological correlates,” Canadian Journal of Experimental Psychology, Vol 54, 266-273, 2000.
45 URL: http://en.wikipedia.org/wiki/K-means_algorithm.
46. R. Conradta, U. Brandenburga, T. Penzela, J. Hasanb, A. VaÈrric, and J. H. Peter, “Vigilance transitions in reaction time test: a method of describing the state of alertness more objectively,” Clinical Neurophysiology, Vol 110, 1499-1509, 1999.
47 Y. Harrison, J. A. Horne, “Occurrence of microsleeps during daytime sleep onset in normal subjects,” Electroencephalogram Clinical Neurophysiology, Vol 98, 411–416. 1996.
48 M. L. Thomas, H. C. Sing, G. Belenky, H. H. Holcomb, H. S. Mayberg, R. F. Dannals, H. N. Wagner, D. R. Thorne , K. A. Popp, L. M. Rowland, A. B. Welsh, S. M. Balwinski and D.P. Redmond, “Neural basis of alertness and cognitive performance impairments during sleepiness II. Effects of 48 and 72 h of sleep deprivation on waking human regional brain activity,” Thalamus & Related Systems, Vol 2, 199-229, 2003.
rhythm,” Brain Imaging, Vol 13, 2487-2492, 2002.
50 G. Pfurtscheller, A. Stancak, and C. H. Neuper, “Event-related synchronization (ERS) in the alpha band-an electrophysiological correlate of cortical idling: A review,”
International Journal of Psychophysiology, Vol 24, 39-46, 1996.
51 J. L. Cantero, M. Atienza, and R. M. Salas “Human alpha oscillations in wakefulness, drowsiness period, and REM sleep: different electroencephalographic phenomena within the alpha band,” Neurophysiology Clinical, Vol 32, 54-71, 2002.
52 F. H. Lopes, V. Lierop, C. F. Schrijer, and W. S. V. Leeuwen, “Organization of thalamic and cortical alpha rhythms: spectra and coherences,” Electroencephalography Clinical
Neurophysiology, Vol 35, 627-39, 1973.
53 F. H. Lopes, J. E. Vos, J. Mooibroek, and A. V. Rotterdam, “Relative contributions of the intracortical and thalamo-cortical processes in the generation of alpha rhythms, revealed by partial coherence analysis,” Electroencephalogram Clinical Neurophysiology, Vol 50 449-56, 1980.
54 M. Steriade, “Sleep oscillations and their blockage by activating systems,” Journal of
Psychiatry and Neuroscience, Vol 19, 54-58, 1994.
55 J. L. Cantero, M. Atienza, R. Stickgold, M. J. Kahana, J. R. Madsen and B. Kocsis, “Sleep-Dependent theta Oscillations in the Human Hippocampus and Neocortex,” The
Journal of Neuroscience, Vol 26, 10897-10903, 2003.
56 T. D. Albright, “Direction and orientation selectivity of neurons in visual area MT of the macaque,” Journal of Neurophysiology, Vol 52, 1106-1130, 1984.
57 G. A. Orban, H. Kennedy and J. Bullier, “Velocity sensitivity and direction selectivity of neurons in areas V1 and V2 of the monkey: influence of eccentricity,” Journal of
Neurophysiology, Vol 56, 462-480, 1986.
58 M. L. Posner, “The attention system of the human brain,” Annual Review of Neuroscience, Vol 13, 25-42, 1990.
59 S. Corchs, and G. Deco, “Feature-based attention in human visual cortex: simulation of fMRI data,” NeuroImage, Vol 21, 36–45, 2004.
60 O. J. Braddick, and J. O'Brian, “Brain areas sensitive to visual motion,” Perception, Vol 30, 61-72, 2001.
61 M. Leonardo, J. Fieldman, N. Sadato, G. Campbell, V. Ibañez, L. Cohen, M. P. Deiber, P. Jezzard, T. Pons, R. Turner, D. L. Bihan, and M. Hallett, “A functional magnetic resonance imaging study of cortical regions associated with motor task execution and motor ideation in humans,” Human Brain Mapping, Vol 3, 83 – 92, 2004.
62 D. Marianne, and B. Thomas, “Brain activation studies on visual-vestibular and ocular motor interaction,” Current Opinion in Neurology, Vol 13, 13-18, 2000.
63 C. A. Porro, M. P. Francescato, V. Cettolo, M. E. Diamond, P. Baraldi, C. Zuiani, M. Bazzocchi, and P. E. Prampero, “Primary Motor and Sensory Cortex Activation during Motor Performance and Motor Imagery: A Functional Magnetic Resonance Imaging Study,” The Journal of Neuroscience, Vol 16, 7688–7698, 1996.
64 H. J.Freund, “Premotor area and preparation of movement,” Review of Neuroscience, Vol 146, 543-7, 1990.
65 C. Buchel, O. Josephs, G. Rees, R. Turner, C. D. Frith and K. J. Friston, “The functional anatomy of attention to visual motion: A functional MRI stud,” Brain, Vol 121, 1281–1294, 1998.
66 L. Torsvall and T. Akerstedt, “Sleepness on the job: continuous measured EEG changes in train driver,” Electroencephalogram Clinical Neurophysiology, Vol 66, 502-511, 1987. 67 G. Keckluno and T. Akersteot, “Sleepness in long distance truck driving: an ambulatory
EEG study of night driving,” Ergonomics, Vol 36, 1007-1017, 1993.
68 H. J. Eoh, M. K. Chung and S. H. Kim,“Electroencephalographic study of drowsiness in simulated driving with sleep deprivation,” International Journal of Industrial Ergonomics, Vol 35, 307-320, 2005.