Chen-Tang Huang,° Peng-Heng Chang,b and un-Shown Shi&
ainstituteof Electro-Optical Engineering and 6lnstitute of Materials Science and Engineering, National Chiao Tung University, Hsinchu, Taiwan
ABSTRACT
The deposition rate of Si03 by liquid-phase deposition (LPD) in a H2SiF6 solution is significantly increased by 254 nm ultraviolet (UV) illumination. The photoenhancement effect is much stronger at 3.09 M H2SiF6 than at 1.34 M H9SiF6 concentration. At a constant boric acid concentration the deposition rate of Si03 is found to increase linearly with UV light intensity. The photoassisted effect is much stronger at higher boric acid concentration. However, within the TJV intensityrange studied, the photoeffect on the oxide growth rate is not as strong as other parameters such as H3SiF6 con-centration and boric acid addition. The UV spectrophotometric results show that the strong UV absorption of the growth solution is associated with SiFt but not with H30, H3B03, or BF species in the solution. The observed photoenhance-ment effect is discussed in the light of the existing LPD models.
The growth of Si03 films by liquid-phase deposition has received increased attention recently because of its advan-tages of low temperature processing, reduced capital cost, high throughput, and excellent selectivity over the
tradi-tional techniques such as chemical vapor deposition
(CVD), radio frequency (RF) reactive sputtering, E-gun deposition, thermal oxidation, etc.' The growth of liquid-phase deposited 5i03 (LPD-5i03) is typically conducted in a supersaturated hydrofluosilicic acid (H3SiF6) solution at a temperature between 25 and 50°C.2-14 A simplified
mechanism of LPD growth was originally proposed by Nagayama et al.2 based on the reaction of H7SiF6 with
water to form hydrofluoric acid and solid 5i02
H2SiF6 +2H30 Si02 +6HF [1]
This model has been fairly successful in explaining the
increased supersaturation and hence the increased deposi-tion of 5i03 by the addideposi-tion of boric acid (H3B03), 2,3 or aluminum,4 or water5 to the growth solution. In the first two cases, either boric acid or aluminum would react with
HF to form BF 15 or A1F3,16 respectively. These reactions consume hydrofluoric acid in the growth solution thus pro-moting reaction 1 to the right according to Le Chatelier's principle so that more Si03 is formed. According to
reac-tion 1 the addireac-tion of water to the growth solureac-tion also
drives the reaction to the right favoring the Si03
deposi-tion, and this fact has been utilized by several groups in
LPD growth.58 Although evidence supporting this
simpli-fied model has been reported by Raman spectroscopy
data,9 it cannot explain the selective deposition of LPD-5i03 and the incorporation of fluorine atoms in the grown films as reported by many investigators.4'6'8'2 For example, LPD-5i03 film deposition has been reported to occur on the surface of thermal-Si03, CVD-5i03, and native oxide on silicon or polysilicon but not on the surface of photore-sist, sputtered-tungsten, or bared silicon.'3'14 Two sophisti-cated models have recently been advanced to explain the selective deposition and the fluorine incorporation.6'3 The common features of these models are the necessity of Si-OH bonds on the substrate surface and the formation of intermediate species in the growth solution.6"3 The deposi-tion of LPD-Si03 is brought about by the reacdeposi-tion of the intermediate species with Si-OH bonds on the substrate surface. Two different intermediate species, SiF,,JOH)4_m (in c 4) 1351 and [SiF6 . SiFJ2, 6,18 have been suggested. Although the correctness of these models remains to be
proved, recent report of Chou and Lee6 on the significant
difference (about ten times) in deposition rate for two growth solutions with the same H2SiF6 concentration (2 M) but prepared by two different routes does support the
notion of the existence of active intermediate species in LPD reaction. Since exactly the same growth conditions
were employed for the two growth solutions in their
growth runs, the observed variation was attributed to the difference in the concentration of the intermediate species resulting from the different processes.
One of the major disadvantages of LPD is the low depo-sition rate which limits its use.'4 It is, therefore, very desir-able to develop a technique which can increase the deposi-tion rate of LPD-Si03. It is well known that many reacdeposi-tions can be enhanced by means of UV light illumination. Examples can be found in photoCVD19'2° and photoassisted sol-gel processing.2' The common aspect of these processes is that the reacting molecules absorb ultraviolet spectra of a light source and are activated so that the chemical reac-tion is greatly enhanced. Generally the light source used in photoassisted processes can be laser, deuterium lamp, or mercury lamp, depending on the liv absorption spectra of the reacting molecules. In this paper, we propose a new photoassisted liquid-phase deposition (photoLPD) method. The results confirm that UV irradiation has a small but sig-nificant effect on the rate of LPD-Si03.
Experimental
The substrates used in this experiment were n-type (100) Si wafers. The native oxides on the Si wafers were not removed to ensure the growth of LPD-Si03. After ultrason-ically cleaning in acetone twice for 20 mm and rinsing in DI water for 10 mm, they were immersed into the growth solution with stirring for Si03 deposition. The starting solu-tion is a commercial (Riedel-de Haen, Germany) 34 weight percent (w/o) hydrofluosilicic acid (H3SiF6) solution from
which saturated growth solutions with two different
H2SiF6 concentrations, 3.09 and 1.34 M, were prepared. Excess silicic acid powders (Si03 .xH2O)were added to the solutions and thoroughly mixed by stirring for 6 h to ensure saturation at 2 5°C. After saturation, the undissolved silicic acid powders were filtered out using a 0.2 p.m Teflon filter. Oxidized Si dummy samples were used to check the saturation level of the filtered H2SiF6 solutions; by immers-ing them into the solutions at 25°C for 4 days, we measured the oxide thickness and found no difference before and
after immersion. This shows that the filtered H2SiF6 solu-tions was indeed saturated. Before immersing the substrates for deposition, various quantities of boric acid (0.1 1k?) and Dl water were added all at one time to the solution so that the concentration of boric acid in the growth solution was varied from 0 to 0.0177 M. The volume of the growth solu-tion was kept constant at 90 ml for each growth run. The supersaturated solutions were stirred for 1 h in a constant temperature water bath at 40°C to ensure that boric acid
had completely reacted with hydrofluoric acid and that
solution temperature had been stabilized. The growth runs
were conducted in the dark either with or without IJV illumination with the solution always in circulation by
stirring. For photoLPD-Si02 deposition, mercury lamps of 254 nm wavelength were used to illuminate the
solu-tion from the top at a distance of 4 cm. Two different
light intensities, 4.6 and 9.6 mW/cm3, were used. The UV
intensity was measured by a radiometer at a distance of
4 cm. The growth solution was constantly stirred during growth in a constant temperature bath. The temperature 2044 J Electrochem. Soc., Vol. 143, No. 6, June 1996 The Electrochemical Society, Inc.
fluctuation due to UV light illumination was monitored
and found to be less than 0.8°C. Generally, fresh growth solution was used for each growth run of one specimen at a time. The total deposition time for each run was varied from 2 to 6 h depending on the deposition rate so that a
total oxide thickness of at least several hundred angstrom
can be formed for subsequent measurement. The
thick-nesses and refractive indexes of the deposited films were measured by ellipsometry. The effective growth rate was calculated by dividing the total oxide thickness by the total deposition time. The UV transmission spectra of solutions were measured on a UV spectrophotometer (Model DU-7400, Beckman Co., USA) using standard low absorption quartz cell with an optical path length of 1 cm.
Resultsand Dscussion
Figure1 shows the variation of the oxide film thickness as a function of deposition time. The boric acid addition was kept constant at 0.0 13 M for the three cases but 3.09 M H2SiF6 solutions were used for cases A and B while 1.34 M H2SiF6 solution was used for case C. Cases B and C were conventional LPD runs in the dark without UV tion while case A was a photoLPD run with UV illumina-tion at an intensity level of 9.6 mW/cm2. The thicknesses of the Si02 films in all cases depend linearly on deposition time indicating constant deposition rates of 69, 54, and 17 nm/h for curves A, B, and C, respectively. Clearly a higher H2SiF6 concentration results in a higher deposition rate and UV illumination further enhances the deposition rate.
Intuitively one would not expect the deposition rate to
remain constant indefinitely because the supersaturation
decreases as more and more Si02 is removed from the
growth solution. However, it is reasonable to claim, based on Fig. 1, that a constant deposition rate was maintained throughout each of the growth runs which were typically limited to within 6 h.
Figures 2 and 3 show the combined effect of boric acid addition and UV illumination on the deposition rate of Si02 for 1.34 M H2SiF6 and 3.09 M H2S1F6 growth solutions, respectively. The deposition rate increases roughly quadrat-ically with boric acid concentration, a result consistent with other investigators7 and has been successfully explained by Nagayama's model2 that boric acid reacts with HF to form BF thus reducing the HF concentration in the growth
solu-tion. This would drive reaction 1 to the right leading to increased Si02 deposition. The deposition rate is also
enhanced by UV illumination in both figures although it is
E .E. 300 — Cl) 0) a) .s 200 — I—
Fig. 2. The effect of boric acid concentration on the deposition
rate of Si02 at three different UV intensity levels. The H2SiF4
con-centration of the growth solution is 1.34 M and the growth
temper-ature is 40°C.
evidentby comparing Fig. 2 and 3 that UV illumination has a more prominent effect on the deposition rate of the 3.09 M H2SiF6 solution than that of the 1.34 M H2SiF6 solution. Figures 4 and 5 show the dependence of deposition rate as a function of UV intensity at various boric addition levels for the 1.34 and 3.09 M solutions, respectively. At a constant boric acid concentration the effect of UV intensity on depo-sition is found to be linear within the intensity range stud-ied. The photochemical effect appears to be dependent on the boric acid concentration. This is clearly revealed by the increased slope with increasing boric acid concentration as shown in Fig. 4 and 5.
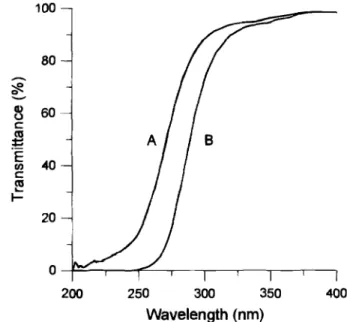
The growth solutions used in the present study are found to absorb UV light strongly. Figure 6 shows the UV trans-mission spectra of two growth solutions with the composi-tions of 20 ml 1.34 M H2SiF6 +3mIt 0.1 M H3B03 (curve A)
a) (5 C •0 C,)
0
0. a)a
UV intensity (mW/cm2) 9.6 4.6 0 90 8070
E 60p0
0 40
-30
20 10 0 0.0 0.5 1.0 1.5 2.0Boric acid concentration (mol/l) x102
500 -400 - A 100 — UV intensity (mW/cm2) 9.6 4.6 0 35 30 25 20 15 10 5 0 0 60 120 180 I
'1
240 300 360 Deposition time (mm)Fig. 1. Dependence of deposition rate of Si02 on deposition time. Curve A: 3.09 M H2SiF6 with 9.6 mW/cm2 UV illumination; curve B: 3.09 M H2S1F6 without (JV illumination; and curve C: 1.34 M H2SiF6
without UV illumination.
0.6 0.8 1.0 1.2 1.4 1.6
1.8 2.0 2.2
Boric acid concentration (mol/l) x102
Fig. 3. The effect of boric acid concentration on the deposition
rate of Si02 at three different UV intensity levels. The H2SiF6
con-centration of the growth solution is 3.09 M and the growth
B 200 250 300 350 35 -(H3B03] slope 30 - (mol/I)x102 25 - ____________________... 1.78 0.43
. 20-
0.27.2
15-1.33 0.21 10 —__
1.11 0.20 0.89 0.17 0.67 0.16 0 2 4 6 8 10 12 14 UV light intensity (mW/cm2)Fig. 4. The effect of IN intensity on the deposition rote of S°2 at
different boric acid concentrations. The H2SiF6 concentration of the
growth solution is 1.34 M and the growth temperature is 40°C.
and20 ml 3.09 M H2SiF6 +3ml 0.1 M EIBO3(curveB), measured by using a standard UV quartz cell of 1 cm
opti-cal path length. It indicates that UV light with a
wave-length shorter than about 300 nm is strongly absorbed by the solutions supersaturated with Si02. It is also evident in Fig. 6 that the higher the H2SiF6 concentration the greater the UV absorption.
There are four major chemical species, I2O,H3B03,
BF,
and SiFt, in a growth solution according to Nagayama's LPD model.2 To identify the species responsible for the UV absorption, the UV transmission spectra of pure H20, pure H3B03 solution (0.1 M), and pure H2SiF6 solutions (1.34 and 3.09 M) were measured under the same conditions as those employed for Fig. 6. Figure 7 shows the tJV trans-mission spectra of pure H20 and pure H3B03. It should be pointed out that curve B only shows the net effect of boric acid absorption because the contribution of H20 (namely,
90— [H3B03] slope 80 — (mol/i)x102
70-
Ec
60-a)50-
0
40-
3020 -10 — 0 2 4 6 8 10 12 14 UV light intensity (mW/cm2)Fig. 5. The effect of liv intensity on the deposition rate of S02 at
different boric acid concentrations. The H2SiF6 concentration of the
growth solution is 3.09 M and the growth temperature is 40°C.
100 80 0 0 60 C E U) 40
c
(U I-I— 20 0 400 Wavelength (nm)Fig. 6. liv transmission spectra of two growth solutions. Curve A: 20 ml H2SiF6 (1.34 M) + 3 ml H3B03 (0.1 /4. Curve B: 20 ml H2SiF6
(3.09/4 + 3 ml H3803 (0.1 /pl).
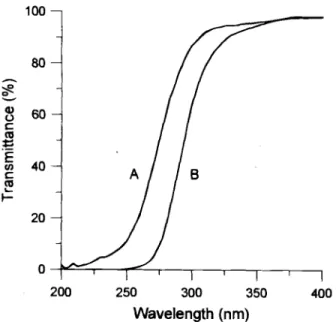
curveA) has been subtracted out. Curve A in this figure shows clearly that, except for the small (<5%) absorption between 400 to 500 nm, H20 is practically not absorbing UV light from 200 to 700 nm. Similarly, the transmittance of H3B03 is typically greater than 90% from 200 to 700 nm as revealed by curve B. These results imply that the T.JV absorption observed in the growth solutions is not caused by H20 or H3B03. The transmission spectra of pure 1.34 and 3.09 M H2SiF6 solutions (with the absorption of H20
subtracted out) are shown in Fig. 8 as curve A and B, respectively. It shows that H2SiF6 solutions strongly
absorb UV light. Note that the UV transmission spectra of the pure H2SiF6 solutions shown in Fig. 8 are very similar to those of the growth solutions shown in Fig. 6. By way of subtraction the absorption effect of BF4 must be negligibly small. From the forgoing discussion, we may conclude that the tJV absorption observed in Fig. 6 is definitely related to SiFt species in the growth solutions. Much remains to
be done to clarify the mechanism of the photochenucal
effect in the LPD process. In the light of the existing LPD
0---—t
-
i 1200 300 400 500 600 700
Wavelength (nm)
Fig. 7. UV transmission spectra of H20 (curve A) and 0.1 M
H3803 (curve B). 1.77 2.66 100-1.41 2.57 80 — 2.14 1.06 0.71
60-U) C.) C (U E 0) C CU I-1.36 0.35 0 40-0.79 0.57 20-Wavelength (nm)
Fig. 8. UV transmission spectra of 1.34 M (curve A) and 3.09 M
(curve B) H2SiF6 solutions.
model,the strong absorbing ability of SiF species prob-ably results in a significant increase in the concentration
of the important intermediate species SFm(OH)4_m
(m < 4)1317leadingto the observed increase in the deposi-tion rate.
Figure 9 shows the refractive index of all the films grown in the present study. The data in this figure are
divided into two groups. The open symbols are for films grown in 3.09 M H2SiF8 solutions while the closed symbols are for films grown in 1.34 M H2SiF, solutions. Three
observations can be made from this figure: (i) except for one outlier (arrowed point in Fig. 9), the refractive index is generally decreased slightly with increasing boric acid concentration in both groups; (ii) films formed in 1.34 M H3SiF6 solutions have slightly higher refractive index than
those formed in 3.09 M H2SiF6 solutions; and (iii) UV intensity has a small effect on refractive index but the
effect does not seem to follow any particular trend.
It has been shown previously in Fig. 2 and 4 that at a
constant H2SiF6 concentration the film is deposited at a higher rate at higher boric acid concentration. Also, Si02 film is grown at a faster rate in a 3.09 M H2SiF6 solution than in a 1.34 M H2S1F6 solution. Therefore, the first two
observations are equivalent to that an LPD-Si02 film
grown at a higher rate has a lower refractive index. This observation has been reported previously by other investi-gators.3"4 Using etch rate as an indicator of film density (i.e., lower etch rate corresponding to higher density), Yeh et al.14 claimed that a film deposited at a lower rate has a
higher refractive index because of denser structure.
However, Kawahara et al.3 have pointed out the inconsis-tency of using etch rate as density indicator for LPD-Si02, and instead he was able to correlate the decrease of refrac-tive index of LPD-Si03 with increasing fluorine content
incorporated into the film. In the light of Kawahara's
result the second observation may be attributed to the dif-ference in fluorine content in the film. It is expected that boron may also be incorporated into the oxide film during LPD growth, but the extent of this incorporation and its effect on refractive index are yet to be determined. Within the UV intensity level investigated in the present study the effect of UV illumination on Si02 deposition rate is not as
big as that of the boric acid concentration as evidenced
in Fig. 2 and 4, therefore its effect on refractive index is less significant. The outlier in Fig. 9 is obtained from the
sample deposited at the highest rate, and the film
appears cloudy which may have affected its refractive
index measurement. 1.47 -
1.46-x
c
1.45-C.) 1.44-1) 0.0 0,5 1.0 1.5 2.0Boric acid concentration (molJl)xl 02
Fig. 9. Dependance of refractive index on boric acid
concentra-tion for Si02 films grown from two different concentraconcentra-tions of H2SiF6
solution under different liv illumination.
Conclusions
Thegrowth of Si02 by photoassisted liquid-phase depo-sition (photoLPD) in silica-saturated H2SiF6 solution was studied. PhotoLPD by 254 nm UV illumination enhances Si02 deposition rate over the conventional LPD process
and the photoenhancement becomes more prominent
when the H2S1F6 concentration of the growth solution is
increased from 1.34 to 3.09 M. At a constant boric acid
concentration the deposition rate of Si02 increases linear-ly with the UV light intensity and the higher the boric acid
concentration the stronger the UV intensity effect. The
deposition rate of Si02 increases with the boric acid con-centration with or without UV illumination. The observed
strong UV absorption of the growth solution is mainly
related to the SiF species but not to the H20, H3B03, or BF species in the solution. The increased Si02 deposition rate of photoLPD may be attributed to the increased con-centration of intermediate species due to the activation of SiF species by UV illumination. Within the UV intensity range studied, the photoeffect on the oxide growth rate is not as strong as other parameters such as H2SiF6 concen-tration and boric acid addition. However, since the growth
rate is linearly dependent on UV intensity, a dramatic
increase in growth rate may be expected with extremely high intensity UV source like excimer laser.
Acknowledgment
This
work was partially supported by the National
Science Council of Republic of China under the Contract No. NSC 84-0404-E-009-016.Manuscript submitted Aug. 28, 1995; revised manuscript received Dec. 18, 1995.
National Chiao Tung University assisted in meeting the publication costs of this article.
REFERENCES
1. W. A. Pliskin, J. Vac. Sci. Technol., 14,1064(1977). 2. H. Nagayama, H. Honda, and H. Kawahara, This
Journal, 135, 2013 (1988).
3. H. Kawahara, T. Goda, H. Nagayama, H. Honda, and
A. Hishinuma, in Proceedings of International
Congress on Optical Science and Engineering, Vol. 2, p. 1128 (1989).4. A. Hishinuma, T. Goda, M. Kitaoka, S. Hayashi, and H. Kawahara, Appl. Surf. Sci., 48 & 49, 405 (1991).
5. S. Yoshitomi, S. Toniioka, and N. Honeji, in
Proceedings of the 1992 International Electron Devices and Materials Symposium, p. 22, Taipei, Taiwan (1992). a, C.) C E Cl, C Co I-100 80 60 40 20 0 B
e
[HzSiF] UV intensity 3.09M 1.34M (mW/cm2)o •
0o U
4.6 A 9,6•1•
A..
U A 0 200 250 300 350 1.43-1.42 400 I I6. C. F. Yeh, C. L. Chen, and G. H. Lin, This Journal, 141, 3177 (1994).
7. J. S. Chou and S. C. Lee, Appl. Phys. Lett., 64, 1971 (1994).
8. J. S. Chou and S. C. Lee, This Journal, 41, 3214 (1994). 9. K. Awazu, H. Kawazoe, and K. Seki, J. Non-Cryst.
Solids, 151, 102 (1992).
10. T. Homma, T. Katoh, Y. Yamada, J. Shimizu, and Y. Murao, in Proceedings of IEEE/JSAP Symposium on. VLSI Technology, p. 3, IEEE (1990).
11. T. Homma, T. Katoh, Y. Yamada, J. Shimizu, and Y. Murao, NEC Res. Develop., 32, 315 (1991).
12. C. F Yeh, S. S. Lin, C. L. Chen, and Y. C. Yang, IEEE Elecron. Device Lett., EDL-14, 403 (1993).
13. T. Homma, T. Katoh, Y. Yamada, and Y Murao, This Journal, 140, 2410 (1993).
14. C. F Yeh and C. L. Chen, Semicond. Sci. Technol., 9, 1250 (1994).
15. D. Sxarpiello and W. Cooper, J. Chem. Eng. Data, 9, 364 (1964).
16. W. L. Jolly, Modern Inorganic Chemistry, p. 280, McGraw-Hill, Inc., New York (1984).
17. E. M. Rabinovich and D. L. Wood, Mater. Res. Soc. Symp., 73, 251 (1986).
18. S. Deki, in Proceedings of 56th Spring Meeting, Jpn. Electrochem. Soc., p. 18 (1989).
19. H. Nonaka, K. Arai, Y. Fujino, and S. Ichimura, J. Appl. Phys., 64, 4168 (1988).
20. W. H. Lan, S. L. Th, S. J. Yang, and K. F. Huang, Jpn. J. Appl. Phys., 29, 997 (1990).
21. T. Ohishi, S. Maekawa, and A. Kaloh, J. Non-Cryst. Solids, 147 & 148, 493 (1992).
Electrochemically Reduced Polycrystalline Tin Oxide Thin Films
Surface Analysis and Electroplated Copper Adhesion
H. Feng,a S. J. Laverly, P. Maguire, J. Molloy, and B. J. Meenan
Schoolof Electrical and Mechanical Engineering, University of Ulster Newtownabbey, County Antrim BT37 OQB, Northern Ireland
ABSTRACT
In previously reported work, a conductivity enhancement effect in polycrystalline tin oxide thin films, which are widely used for the front electrodes in flat panel displays, has been achieved by electroplating copper onto the 300 nm high sidewalls of the electrode. Recent experiments show that if an electrolytic reduction is introduced as a surface mod-ification process just before electroplating then excellent adhesion between copper and tin oxide can be achieved. In this paper, the chemical, physical and surface morphological changes of tin oxide electrodes have been characterized by using atomic force microscopy, x-ray diffraction, x-ray photoelectron spectroscopy, and surface sheet resistance measurements by a four-point probe method. The electrolytic reduction was found to result in an increase in the intensity of the x-ray
reflection from the (110) planes of tin oxide, and compositional nonuniformity of the tin oxide surface layers, where metallic tin is trapped at the surface, and oxygen is enriched in the subsurface region. These results, taken together, sug-gest that the observed adhesion improvement may be due to a combination of tin oxide surface roughening due to pref-erential etching and the increased (110) orientation, in situ cleaning, and chemical bonding introduced by surface chem-ical changes.
Introduction
Tin oxide (TO, Sn02) and indium tin oxide (ITO, InSnO2) are widely used materials for the front electrodes in flat panel displays including liquid crystal (LC), dc or ac elec-troluminescent (EL), and plasma displays (PD). Response
time, brightness, uniformity, and power consumption
depend critically on electrode line resistance, especially for large area displays. The conduction mechanism in tin oxide and indium tin oxide limits their intrinsic
conduc-tivity to approximately 2.5 X 10⁶ fl m'. ' To achieve
higher conductivity of the transparent electrodes, a
com-bined electrode scheme using a thin aluminum metal stripe in contact with indium tin oxide, thus forming a
hybrid electrode was proposed by Hope et al.2 Since then,
there have been several systems based on this idea.5'4 However, it is reported5 that the combination suffers
severe corrosion when the combined conductor is cleaned in weak alkaline solutions, thereby causing disconnection
and device failures. Furthermore, the contact resistance between aluminum and tin oxide or indium tin oxide is quite high; typically 80 1 for a contact area of 1.6 X 10 p.m. At temperatures above 200°C which may be
encountered in the fabrication of subsequent layers such as ZnS:Mn or during the device operation, the tin oxide or indium tin oxide is readily reduced by the aluminum via the formation of the more stable oxide, A1203. Compared to aluminum, copper is an attractive alternative because its
*ElectrochemicalSociety Active Member.
°Present address: Department of Solid State Electronics, Huazhong University of Science and Technology, Wuhan 430074, China.
bulk resistivity is lower than that of aluminum and copper
is also expected to be resistant to electromigration.5 In
addition, for the hybrid electrode of aluminum stripe and
tin oxide, the aluminum film was prepared by vacuum methods.24 By comparison, the copper electroplating
process is cheap, easy to operate, and especially suitable for large area display and industrial production.
In our previous work,6 a similar hybrid electrode was prepared by electroplating copper onto the sidewall of the tin oxide. By doing so, a one-order of magnitude improve-ment in electrode conductivity with minimal loss of trans-mission was obtained.5 However, copper is less adhesive to the commonly used substrate than aluminum because of its lower activity. This is a frequently encountered problem for physical and chemical copper deposition7 and the same problem was encountered in our experiments. In a wide
range of both solution concentration (from 250 g/liter
CuSO4 5H20 and 110 g/liter H2S04 to 160 g/liter CuSO4 5H20 and 75 g/liter H2S04) and electroplating current den-sity (from 5 to 100 mA/cm2), the deposited copper layers varied from powdery to dense; none of which had suffi-ciently good adhesion to the tin oxide thin film substrate.
However, it was shown that if surface modification by
electrolytic reduction was introduced just before electro-plating, excellent adhesion between copper and tin oxide could be achieved with a fixed concentration (0.1 M) of H2S04 acid and a reduction time of a few seconds to a few minutes at a current density between 5 to 25 mA/cm.2 In this earlier work adhesion was assessed qualitatively by
ultrasonic agitation, annealing to 150°C, rubbing, and
peel tests. More recent measurements using a Sebastian Five z-axis load application unit has identified a 100 kg/cm2