Pressure-induced metallization and resonant Raman scattering in Zn 1 x Mn x Te
Y. C. Lin, W. C. Fan, C. H. Chiu, F. K. Ke, S. L. Yang, D. S. Chuu, M. C. Lee, W. K. Chen, W. H. Chang, W. C. Chou, J. S. Hsu, and J. L. Shen
Citation: Journal of Applied Physics 104, 013503 (2008); doi: 10.1063/1.2949707
View online: http://dx.doi.org/10.1063/1.2949707
View Table of Contents: http://scitation.aip.org/content/aip/journal/jap/104/1?ver=pdfcov Published by the AIP Publishing
Articles you may be interested in
Magnetoresistive switching and highly polarized electroluminescence from semimagnetic semiconductor bicrystals Zn 1 x Mn x Te
Appl. Phys. Lett. 98, 112103 (2011); 10.1063/1.3567550
Raman spectra and room-temperature ferromagnetism of hydrogenated Zn 0.95 Mn 0.05 O nanopowders J. Appl. Phys. 105, 123902 (2009); 10.1063/1.3147867
Structural and vibrational analysis of nanocrystalline Ga 1 x Mn x N films deposited by reactive magnetron sputtering
J. Appl. Phys. 102, 063526 (2007); 10.1063/1.2783844
Raman spectroscopy study of Zn 1 x Mn x Se thin films under high-pressure J. Appl. Phys. 101, 103535 (2007); 10.1063/1.2735679
Local environment of a diluted element under high pressure: Zn 1 x Mn x O probed by fluorescence x-ray absorption spectroscopy
Appl. Phys. Lett. 89, 231904 (2006); 10.1063/1.2400109
Pressure-induced metallization and resonant Raman scattering
in Zn
1−xMn
xTe
Y. C. Lin,1W. C. Fan,1C. H. Chiu,1F. K. Ke,1S. L. Yang,1D. S. Chuu,1M. C. Lee,1 W. K. Chen,1W. H. Chang,1W. C. Chou,1,a兲J. S. Hsu,2and J. L. Shen2
1
Department of Electrophysics, National Chiao Tung University, Hsinchu 30010, Taiwan, Republic of China
2Department of Physics, Chung Yuan Christian University, Chung-Li 32023, Taiwan, Republic of China 共Received 5 March 2008; accepted 24 April 2008; published online 1 July 2008兲
Pressure-induced resonant Raman scattering is adopted to analyze the zone-center optical phonon modes and crystal characteristics of Zn1−xMnxTe 共0⬉x⬉0.26兲 thin films. The pressure 共Pt兲 at
which the semiconducting undergoes a transition to the metallic phase declines as a function of Mn concentration 共x兲 according to the formula Pt共x兲=15.7−25.4x+19.0x2 共GPa兲. Pressure-dependent longitudinal and transverse optical phonon frequencies and the calculated mode Grüneisen parameters were adopted to investigate the influence of Mn2+ions on the iconicity. The experimental results indicate that the manganese ions tend to increase the iconicity of ZnTe under ambient conditions, whereas an external hydrostatic pressure tends to reduce the iconicity and the bond length of Zn1−xMnxTe. © 2008 American Institute of Physics.关DOI:10.1063/1.2949707兴
I. INTRODUCTION
Dilute magnetic semiconductor 共DMS兲 Zn1−xMnxTe, in
which a fraction of Zn element is replaced by Mn atoms, crystallizes in the zincblende共ZB兲 structure for x⬉0.8 under ambient conditions.1 The magnetic properties of Zn1−xMnxTe-related materials are currently a focus of
re-search activities in numerous interesting investigations.2–6 Magnetic ordering in semiconductors can arise from the su-perexchange interaction or free-carrier-mediated exchange interaction between magnetic ions. Long-range ferromag-netic orderings, mediated by holes, were observed in Ga1−xMnxAs共Ref.7兲 and In1−xMnxAs,8in which manganese
ions act as acceptors. Alternatively, p-doped Zn1−xMnxTe, in
which magnetic ions are not dopants, exhibits ferromag-netism that is induced by the exchange interaction of free holes with the localized spins of Mn2+ions.3–6Moreover, our recent high pressure study of n-doped ZnSe:Cl demonstrated that the hydrostatic pressure tends to reduce the carrier con-centration, and that doping influences the metallic phase transition.9 Therefore, the effect of applied pressure on the physical properties of DMS Zn1−xMnxTe will be of interest
in future studies of the pressure-dependent magnetic proper-ties of this material.
Pressure-induced phase transitions of ZnTe bulk crystal have been widely studied.10–13So far, all of the evidence has shown that the application of pressure to a semiconducting ZnTe exhibits a unique transition sequence. As the pressure is increased, the semiconducting ZB ZnTe phase 共ZnTe I兲 first transforms to the other semiconducting cinnabar phase 共ZnTe II兲, and then undergoes a transition to a metallic ortho-rhombic 共Cmcm兲 phase 共ZnTe III兲. These high-pressure phase behaviors differ from those of most II-VI semiconductors,14–16which transform from ZB共or wurtzite兲
first to the cinnabar structure and then to the rock-salt共NaCl兲 structure as external pressure is applied. Even though the NaCl phase is unstable and has not been observed in ZnTe at room temperature under any pressure, it has been revealed to be stable only at high temperature.17This result is attributed to the fact that ZnTe is the lowest ionic semiconductor in the II-VI family.18 The transition pressure from nonmetallic ZnTe to metallic ZnTe III 共Cmcm兲 phase is controversial. Optical-absorption measurements yield a transition pressure of 11.9 GPa.10 The electrical resistance approach yields a transformation of 13–15 GPa.11The metallic phase of ZnTe, as revealed by Raman scattering, forms at above 14.2 GPa.12 Moreover, the crystalline structure of the ZnTe phase III is determined to be 16 GPa using angle-dispersive powder-diffraction techniques with synchrotron radiation.13 To re-solve these unusual and controversial phase transitions at high pressure, Raman scattering under high pressure was performed to investigate ZnTe and Zn1−xMnxTe thin films up
to 17.0 GPa. Furthermore, resonant Raman scattering共RRS兲 was adopted to enhance the Raman signal to identify more clearly the semiconductor-to-metal phase transition pressure. The crystalline stability, iconicity, and Grüneisen parameters 共␥i兲 of Zn1−xMnxTe共0⬉x⬉0.26兲 thin films were also
stud-ied.
II. EXPERIMENT
Zn1–xMnxTe samples with various Mn contents 共0⬉x
⬉0.26兲 were deposited at 300 °C by molecular beam epi-taxy on共001兲 oriented semi-insulating GaAs substrates. The samples’ thicknesses were fixed at about 0.7 m, and the Mn composition was determined by energy-dispersive x-ray analysis. Raman spectra under ambient pressure were all re-corded at 300 K and excited using the 514.5 nm line of an Ar+ laser, while the 488.0 nm line from the Ar+ laser was used in high-pressure experiments. High-pressure Raman measurements were all made at room temperature using a a兲Author to whom correspondence should be addressed. Electronic mail:
0021-8979/2008/104共1兲/013503/5/$23.00 104, 013503-1 © 2008 American Institute of Physics
ruby-calibrated diamond anvil cell 共DAC兲.9 A liquid methanol-ethanol 4:1 mixture was utilized as the pressure-transmitting medium, and the pressure gradient was less than 0.2 GPa throughout the sample chamber. Before loading the Zn1−xMnxTe crystal into the DAC, the GaAs substrate was
removed by mechanical polishing and chemical etching. Spectra were all obtained in backscattering configuration and analyzed by a SPEX 1404 double grating spectrometer equipped with a multichannel LN2-cooled charge coupled device. The high-pressure experiments are reproducible for each specimen. The photoluminescence 共PL兲 energies were obtained at 300 K, using the 488.0 nm line of an Ar+laser. III. RESULTS AND DISCUSSION
Figure 1 presents the zone-center Raman spectra of Zn1−xMnxTe共x=0.00, 0.09, 0.14, 0.22, and 0.26兲, measured
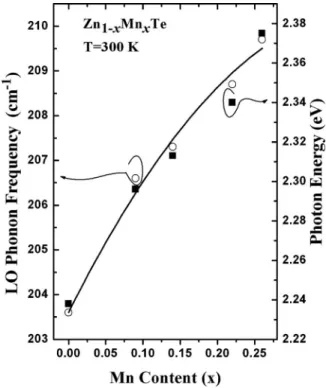
at room temperature and ambient pressure under z共x+y,x + y兲z¯ backscattering geometry. In this configuration, trans-verse optical 共TO兲 phonons are forbidden and longitudinal optical 共LO兲 phonons are allowed. As the Mn content in-creases, the 1LO and its overtone共2LO兲 phonon frequencies increase. Figure 2plots the dependence of the 1LO phonon frequency and the PL energy on the Mn concentration 共x兲. The increase in the LO phonon frequency with Mn content is due to the difference between atomic masses, mMn共55兲 ⬍mZn共65兲. As the Mn concentration increases, the PL energy is blueshifted and slowly approaches the incident laser en-ergy. When the energy of the electronic transition energy is sufficiently close to the incident laser energy, the RRS effect occurs, enhancing the intensity of LO phonons. Based on the RRS condition,
hlaser− mhLO共x,p兲 ⬇ Eexc共x,p兲, 共1兲 where hlaser is the photon energy of the incident laser.
Eexc共x,p兲 and hLO共x,p兲 are the electronic transition energy
and the LO phonon energy, respectively, as functions of Mn content共x兲 and applied pressure 共p兲. The m denotes the over-tone order of LO phonons. Under ambient conditions, when
the laser is fixed at 2.41 eV, the Raman scattering of the larger overtone phonon comes into resonance first 共Fig.1兲. As shown in Fig. 1, besides the LO mode, an impurity 共I兲 mode and its overtone共2I兲 at the lower-frequency side of the LO phonon in Zn1–xMnxTe 共x⬎0兲 are also visible. As the
Mn content increases, the impurity共I and 2I兲 modes shift to lower frequencies and become intense. Similar phenomena are also found in Zn1−xMnxSe 共Ref. 15兲 and Zn1−xCdxSe
共Ref.16兲 II-VI ternary compounds. Since the impurity mode discussed herein lies between the LO and TO modes and can also be apparently observed at high pressures, it can be iden-tified as the impurity mode of Mn in ZnTe. Accordingly, the zone-center optical phonon mode of Zn1–xMnxTe can be
cluded to exhibit mixed mode behavior. This finding is con-sistent with an earlier work.1
Figure3shows the up-stroke pressure-dependent Raman spectra of the ZnTe thin film at up to 17.0 GPa. The TO mode, which is not allowed under ambient conditions before pressurization, appears at high pressures. The emergence of the TO mode can be attributed to the pressure-induced RRS enhancement and the deviation of the sample chip from the perfect backscattering geometry in the DAC. The LO and TO phonons both shift to higher frequencies with increasing pressure, wherein the shift is accompanied by clear changes in their intensities. The reduction in the lattice constant and the crystal volume under external pressure increases the LO and TO phonon frequencies. The pressure-driven RRS effect, according to Eq. 共1兲, causes the intensity of the LO phonon to increase abruptly at first and then to decline smoothly. As the pressure increases, the LO phonon disappears and the sample becomes opaque at 15.7⫾0.2 GPa, indicating a semiconductor-to-metal phase transition.9,14–16This phenom-enon is distinct from that revealed by the Raman results of
FIG. 1. Raman spectra of Zn1−xMnxTe共0⬉x⬉0.26兲 at 300 K under
ambi-ent pressure. The excitation source is a 514.5 nm line from an Ar+laser.
FIG. 2. Dependence of LO phonon frequencies共open circle兲 and PL energy 共solid square兲 on Mn concentration 共x兲 at room temperature. The solid curve is a quadratic polynomial fit for the LO phonon.
013503-2 Lin et al. J. Appl. Phys. 104, 013503共2008兲
Camacho et al.,12 in which the LO phonon was invisible above 9.6 GPa—far below the critical pressure obtained un-der the RRS condition discussed herein. The metallic phase transition pressure of ZnTe, measured by the RRS experi-ment, is consistent with the experimental results of Nelmes
et al.13 who determined, using angle-dispersive diffraction techniques with synchrotron radiation source, which crystal structure changed to the ZnTe phase III at 16 GPa. Recently, Shchennikov et al.11 revealed that the sharp drop in resis-tance from 106 to 101 ⍀ in ZnTe at about 13.0–15.0 GPa is related to the transformation into the orthorhombic Cmcm phase. The difference between the phase transition pressures obtained by x-ray and electrical resistance methods is attrib-utable to the fact that x-ray techniques determine the phase transition pressure closer to the completion of the transfor-mation, whereas the electrical resistance measurements re-veal the beginning of the transition.11In Fig.3, the TO mode does not disappear until at about 17.0 GPa. Other II-VI com-pounds exhibited a similar phenomenon because transverse surface lattice vibration is allowed in both semiconductor and metal, even though the skin depth共or penetration depth兲 of the metal for a laser is only several tens of angstroms.9,14–16 In the down-stroke high-pressure process, only hysteresis is observed and no additional phonon ap-pears.
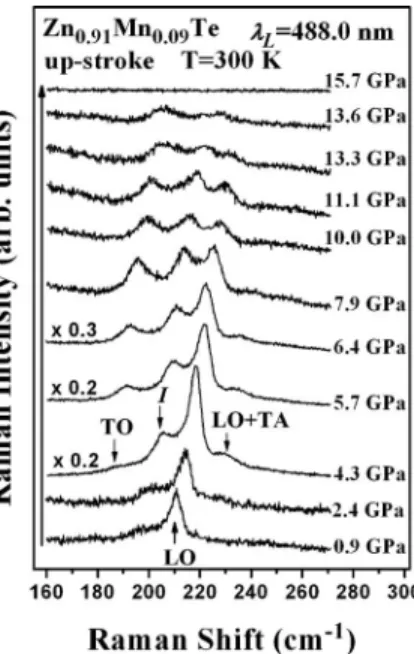
Figure4 displays the up-stroke pressure-dependent Ra-man spectra of Zn0.91Mn0.09Te. In addition to the LO and TO modes, a Mn-related impurity mode 共I兲 and a double struc-ture associated to LO+ TA共transverse acoustic兲 phonon ap-pear between the LO and TO phonons and at the higher-frequency side of the LO phonon, respectively. As the pressure increases, the impurity mode, the LO phonon, and the TO phonon shift to high frequencies which can be fitted by a quadratic polynomial, as listed in Table I. Since Zn is partially replaced by Mn, the intensity of the Raman spectra
is lower than that of ZnTe because the 3d orbital of Mn2+ ions hybridizes into tetrahedral bonds, causing distortions and altering the overall ZnMnTe crystal symmetry. Further-more, the LO phonon becomes opaque and disappears at 13.6⫾0.2 GPa. When the pressure is 15.7 GPa, the TO and
I modes become invisible. As the Mn content is increased
from 0 to 0.09, the semiconductor-to-metal phase transition pressure falls from 15.7 to 13.6 GPa.
Figure5plots the phase transition pressure as a function of the Mn content. A decline in the semiconductor-to-metal phase transition pressure共Pt兲 versus x is shown and is fitted using a quadratic curve, given by Pt共x兲=15.7−25.4x + 19.0x2 共GPa兲. As the Mn content increases from 0 to 0.26, the phase transition pressure falls from 15.7 to 10.3 GPa 共Table I兲, indicating that the substituted Mn2+ ions tend to reduce the stability of the crystal. The Mn2+ ions in Zn1−xMnxTe may alter the overall symmetry and soften the
lattice by generating large distortions. As the substituted el-ement content increases, the structure becomes less stable. This dependence is similar to other DMS II-VI ternary com-pounds. Yang et al.15found that for Zn1−xMnxSe compounds,
as x is increased from 0.07 to 0.24, the pressure of the me-tallic phase transition falls from 11.8 to 9.9 GPa. For the Zn1−xFexSe semiconductor, the existence of Fe ions 共x
= 0.16兲 in the ZnSe reduces the semiconductor-metal phase transition pressure from 14.4 to 10.9 GPa.14TableI summa-rizes the pressure-dependent LO, TO, and I phonon frequen-cies derived from quadratic polynomial fits to our measure-ments. Moreover, the pressure dependence of a mode frequency i can be defined using the dimensionless
Grü-neisen parameters共␥i兲,19 ␥i= −
冉
d lni d ln V冊
= 1  lni p =冉
K0 i冊冉
di dp冊
, 共2兲where K0 is the bulk modulus, defined as the reciprocal of the isothermal volume compressibility共兲, and V is the mo-lar volume in cm3/mol. Since the bulk modulus 共K0兲 of
FIG. 3. Up-stroke pressure-dependent Raman spectra of ZnTe at 300 K. Black arrows indicate the LO and the TO phonons. The excitation source is a 488.0 nm line from an Ar+laser. The pressure-induced RRS enhancement
occurs as the external pressure is increased.
FIG. 4. Up-stroke pressure-dependent Raman spectra of Zn0.91Mn0.09Te at
300 K. LO, TO, LO+ TA and impurity共I兲 modes are labeled.
Zn1–xMnxTe is unavailable, K0共ZnTe兲= 50.5 GPa is used.20As
shown in TableI, several conclusions can be drawn. At am-bient pressure共p⬃0兲, 共i兲 the LO phonon frequency increases and the TO phonon frequency decreases as the Mn compo-sition increases: the LO-TO splitting increases with Mn con-tent;共ii兲␥LO⬍␥TOis observed throughout all the specimens, and the ratio ␥TO/␥LO rises from 1.38 to 1.77 as the Mn concentration increases from 0 to 0.26. At high pressure,共iii兲
dLO/dp⬍dTO/dp, such that the LO-TO splitting falls
un-der external pressure for all samples herein; and共iv兲 dI/dp
and␥Ifollow no consistent trend over the entire Mn range of
interest共0.09⬉x⬉0.26兲. These results demonstrate that un-der ambient conditions, the manganese ions slightly increase the iconicity of ZnTe. Nevertheless, an externally applied
pressure reduces the iconicity and bond length of Zn1−xMnxTe crystals.
IV. CONCLUSIONS
RRS can enhance the LO and TO phonon intensities in studying pressure-dependent vibrational spectra of Zn1−xMnxTe thin films. Intermediate optical phonon mode
behavior was identified. The disappearance of the LO pho-non, which accompanies a semiconductor-to-metal phase transition in ZnTe, occurs at about 15.7⫾0.2 GPa. As the Mn content increases from 0 to 0.26, the metallic phase tran-sition pressure falls from 15.7 to 10.3 GPa. Based on the pressure-dependent LO and TO phonon frequencies and Grü-neisen parameters共␥i兲, externally applying pressure reduces
the iconicity of Zn1−xMnxTe compound semiconductors.
ACKNOWLEDGMENTS
This work was supported by the Ministry of Education under Grant No. MOE-ATU 97W801-C3 and the National Science Council under Grant No. NSC 96–2112-M-009– 026-MY3.
1D. L. Peterson, A. Petrou, W. Giriat, A. K. Ramdas, and S. Rodriguez, Phys. Rev. B33, 1160共1986兲.
2M. C. Kuo, J. S. Hsu, J. L. Shen, K. C. Chiu, W. C. Fan, Y. C. Lin, C. H.
Chia, W. C. Chou, M. Yasar, R. Mallory, A. Petrou, and H. Luo,Appl. Phys. Lett.89, 263111共2006兲.
3
H. KJpa, L. V. Khoi, C. M. Brown, M. Sawicki, J. K. Furdyna, T. M. Giebultowicz, and T. Dietl,Phys. Rev. Lett.91, 087205共2003兲.
4Le Van Khoi, M. Sawicki, K. Dybko, V. Domukhovski, T. Story, T. Dietl,
A. JJdrzejczak, J. Kossut, and R. R. Gałązka,Phys. Status Solidi B229,
53共2002兲.
5Le Van Khoi and R. R. Gałązka, Phys. Status Solidi C 3, 837共2006兲. 6D. Ferrand, J. Cibert, A. Wasiela, C. Bourgognon, S. Tatarenko, G.
Fishman, T. Andrearczyk, J. Jaroszyński, S. Koleśnik, T. Dietl, B. Barbara, and D. Dufeu,Phys. Rev. B63, 085201共2001兲.
7H. Ohno, A. Shen, F. Matsukura, A. Oiwa, A. End, S. Katsumoto, and Y.
Iye,Appl. Phys. Lett.69, 363共1996兲.
8H. Munekata, H. Ohno, S. von Molnar, A. Segmüller, L. L. Chang, and L.
Esaki,Phys. Rev. Lett.63, 1849共1989兲.
9Y. C. Lin, C. H. Chiu, W. C. Fan, S. L. Yang, D. S. Chuu, M. C. Lee, W.
K. Chen, W. H. Chang, and W. C. Chou, J. Appl. Phys. 102, 123510
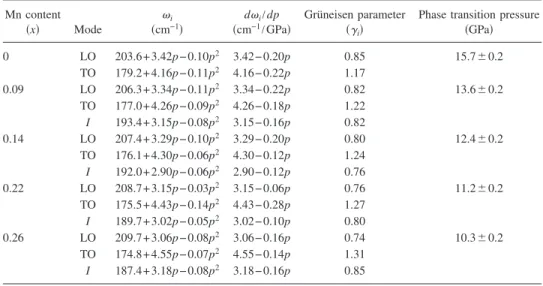
TABLE I. Pressure-dependent LO, TO, and I phonon frequencies 共i兲, di/dp, calculated mode Grüneisen
parameters共␥i兲, and phase transition pressures of Zn1−xMnxTe.
Mn content 共x兲 Mode i 共cm−1兲 di/dp 共cm−1/GPa兲 Grüneisen parameter 共␥i兲
Phase transition pressure 共GPa兲 0 LO 203.6+ 3.42p − 0.10p2 3.42− 0.20p 0.85 15.7⫾0.2 TO 179.2+ 4.16p − 0.11p2 4.16− 0.22p 1.17 0.09 LO 206.3+ 3.34p − 0.11p2 3.34− 0.22p 0.82 13.6⫾0.2 TO 177.0+ 4.26p − 0.09p2 4.26− 0.18p 1.22 I 193.4+ 3.15p − 0.08p2 3.15− 0.16p 0.82 0.14 LO 207.4+ 3.29p − 0.10p2 3.29− 0.20p 0.80 12.4⫾0.2 TO 176.1+ 4.30p − 0.06p2 4.30− 0.12p 1.24 I 192.0+ 2.90p − 0.06p2 2.90− 0.12p 0.76 0.22 LO 208.7+ 3.15p − 0.03p2 3.15− 0.06p 0.76 11.2⫾0.2 TO 175.5+ 4.43p − 0.14p2 4.43− 0.28p 1.27 I 189.7+ 3.02p − 0.05p2 3.02− 0.10p 0.80 0.26 LO 209.7+ 3.06p − 0.08p2 3.06− 0.16p 0.74 10.3⫾0.2 TO 174.8+ 4.55p − 0.07p2 4.55− 0.14p 1.31 I 187.4+ 3.18p − 0.08p2 3.18− 0.16p 0.85
FIG. 5. Mn concentration共x兲-dependent semiconductor-to-metal phase tran-sition pressure of Zn1–xMnxTe. The solid curve is a quadratic polynomial fit,
given by Pt共x兲=15.7−25.4x+19.0x2 共GPa兲.
013503-4 Lin et al. J. Appl. Phys. 104, 013503共2008兲
共2007兲.
10K. Strössner, S. Ves, C. K. Kim, and M. Cardona,Solid State Commun.
61, 275共1987兲.
11V. V. Shchennikov, S. V. Ovsyannikov, A. Y. Derevskov, and V. V.
Shchennikov, Jr.,J. Phys. Chem. Solids67, 2203共2006兲.
12J. Camacho, I. Loa, A. Cantarero, and K. Syassen,High Press. Res.22,
309共2002兲.
13R. J. Nelmes, M. I. McMahon, N. G. Wright, and D. R. Allan,Phys. Rev. Lett.73, 1805共1994兲.
14C. M. Lin, D. S. Chuu, T. J. Yang, W. C. Chou, J. Xu, and E. Huang,Phys. Rev. B55, 13641共1997兲.
15C. S. Yang, C. S. Ro, W. C. Chou, C. M. Lin, D. S. Chuu, J. Hu, E. Huang,
and J. Xu,J. Appl. Phys.85, 8092共1999兲.
16Y. C. Lin, C. H. Chiu, W. C. Fan, S. L. Yang, D. S. Chuu, and W. C. Chou, J. Appl. Phys.101, 073507共2007兲.
17A. Mujica, A. Munoz, and R. J. Needs,Rev. Mod. Phys.75, 863共2003兲,
and references therein.
18J. C. Phillips,Phys. Rev. Lett.27, 1197共1971兲.
19M. Blackman and W. B. Daniels, in Light Scattering in Solids IV, edited
by M. Cardona and G. Güntherodt共Springer, Berlin, 1984兲, Chap. 8.
20A. San-Miguel, A. Polian, M. Gauthier, and J. P. Itié,Phys. Rev. B48,
8683共1993兲.