國立交通大學
光電工程學系
顯示科技研究所
碩士論文
雙調變高動態範圍顯示系統之演算法
Modified Algorithm for Dual Modulation High
Dynamic Range System
研究生:呂柏毅
指導教授:田仲豪 博士
雙調變高動態範圍顯示系統之演算法
Modified Algorithm for Dual Modulation High
Dynamic Range System
研 究 生: 呂柏毅
Student: Po-I Lu
指導教授: 田仲豪 Advisor: Dr. Chung-Hao Tien
國立交通大學 電機學院
光電工程學系
顯示科技研究所
碩士論文
A Thesis
Submitted to Display Institute & Photonic Department
College of Electrical Engineering Science
National Chiao-Tung University
in Partial Fulfillment of the Requirements
for the Degree of Master
In
Display Institute
October 2008
Hsin-Chu, Taiwan, Republic of China.
雙調變高動態範圍顯示系統之演算法
研究生:呂柏毅 指導教授:田仲豪 博士
國立交通大學
光電工程學系 顯示科技研究所
摘 要
自從高動態範圍顯示器被研發出來後,系統之效能以非常快的速度在進步。 對高動態範圍顯示器來說,光擴散函數是一項非常重要的因素,因為光擴散函數 連結了高動態範圍顯示器之光機與信號處理。因此,我們建立了由被動顯示器與 液晶面板組成之雙調變高動態範圍顯示系統,希望藉由此測試平台來研究光擴散 函數對系統效能之影響。但傳統液晶補償信號是根據液晶面板之理想色調再生曲 線做運算,而大部分液晶面板之色調再生曲線都不是呈現理想之曲線,傳統之運 算不再適用於雙調變高動態範圍顯示系統。本論文嘗試將顯示器色彩特徵化模型 應用於控制雙調變高動態範圍顯示系統之液晶面板,期能得到正確的信號來重現 目標亮度與色彩。Modified Algorithm for Dual Modulation High
Dynamic Range System
Student: Po-I Lu
Advisor: Dr. Chung-Hao Tien
Department of Photonics & Display Institute
National Chiao Tung University
Abstract
Since the high dynamic range displays were reported, the improvement on system performance has made a rapid progress. Among the technical considerations, light spread function is a key parameter to correlate the optomechanical setup with the signal process of the HDR display. The dual modulation system, which is constructed by the passive display and LC panel, offers a convenient platform to investigate the effect of LSF on system performance. However, for most of the LC panel, the tone reproduction curve deviates from the ideal one. The traditional computation for compensated LC signal, which is based on the ideal tone reproduction curve, is no longer suitable for dual modulation system. In this study, a modified algorithm which taken the characteristic of LC panel into account was proposed for dual modulation system. The accurate signal for reproducing target luminance and color can be obtained after applying the proposed algorithm.
誌謝
本論文得以順利完成,首先要由衷感謝我的指導教授田仲豪教授這二年多來 的指導與提攜。老師平時教學態度認真嚴謹,對學生總不厭其煩細心指導,使我 能發揮潛能,完成老師所托付的各項挑戰,並從中獲得許多的寶貴經驗,在此向 田老師致上我最高的敬意與謝意。 在實驗室的日子裡,特別要感謝博士班陸彥行學長、簡銘進學長、洪健翔學 長以及顯示系統實驗室的鄭裕國學長在研究方向以及實驗上的建議,以及在各方 面的合作與協助,讓我受益良多。此外,還有鄭璧如學姊、藍子翔學長以及已經 畢業的學長們在研究過程中提供許多寶貴的建議。感謝這兩年在實驗室一起渡過 的同學:蕭人彰、潘紀豪、洪瑋琮、鍾積賢及余宗翰,謝謝你們讓我在這段研究 的生活更加充實,以及學弟妹在課業上、生活上以及研究上的幫助與分享,並陪 伴我一起度過這些快樂的日子。 最後,要感謝我的父母親無怨無悔辛苦栽培,及家人與所有關心我的人長期 的支持與鼓勵,使我能勇往直前全力以赴順利完成學業。要感謝的人太多,無法 一一在此詳述,在此,我感謝家人的照顧與鼓勵及所有曾經關心過我的同學與朋 友們,願能以我所學的知識,回饋貢獻給社會以回報所有關心我的人。Table of Contents
Abstract (Chinese) ... i
Abstract (English) ... ii
Acknowledgement ... iii
Table of Contents ... iv
Figure Captions ... vii
List of Tables...x
Chapter 1 ...1
1.1 Motivation...1 1.2 Objective...6 1.3 Organization...7Chapter 2 ...8
2.1 Backlight Scaling...82.2 HDRD: High Dynamic Range Display...12
2.2.1 Hardware Structure ...12
2.2.2 Algorithm of HDRD ...16
2.2.4 Dual-Modulation High Dynamic Range Display Devices...20 2.3 Summary ...21
Chapter 3 ...23
3.1 Introduction...23 3.2 Dual-modulation HDR System...24 3.2.1 Projector-Based System...24 3.3 Color Management...273.3.1 Colorimetric Characterization Model ...29
3.4 The Proposed Algorithm...30
3.4.1 Algorithm Structure ...30 3.4.2 Backlight Calculation...32 3.4.3 LC Signal Calculation...33 3.5 Summary ...35
Chapter 4 ...36
4.1 Introduction...36 4.2 Instrument ...36 4.3 Evaluation Indices...374.4 Maximum Compensated Factor...37
4.5 Experimental Results ...38
4.5.1 Luminance...40
4.5.2 Chromaticity ...41
4.5.3 Contrast Ratio ...42
Chapter 5 ...51
5.1 Conclusions...51
5.2 Future Works...52
Figure Captions
Fig. 1-1 Dynamic range of real world and display device...1
Fig. 1-2 Comparison of different backlight dimming system...2
Fig. 1-3 Features of 2D dimming backlight...3
Fig. 1-4 Structure of HDR-LCD display system ...4
Fig. 1-5 Backlight distribution built by different LSF. (a) by free-spreading LSF (b) by localized square LSF...5
Fig. 2-1 The schematic of different type of backlight system (a) side emitting type and (b) directly view type backlight system. ...9
Fig. 2-2 DLS experiments on several movies. The photos on the left-hand side are original movies. The photos on the right-hand side are compensated screen shots. Power reduction/relative backlight luminance are (a) 805 mW/35.9% (b) 147 mW/87.5 % ...11
Fig. 2-3 The results of sample images and corresponding transformed versions. ...12
Fig. 2-4 Layout of LED array behind color LCD. ...14
Fig. 2-5 Composite formation of HDR image. Top line from left to right: Desired image, LED setting, LCD panel setting and final HDR image. Bottom line shows an image example. ...14
Fig. 2-6 HDRD structure...15
Fig. 2-7 The algorithm of HDRD. ...17
Fig. 2-8 From left to right: a color coded original HDR image; HDR photograph taken off the screen of HDR display system; HDR photograph taken off a conventional monitor displaying the tone-mapped image. ...17
Fig. 2-9 TVI functions for the rod and cone system. ...18
Fig. 2-10 The experimental setup used to emulate displays with different levels of backlight modulation. ...21
Fig. 3-1 (a) The schematic diagram of the projector-based system which are composed of a projector, a diffuser and LC panel; (b) the photograph of the practical projector-based implementation...25
Fig. 3-2 Process of adjusting image size for the alignment. ...26
Fig. 3-3 Tone reproduction curves for same LCD driven by two different computers...28
Fig. 3-4 The structure of proposed algorithm. ...31
Fig. 3-5 Steps of simulated backlight calculation algorithm. ...32
Fig. 3-6 Diagram of pixel compensation algorithm...34
Fig. 4-1 (a) Input image (b) corresponding backlight distribution (c) corresponding compensated LC image...38
Fig. 4-2 The compensated LC images with different MCF. Top : full size of the image. Bottom : zoom in for red rectangle area...38
Fig. 4-3 Two modes of projector-based system to verify the proposed algorithm: (a) full-on mode (b) dimming mode. ...39
Fig. 4-4 (a)The luminance curve of dimming mode and full-on mode (b) zoom in for blue dashed area. ...40
Fig. 4-5 Three representative images: (a) moon (b) heart (c) sunset...42
Fig. 4-6 The simulated backlight setup for projector-based system. ...43
Fig. 4-7 Simulated images after applying the proposed algorithm (a) Test image (b) simulated backlight distribution (c) compensated LC image...44 Fig. 4-8 Comparison of original LC signal and compensated LC signal (a)
of compensated LC signal...45 Fig. 4-9 Photographs of projector-based system and corresponding maximum
and minimum luminance (a) full-on mode and (b) dimming mode...48 Fig. 4-10 Comparison of contrast ratio between full-on and dimming mode...49 Fig. 5-1 The intensity distributions of the Gaussian LSF of (a) single light
source and (b) the overall panel area, which is computed using convolution calculation with the Gaussian LSF as the impulse response function. The overall intensity distribution is, in general, decreased from the center toward the panel edges...53 Fig. 5-2 (a) Schematic diagram of the optical component consists of a square
light guide at the bottom, a side-emitting LED, and a concentric prism film on the top; (b) The central cross-sections of luminance distribution for single light guide...54
List of Tables
Tab. 4-1 Absolute color difference between dimming mode and reference data. ....41 Tab. 4-2 Contrast ratio of Moon, Heart and Sunset by using full-on and dimming
Chapter 1
Introduction
1.1 Motivation
The dynamic range we encounter in the real world (14 orders) exceeds the capabilities of current display devices (4 orders) by several orders of magnitude, as shown in Fig. 1-1. One of the drawbacks of conventional liquid crystal displays (LCDs) is low contrast ratio due to the light leakage of liquid crystals. The conventional display devices cannot meet the need of the human visual system (HVS), especially when demonstrating dynamic range. After backlight dimming technologies were proposed, the backlight signal could be modulated according to the image content to extend the image dynamic range of LCDs.
Fig. 1-1 Dynamic range of real world and display device.
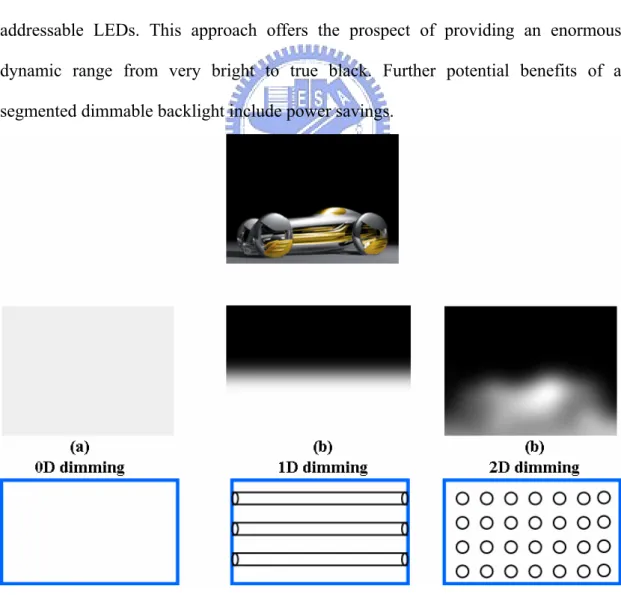
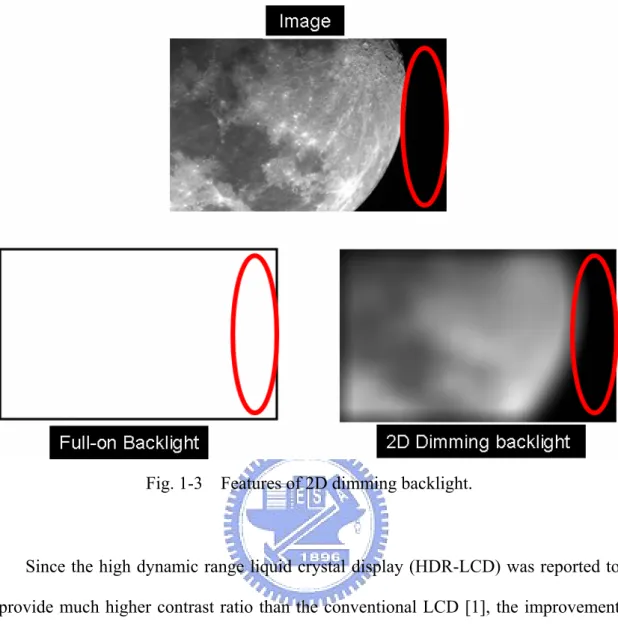
configurations. Flat fluorescent lamps can only use the 0D dimming (global dimming). 1D dimming (line dimming) is applicable to CCFLs, HCFLs, and EEFLs, and 2D dimming (local dimming) is applicable to LED backlights as well as matrix-type FEDs, OLEDs, and plasma backlights. As the dimming dimension increases, the luminance distribution of backlight will become more similar to the original image and control the local brightness independently. In this thesis, 2D dimming technologies will be adopted for achieving high dynamic range (HDR). Compare to conventional LCDs with full-on backlight, there is an obvious advantage in LCDs with local-dimming backlight, as shown in Fig. 1-3.
The local dimming backlight can be constructed using a matrix of individually addressable LEDs. This approach offers the prospect of providing an enormous dynamic range from very bright to true black. Further potential benefits of a segmented dimmable backlight include power savings.
Fig. 1-3 Features of 2D dimming backlight.
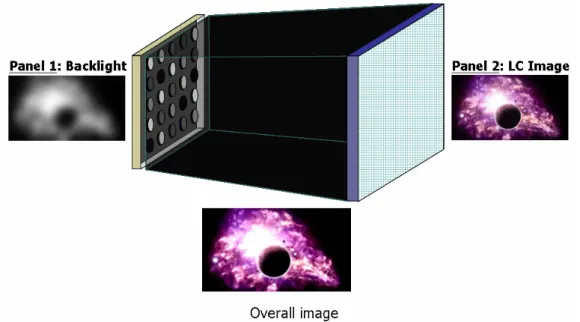
Since the high dynamic range liquid crystal display (HDR-LCD) was reported to provide much higher contrast ratio than the conventional LCD [1], the improvement on system performance has made great progress nowadays. HDR-LCD system can be considered as a dual panel display. One is backlight panel and the other is LC panel, as shown in Fig. 1-4. Backlight panel is a low resolution panel for controlling the contrast ratio of the images. According to each target image, the backlight signals was decided by the pixel values of the target image. For the LC panel, it is a high resolution for displaying the detail of the image, LC signals was adjusted to compensate the reduced brightness due to the backlight dimming.
Fig. 1-4 Structure of HDR-LCD display system
The backlight distribution dominates the performance of the HDR-LCD. There are several method to obtain different backlight distribution. For example, selection of the backlight signal, number of backlight segments, light spread function (LSF) of the backlight unit [1] [2] [3] [4], all the factors mentioned above will lead to differnet performance.
Among technical considerations, the LSF must occupy the most significant role because it is the joint correlating the hardware with the software of the HDR-LCD. Thererfore, we want to build a platform which can provide various LSFs for testing.
The dual-modulation HDR system offers a convenient platform to simulate the HDR-LCD. For the backlight panel in HDR-LCD, it can be replaced by the LCD or projector. Both of these display devices have the ability to provide 2d-dimmable luminance distribution. Although the combination of display device and LC panel is not suitable for commercial purpose, it provide a convenient testing platform to investigate the performance of HDR-LCD with different backlight dimming distribution [3]. The fixed backlight segments and LSF is applied to the consideration
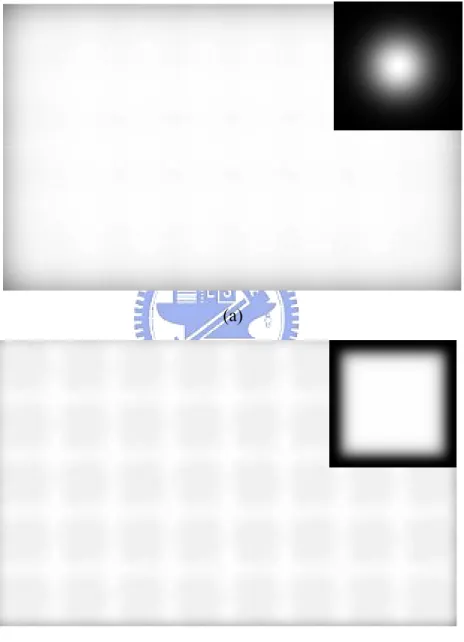
of mass production possibility for the HDR-LCD. It is hard to compare the performance between various LSFs. By sending adequiate signals to the computer-conttrolled display device, on the other hand, different LSFs can be obtained. The example is shown in Fig. 1-5.
(a)
(b)
Fig. 1-5 Backlight distribution built by different LSF. (a) by free-spreading LSF (b) by localized square LSF.
The dual-modulation HDR system is convenient for researchers to investigate the performance of the HDR display. The display devices were rendered as the backlight module in dual-modulation HDR system. The LC panel functioned as the second light modulator after removing the backlight module.
Unfortunately, we found that most of the LCDs are not well-calibrated. Tone reproduction curves for red, green, and blue channels are not identical. This issue has the strong impact on transfroming the calculated value into digital value for LC panel. First, the compensated LC signal for LC panel will not be accurate. Second, color shift for the output image occured while same compensated facor is applied for RGB channel. The original algorithm based on the well-calibrated LCD is no longer suitable for our pseudo-HDR display. For these reasons, a modified algorithm for this dual-modulation system is necessary.
1.2 Objective
In order to convert the luminance and chromaticity into accurate red, green, and blue digital value (dr, dg, db) for LC panel, we proposed a modified algorithm for this dual-modulation HDR system. The proposed algorithm combines with the concept of the original algorithm for HDR-LCD and color management for LCD. By using the colorimetric characterization model, the main calculation is now in the tristimulus domain.
The objective of this research is to propose an algorithm for the dual-modulation HDR system, and verify that it functions well. The goal of the proposed algorithm follows the concept of the original HDR-LCD algorithm, that is, maintain the luminance for bright image and suppress the light leakage for the dark image after backlight dimming is applied. The correct color reproduction is also taken into account.
1.3 Organization
The thesis is organized as following: the previous work in the fields of high dynamic range display (HDRD) will be presented in Charter 2. In Chapter 3, the specification of dual-modulation HDR system and proposed algorithms will be described in detail. The experimental results will be obtained in Chapter 4. Finally, the conclusions and the future works will be described in Chapter 5.
Chapter 2
Previous Work
The limited dynamic range of displays has received much attention in the computer graphics community recently. The dynamic range of conventional displays is insufficient to create the optical sensation of watching sunset or sensing the upcoming traffic at night. The situation is not only an issue of showing the highest intensity, because increasing the brightness of a conventional display would result in the dark level into medium gray. What needed is a significant expansion of the contrast or dynamic range of the display.
2.1 Backlight Scaling
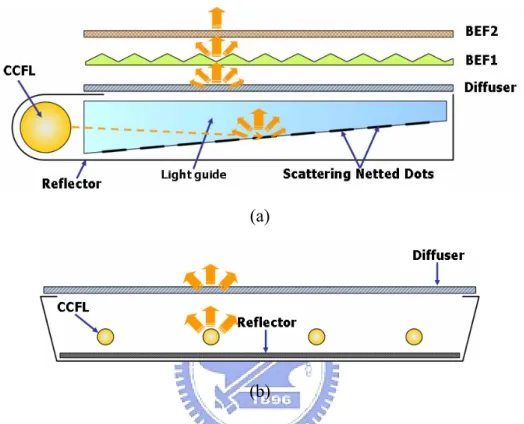
Recently, TFT LCD is widely embedded into various electronic instruments like TV, camera, monitor, cell phone, etc. Because TFT LCD panel is not a self-emissive device, an additional backlight module (BLM) is necessary. A general backlight module consists of a transparent light guide, optical films, and light source. Depending on the position of light source, the LCD can be roughly classified two types: side-emitting type and directly-view type as shown in Fig. 2-1.
In conventional cold cathode fluorescent lamps (CCFLs) LCD, the light sources are always turned on for emitting light toward LC cells during usage. This kind of backlight has significant light leakage of the LC cell. The condition results in the insufficient dark state. The dark image region does not look dark enough. Also the issue of power consumption appears while the backlight system is always turned on.
The power consumption issue is widely concerned due to the popularity of portable devices. In order to reduce the power consumed by the backlight, the concept of backlight scaling has been proposed[5].
(a)
(b)
Fig. 2-1 The schematic of different type of backlight system (a) side emitting type and (b) directly view type backlight system.
Backlight scaling dynamically dims the backlight to conserve the power consumption while increasing the transmittance of the LCD panel. The basic idea is compensating for the image fidelity loss due to reduced backlight. Image fidelity was defined as the resemblance between the original and backlight-scaled image. If the backlight-scaled image is identical to the original image in terms of the brightness of each pixel, also called brightness-invariant backlight scaling, then there is no fidelity loss after backlight scaling. Otherwise, when a more dramatic backlight scaling was used to gain greater power savings, the brightness invariance is no longer attainable and the induced distortion degrades the image fidelity. Image fidelity can be measured
by the brightness variance after backlight scaling.
Backlight scaling methods to reduce the power consumption with the effect of keeping or even enhancing image qualities including contrast ratio are needed. Most of the ways are content dependent. Chang et al. [5] proposed “Dynamic Backlight Luminance Scaling technique (DLS)” to reduce the power consumption of the LCD displays. This technique was based on the human eye’s perception of the light, which is emitted from the LCD panel, is a function of two parameters: one is the luminance of the backlight and the other is transmittance of the LC panel. By adjusting these two parameters, the same perception in human eyes at different values of the backlight intensity and the LC transmittance can be obtained. The energy consumption of the backlight source can be reduced significantly by reducing backlight intensity, that is, one can save energy by simply dimming the backlight and then compensate the loss of brightness by adjusting the LCD transmittance. The results of the DLS backlight scaling is shown in Fig. 2-2.
The two main drawbacks of DLS are concerned. First, it manipulates pixels on the screen one-by-one, so that limits the application of this method to still images or low-frame-rate videos. Second, it achieves energy saving at the cost of loss in visual information. Therefore, the improvement of eliminating pixel-by-pixel transformation of the image comes through minor hardware modifications to the built-in LCD reference driver [6]. The modifications could implement at any single band grayscale spreading function to improve the brightness and contrast of image extending the applicability of the approach to streaming applications.
(a)
(b)
Fig. 2-2 DLS experiments on several movies. The photos on the left-hand side are original movies. The photos on the right-hand side are compensated screen shots. Power reduction/relative backlight luminance are (a) 805 mW/35.9% (b) 147 mW/87.5 %
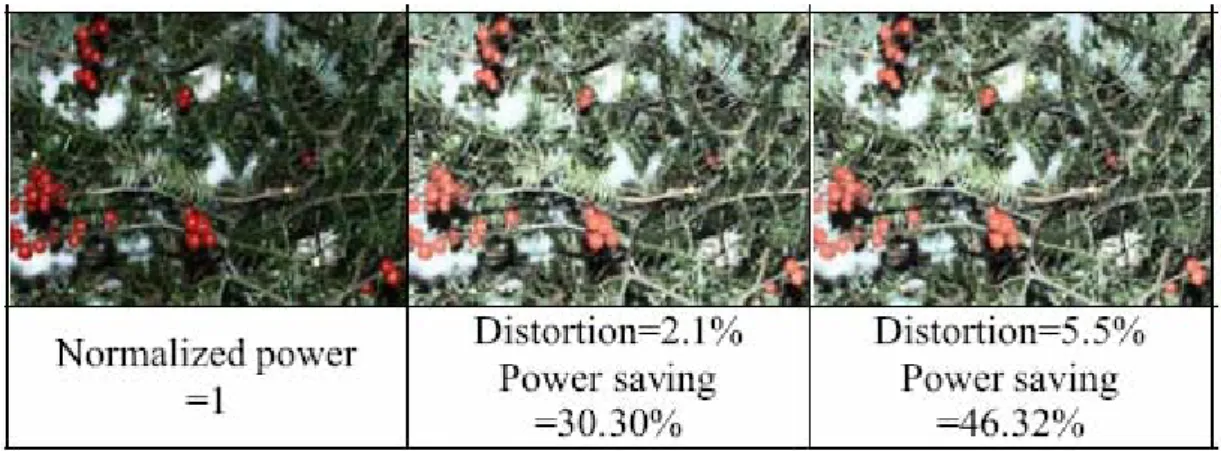
Ali Iranli, et al. [7] improved the previous approaches in two aspects. Using global histogram equalization preserves most of visual perception, and modifying the architecture of built-in LCD reference driver produces piece-wise linear image transformation function. This approach has two main disadvantages: one is that the empirical distortion characterization curve is dependent on the type of the displayed image; the other is the requirement of image histogram information to calculate the transformation function. The approach relies on a definition of the image distortion, which accounts for both pixel value difference and human visual system. The performance of histogram equalization for backlight scaling is shown in Fig. 2-3. The seriousness of image distortion increases with the extent of power saving.
Fig. 2-3 The results of sample images and corresponding transformed versions.
In summary, the original intension of backlight scaling is saving power, but at the same time, the dimming backlight can also enhance the dark state of displays. Therefore dynamic backlight was applied for the HDR display system.
2.2 HDRD: High Dynamic Range Display
Global dimming backlight system has limited effect in contrast enhancement and power saving. Hence the HDR-LCD with locally controlled LED backlight will be introduced in this section.
2.2.1 Hardware Structure
In a conventional LCD, two polarizers and a liquid crystal are used to modulate the light coming from the BLM, typically the CCFL assembly. The light is polarized by the first polarizer and transmitted through the liquid crystal where the polarization of the light is rotated in accordance with the control voltages applied to each pixel of liquid crystal. Finally, the light exits the LCD by transmission through the second polarizer. The luminance level of the light emitted at each pixel is controlled by the
polarization state of the liquid crystal. It is important to point out that the light can not be obstructed ideally when displaying very dark pixel. The dynamic range of the LCD is defined by the ratio between the brightest state and the light emitted in the darkest state. For a high end LCD, this ratio is usually around 300:1. With monochromatic specialty LCDs (e.g. medical imaging) going up to 700:1. The luminance range of the display can easily be adjusted by controlling the brightness of the backlight, but the dynamic range ratio will remain the limiting factor. In order to maintain a reasonable dark level of about 1 cd/m2, the LCD is thus limited to a maximum brightness of about 300 cd/m2.
The HDR display which provides the images with a dynamic range similar to that encountered in the real world is first proposed by Brightside Technology [1] [8]. The basic modification introduced by the HDR technology involves inserting a second light modulator and increasing the brightness of the backlight. These two modulators in series provide an extremely dark state with a very low light emission, which makes it possible to increase contrast ratio dramatically. The light output of each pixel of the HDR display is the result of two modulations. This modified display system is based on the idea of using LC panel as an optical filter to modulate low resolution image from the backlight, as shown in Fig. 2-4. The low resolution image of the LED array is projected through a color LC panel, which displays a similar, but high resolution, version of the image. This modification is described in Fig. 2-5.
For example, assume that the LED array with contrast of c1:1, where c1 is the normalized maximum intensity. If the LC panel with a contrast ratio of c2:1, where c2 is the normalized maximum intensity, locates in front of the LED array. Then the theoretical contrast ratio of the combined system is (c1 x c2):1. Practically, the first display, the LED array, needs to be able to produce high contrast and brightness images, because color LC panels only have the transmittance under 8%. Another
reason for using a display with high intensity based backlight is that there are very bright regions in most HDR images.
Fig. 2-4 Layout of LED array behind color LCD.
Fig. 2-5 Composite formation of HDR image. Top line from left to right: Desired image, LED setting, LCD panel setting and final HDR image. Bottom line shows an image example.
The HDRD is composed of two main parts: LED array and LC panel. The LED array is served as a low-resolution image by controlling the brightness of each LED dynamically and individually. Based on the incoming light distribution, the driving signals of each LC pixels are well modified by algorithm to modulate precisely the light energy passing through each LC pixels. In addition, the LC panel is a common one as conventional LCD. The optical structure includes optical design, and all optical devices, such as diffuser and brightness-enhancing film (BEF). The structure is depicted in Fig. 2-6.
Fig. 2-6 HDRD structure
The use of LEDs for dynamic backlight system achieves high dynamic range display. The contrast ratio was 50,000:1, and the maximum luminance was 8,500 proposed by Brightside.
2.2.2 Algorithm of HDRD
The complete rendering algorithm of HDRD is introduced in Fig. 2-7. First, take the square root of the original HDR image with intensity (step 1) for compensating the luminance decrease caused by the non-ideal light spreading of each LED. The resulted image (step 2) thus derives the target intensities I L for every individual LED
(step 2a). To this end, what is done is to down-sample the image to the resolution of the LED array, and to get the intensity values for the LED. Map these intensities into LED values by applying the inverse of the LED’s response function r1-1 to obtain the
signal for LEDs (step 3). The LEDs are now producing an image of intensity r1[r1-1(I L)]= I L, except that the image is actually blurred according to p1, the LED’s point
spread function (PSF), also called light spread function (LSF) [1] [4]. To simulate this blurring, convolve the LED intensities with PSF (step 4) and divide the result from the original HDR image to get the target LC transparency (step5). For the final pixel values of the LC panel, apply the inverse of the panel’s response function r2 to get the
modified LC signals (step 6).
To solve the values of compensated LC signal, taking the overlap of the LSF into account. The LSF of an LED has an impact that the LSFs of neighboring LEDs overlap one another. Solution can be approximated by single Gauss-Seidel iteration over neighboring LED pixels. This amounts to a local weighted average if neighboring LED target values, where some weights are negative. This approach to compensate for differences between the LED values and the target image relies on the LCD panel. To this end, the forward-simulated low-frequency image (step 4) generated by the LED panel is in order to derive the LCD pixel values. The LED image is low-pass filtered. As a result, the compensation performed in the LC panel is significant, and visible in adequate images.
The results of the HDRD hardware and algorithm are shown above. The HDRD presents better contrast ratio than conventional display devices. Fig. 2-8 shows the example of the comparison between the HDR display system proposed by Brightside and conventional display devices.
Fig. 2-7 The algorithm of HDRD.
Fig. 2-8 From left to right: a color coded original HDR image; HDR photograph taken off the screen of HDR display system; HDR photograph taken off a
conventional monitor displaying the tone-mapped image.
Besides contrast ratio, illumination also plays a important role in visual perception from relevant literature. There are physiological and psychophysical evidences that absolute brightness information is important to human visual system. Local contrast is used instead to convey the wealth of information about the real world. It is therefore essential to preserve contrast information for display. In addition, human sensitivity to luminance changes is not constant throughout the range of luminance, but is given by threshold vs. intensity (TVI) function which gives the value of just noticeable luminance difference for given adaptation level [9]. This function has been experimentally measured and shown in Fig. 2-9.
2.2.3 Compensated Signal of LC Panel
The dimming backlight decreases the luminance of bright regions in images, so that the transmittance of LC must be increased to compensate the decreased backlight luminance [10]. Compensation consists of multiplying the original data by the reciprocal of the relative illumination in the linear light domain before sending it to the LC panel. The output luminance of the LC panel at each backlight (BL) level is calculated in Eq. (2-1). The output luminance L depends on the digital code value, CV, raised to the power gamma and scales with backlight level BL.
γ
CV
L(BL,CV)=BL( )
255 (2-1)
To achieve the same output luminance with a reduced backlight, the control signal of the LC panel can be compensated by using the relation L(BLreduced,y)=L(BLfull,x).
Given a reduced backlight and a code value displayed at full backlight, Eq. (2-2) shows the relation for the code value on the reduced backlight resulting in a identical output. CVreduced represents the code value needed to let the LCD output with reduced
backlight as bright as the LCD output with full backlight and code value CVfull. Eq.
(2-2) describes the case we want to equalize.
γ γ reduced full reduced full BL ( ) =BL ( ) 255 255 CV CV (2-2) Solving for the needed code value for compensation yields the result of Eq. (2-3).
A change in backlight is compensated by linear scaling in the digital code value domain by a factor dependant upon the relative backlight ratio and display gamma.
1 γ full reduced full reduced BL = BL CV ⎛⎜ ⎞⎟ CV ⎝ ⎠ (2-3)
Compensation for backlight dimming consists of a tone scale which is linear with a slope determined by the display gamma and the relative backlight illumination.
Digital range limits on the tone scale generally impose some degree of clipping in the compensating tone scale. Clipping occurs when CVreduced exceeds the code value
range (e.g., 255).
However, the computation mentioned above is based on the ideal tone reproduction curve. But most of the LCDs are not well-calibrated, the computation is not suitable for all the LCDs. Moreover, there is no light leakage in Eq. (2-1). The Eq. (2-1) fails when the digital code value equals zero.
2.2.4 Dual Modulation High Dynamic Range Display Devices
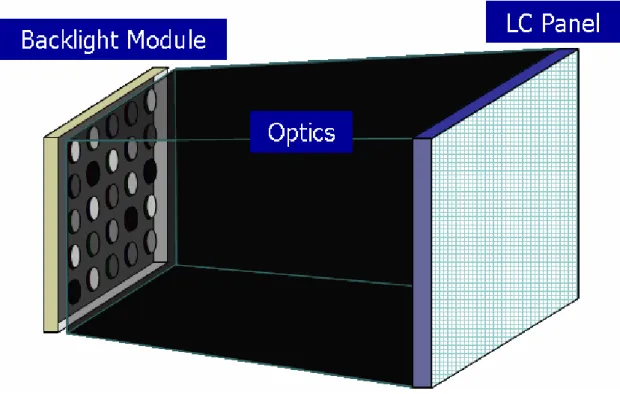
High dynamic range displays combine two modulators in series to achieve high dynamic range. The choice of modulator can in general be any combination of passive or active emissive modulators. It is highly desirable that the spatial resolution of the first modulator is lower than that of the second modulator and that the image created by the first modulator is blurred. The second modulator can be used to correct for the lower resolution of the first modulator [11].
For direct view displays a option is to use a low resolution array of light sources, such as LED array, as the first modulator and a transmissive LCD as the second modulator. An alternative arrangement suitable is to combine two passive displays in front of a high luminance light source. S.Swinkels et al.[3] proposed a psychophysical experiment to assess the effect of backlight resolution, determined by the number of backlight segments, on the perceived image quality. The experimental setup provides a platform to simulate the HDRD, as shown in Fig. 2-10. Panel 1 was used to simulate the light modulation of a segmented backlight. In this experiment, they only considered luminance dimming, such that the backlight signals displayed on panel 1 were gray level images. Panel 2 represented the actual LC panel after removing the backlight module. The performance of the HDRD with various backlight conditions
can be discussed by means of this platform without the real HDRD hardware. According to the experimental results, the contrast improvement achieved by backlight modulation is highly preferred over systems without backlight modulation, even when the backlight is only dimmed globally or over a few spatial segments. In a 30” display, image quality was found to increase as the number of segments increases and saturates for more than 2500 segments, and the improvement in perceived image quality due to the increase of the number of segments was highly dependent on the content of the image.
Fig. 2-10 The experimental setup used to emulate displays with different levels of backlight modulation.
2.3 Summary
years. Although the algorithm is well-known, the relationship between the LSF and performance of HDR-LCD is not clearly described in these publications. The LSF played an important role in HDR-LCD system. Different LSF would lead to several impacts on system performance, such as uniformity, contrast ratio and processing time of the convolution. Fortunately, dual-modulation system offers a convenient platform to simulate the HDR-LCD. By sending adequate signal to passive display, different LSF can be obtained easily. The system performance with different LSF can be compared via the dual-modulation system. However, most of the LC panel are not well-calibrated. The traditional algorithm is not suitable for off-the-shelf dual modulation system. The characteristic of LC panel should be taken into account for providing accurate signal for dual-modulation system.
Chapter 3
Experimental Setup and Proposed Algorithm
3.1 Introduction
The advantage of the dual-modulation HDR system is that this system provides a convenient platform to simulate the HDR-LCD. By using this platform, various dimmable backlight distributions can be obtained by sending adequate signals to each display. Hence, the performance of the HDR-LCD with different algorithms and backlight distribution can be evaluated via these platforms. The dual-modulation HDR system has been introduced in section 2.2.4, one drawback of the super-imposed LCD panels is that the luminance of the simulated backlight is not bright enough to appear the practical luminance distribution. An alternative passive display to simulate the backlight distribution is projector. Therefore,the projector-based system is chosen to be the platform in our experiment.
However, the color space of the computer-controlled display, such as LCD, is device dependent (RGB). For example, display the same RGB data on three different monitors, side by side, and you will get a noticeably different color balance on each display. Furthermore, the tone reproduction curves for RGB channel are not always identical. The algorithms based on the well-calibrated display as described in 2.2.3 are not suitable for this platform. Thus, we proposed a modified algorithm for the dual-modulation HDR system.
In this chapter, the dual-modulation HDR system will be introduced first, and proposed algorithm for this system will be presented.
3.2 Dual-Modulation HDR System
A dual-modulation HDR system for simulating HDR-LCD will be discussed in this section. The specification and experimental setup will be described in detail.
3.2.1 Projector-Based System
For the projector-based system introduced in this section, the backlight and the first modulator were combined into a single DLP projector. The three main components of projector-based system were the projector, diffuser, and the LC panel, as shown in Fig. 3-1 (a) and (b). Using these components, each image from the projector-based system was the result of modulated light coming from the projector which was directly onto the rear of the LC panel. The projector in this platform is an Optoma DLP EP772 digital mirror projector and native resolution of this projector is XGA. The LCD we used in this experiment is 19” WXGA+ color LCD made by ASUS (ASUS VW193D).The LC panel has been separated from the backlight and all of the optical layers behind the LCD to create a transmissive image modulator.All the components were firmly fixed to the holder with appropriate alignment mechanisms to create a close matching of the projector and LC panel.
(a)
(b)
Fig. 3-1 (a) The schematic diagram of the projector-based system which are composed of a projector, a diffuser and LC panel; (b) the photograph of the practical projector-based implementation.
However, it is hard to create a close matching of the projector and LC panel. Even in the same resolution, a perfect match is impractical as alignment at the sub-pixel is hard to achieve and almost impossible to maintain. Therefore, adjust the image size before sending to projector and LC panel is necessary. This process is described in Fig. 3-2. Assume the resolution of the image we want to display is WXGA+, first, resize the calculated backlight image to XGA and send to the projector. Second, adjust the projector until the width of the projected light equals the width of the LC panel. The resolution of the projected light is now 1440x1080 pixels, and then the redundant part will be clipped to match the WXGA+ resolution.
Fig. 3-2 Process of adjusting image size for the alignment.
The maximum luminance of the projector-based system was measured when both projector and LC panel were driven by RGB digital value equals 255, on the other hand, the minimum luminance was measured when projector and LC panel with RGB digital value equal 0. The maximum and minimum luminances were 443 cd/m2 and 0.02 cd/m2, respectively, which provide the contrast ratio over 20,000:1.
3.3 Color Management
The reason algorithm based on the digital RGB value are not suitable for the dual-modulation HDR display devices will be described in this section.
The LCD which is the main component in dual-modulation HDR system is usually driven by the computer. However, the characteristic of the LCD, such as the tone reproduction curve, will be different if it is driven by different computers.
According to the algorithm introduced in chapter 2.2.3, the (cv/255)γ
can be regarded as the transmittance of the display. The output luminance will be obtained after backlight luminance multiply by transmittance. This algorithm only works in well calibrated LCD or CRT. For the dual-modulation HDR system built from off-the-shelf components, the algorithm becomes unworkable. We take a measurement to observe this issue. The testing LCD was driven by two different computers, and the brightness and contrast ratio controls of the LCD were set to same value. The measurements made were red, green, and blue with every fourth digital count. Gamma value was set to 2.2 because it is being applied commonly in LCD. All images from the LCD were displayed for about five seconds prior to measurement, sufficient time for both the LCD and measurement device to stabilize at the given setting. The results are shown in Fig. 3-3(a) and (b).
(a)
(b)
As the results shows, the LCD driven by different computers has different characteristics and all the reproduction curves are deviate from the ideal curves. Above a digital count of 230 driven by computer b, the detail of the image has been clipped, especially for blue channel. Since the LCD is based on red, green, and blue channels color rendering approach, the estimation of the luminance of the backlight and compensated LC signal will be failed. Furthermore, color shift for the image may occur because same compensated factor was applied to non-identical reproduction curves. For this reason, we proposed a modified algorithm for dual-modulation HDR system to provide more accurate estimation of luminance and color.
The proposed algorithm combines the concept of original algorithm of HDR-LCD and the colorimetric characterization model [12]. The colorimetric characterization model is to provide consistent communication of colors between imaging devices. The procedure is done by mapping the device dependent color space into a device independent space such as absolute tristimulus X, Y, and Z, where Y represents the luminance of the display. Contrary to the original algorithms, the computation of the proposed algorithm is based on the tristimulus values.
3.3.1 Colorimetric Characterization Model
The characterization of a display forms the foundation of a mapping from device digital coordinates to colorimetry. It is often to define a relationship between the CIE measurement for a color and its corresponding display device coordinate through a 3-by-3 matrix:
pixel r,max k g,max k b,max k pixel k pixel r,max k g,max k b,max k pixel k pixel r,max k g,max k b,max k pixel k
X X X X X X X R X Y = Y Y Y Y Y Y G Y Z Z Z Z Z Z Z B Z ⎡ ⎤ ⎡ − − − ⎤ ⎡ ⎤ ⎡ ⎤ ⎢ ⎥ ⎢ − − − ⎥ ⎢ ⎥ ⎢ ⎥+ ⎢ ⎥ ⎢ ⎥ ⎢ ⎥ ⎢ ⎥ ⎢ ⎥ ⎢ − − − ⎥ ⎢ ⎥ ⎢ ⎥⎣ ⎦ ⎣ ⎦ ⎣ ⎦ ⎣ ⎦ (3-1)
The 3-by-3 matrix is use for scalar rotation, completing the transformation to tristimulus space. If the relationship between the display device and the CIE space is constant, the values of the coefficients in 3-by-3 matrix are constant for all combinations of display device coordinates, and can be found by using three known samples and solving three simultaneous equations. However, the relationship is not constant in most case; the precise values of M will be different for each pair of display device coordinates and corresponding CIE values.
The R, G, and B LUT of the display were constructed by luminance of every fourth digital count divided by the maximum luminance of each channel and some interpolation scheme to fill in the missing values, as defined in Eq. (3-2). The subscript “k” indicates that dark correction has been applied, that is, the tristimulus values with the digital signal counts of all channels set to zero are taken into account.
g b r
r.max g.max b.max
L L
L
R= G= B=
L L L (3-2)
By using this model, more precise estimation of luminance and chromaticity coordinates can be achieved. The luminance and chromaticity coordinates of the LCD and corresponding input RGB digital value can be obtained by usage of Eq. (3-1). The proposed algorithm combines with this model and concept of the HDRD will be described in next section.
3.4 The Proposed Algorithm
3.4.1 Algorithm Structure
simulate the HDR-LCD. In order to estimate accurate luminance and color, the colorimetric characterization model is introduced. Therefore, the structure of the algorithm is based on HDRD algorithm and process of the colorimetric characterization model. The structure is described in Fig. 3-4.
Fig. 3-4 The structure of proposed algorithm.
The structure of the algorithm is similar to the algorithm of HDR-LCD due to the implementation in the HDR-LCD system. Two images will be generated to represent the backlight distribution and compensated LC signal. The difference between the proposed algorithm and original algorithm is that the main computation of the proposed algorithm is operated in tristimulus domain.
The structure is composed of two main parts, backlight and LC images. The backlight image is a low frequency layer which shows the luminance distribution of
input images. The LC images correspond to the detail and color of the input image. The computation of the backlight images and corresponding LC images will be presented in detail in next few sections.
3.4.2 Backlight Calculation
The simulated backlight calculation in our system includes seven steps, as shown in Fig. 3-5.
Fig. 3-5 Steps of simulated backlight calculation algorithm.
The backlight signal of each backlight block is calculated according to the maximum value among the dr, dg, and db sub-pixel values of correspondent image blocks. This step avoids saturation and clipping in pixel compensation, since the backlight always provides the desired luminance. The calculation formula is shown as follow:
signal (m,n) input (m,n)
BL =max dr,dg,db⎡⎣ ( , )i j ⎤⎦ (3-3)
where BLsignal(m,n) is the simulated backlight signal of the mth-row and nth-column
block. In Step 3, various LSFs can be obtained by sending adequate signals to the projector. This step can create different LSFs easily and the performance with different LSFs can be investigated. Step 4 shows the prediction of the luminance of the simulated backlight. This step involves a spatial convolution of backlight signal with the set LSF, as presented in Eq. (3-4).
dimming signal
BL =BL ⊗LSF (3-4)
For projector-based system, the image from the projector represents luminance distribution, so the images projected from projector were grayscale images. Finally, we build a LUT in order to map the luminance value into digital value.
3.4.3 LC Signal Calculation
The dual-modulation HDR system is capable of producing the same output luminance as the full-on backlight if it is driven with different data. Thus, the backlight dimming can be compensated by image processing. The basic concept is based on Eq. (2-2).
The compensated LC signal computation is divided into five parts, as shown in Fig. 3-6. Before computation, the luminance of the full backlight should be established in advanced by measurement. In step 1, a compensated factor C(i,j) is obtained for each pixel. The compensated factor is used to control how much each pixel should be enhanced to compensate for the brightness. C(i,j) is determined by the full-on luminance and dimming luminance on the pixel position.
Fig. 3-6 Diagram of pixel compensation algorithm.
The compensated factor is calculated as follow: full-on dimming BL C( , )= BL ( , ) i j i j (3-5)
Next, the luminance and chromaticity coordinates of the input image, denoted as Linput
and (x,y)input, were calculated after applying characterization model. The luminance of
the input image is enhanced by the compensated factor as follow:
Lenhenced =C i j( , ) L⋅ input( , )i j (3-6)
A change in backlight is compensated by increasing luminance of the input image. In step 2 the chromaticity coordinates for each pixel of the input image is also introduced to create new tristimulus values. Finally, apply the inverse characterization model to convert the tristimulus values to digital value for driving LC panel.
3.5 Summary
The algorithm for dual-modulation HDR system and corresponding experimental setup is described in this chapter. The algorithm comprises the advantage of color management for LCD and HDRD algorithm. Local backlight dimming, pixel compensation, and accurate color rendering can be achieved by using this modified algorithm for dual-modulation HDR system. In the next chapter, the algorithm will be verified.
Chapter 4
Experimental Results and Discussions
4.1 Introduction
The concept of proposed algorithm has been introduced in Chapter 3. The simulation and experimental results of dual-modulation HDR system will be shown in this chapter.
The projector-based system can be functioned as two kinds of displays. In full-on mode, the projector always displays a white image to represent the full-on backlight distribution; this kind of dual-modulation system can be regarded as a conventional LCD. In dimming mode, the projector and front panel display the images which are generated by the proposed algorithm; this approach represents a pseudo HDR-LCD.
The proposed algorithm aims at two points: first, provide accurate color reproduction; second, maintain the luminance after dimmable backlight is introduced. In order to prove the proposed algorithm can provide the setting luminance and chromaticity, the luminance and chromaticity of the output images will be compared in these two modes.
4.2 Instrument
The measurement of luminance and chromaticity was taken by CS-100 chroma meter. CS-100 measures the luminance and color of LCDs and is capable of measuring luminance as low as 0.01 cd/m2. All images from the projector and LC panels were displayed for about five seconds prior to measurement, sufficient time for
both the LC panel and measurement device to stabilize at the given setting.
4.3 Evaluation Indices
Since the LC panel is characterized in full-on mode, the tristimulus values of the output images from full-on mode will be considered as reference data. After applying the proposed algorithm, the measured tristimulus values from dimming mode should meet the setting luminance and chromaticity.
In order to verify that the tristimulus values of output image from projector-based system whether reach the setting luminance and chromaticity (Fig. 3-6 step 3) after applying the proposed algorithm, three indices, luminance, chromaticity, and contrast ratio were utilized in this thesis. The luminance difference between the two modes should be lower than 1% of reference luminance, as defined in Eq. (4-1).
(4-1) The chromaticity difference should be lower than 0.005.
4.4 Maximum Compensated Factor
Before verifying the proposed algorithm, the maximum compensated factor should be selected. The Fig. 4-1 shows the example of input image and corresponding backlight and compensated image.
(a) (b) (c) ref Dimming ref L -L 0.01 L <
Fig. 4-1 (a) Input image (b) corresponding backlight distribution (c) corresponding compensated LC image.
The result shows that the compensated LC image has obvious boundary in order to compensate the dramatically reduced backlight luminance. The maximum compensated factor (MCF) is 1865 in the regions. This value even exceeds the maximum luminance of the projector-based system. In order to eliminate the undesired boundary, the MCF should be limited.
The compensated LC image with different MCF is shown in Fig. 4-2. The undesired boundary disappeared when MCF is below 4. Therefore, the MCF is set to 3 in our algorithm for better visual perception.
Fig. 4-2 The compensated LC images with different MCF. Top : full size of the image. Bottom : zoom in for red rectangle area.
4.5 Experimental Results
In the measurement of luminance and chromaticity, several test images were used to compare the system performance. Because this step only considered whether the proposed algorithm functioned well in dimming mode, the 0D dimming method was therefore introduced to simplify the measurement. Two modes of projector-based system will be compared, as shown in Fig. 4-3.
Fig. 4-3 Two modes of projector-based system to verify the proposed algorithm: (a) full-on mode (b) dimming mode.
In full-on mode, the projector was set to project the white image to represent full-on backlight distribution and front panel displayed the test images. On the other hand, the projector displayed the dimming backlight image, while the front panel displayed the compensated LC image in dimming mode.
4.5.1 Luminance
In the measurement of system luminance, gray images with every fourth digital count were measured. The result is presented in Fig. 4-4.
Fig. 4-4 (a)The luminance curve of dimming mode and full-on mode (b) zoom in for
The result shows that the two curves are very close from middle to high gray level, the luminance difference between the two modes is 0.3 to 1.09 % of the reference luminance. The average difference for these images is 0.58 % of reference luminance. After applying the proposed algorithm, the dimming mode has the ability to provide the setting luminance value. But for the low gray levels, the minimum luminance of dimming mode is lower than the full-on mode. Because the MCF is now limited to 3 which is lower than the original MCF for these dark images. The minimum luminance of the dimming mode is down to 0.02 cd/m2, while the minimum luminance of full-on mode is 0.91 cd/m2.
4.5.2 Chromaticity
In the measurement of chromaticity, a set of 70 color patches containing gray levels, primary and mixed colors were used to test the chromaticity. The measured tristimulus valuesfrom full-on mode will be considered as the reference. The absolute color differences (Δx,Δy) compared with the full-on mode are shown in Tab. 4-1.
Tab. 4-1 Absolute color difference between dimming mode and reference data.
The results shows that the (Δx,Δy) falling at the range from 0.001 to 0.006. For
these 70 test images, the average Δx and Δy are 0.0018 and 0.0015 respectively.
According to the results mentioned in previous and this section, the projector-based system can provide setting luminance and chromaticity after applying the proposed algorithm. The step 3 in Fig. 3-6 functions well and is suitable for projector-based system.
4.5.3 Contrast Ratio
To further verify the proposed algorithm, the contrast ratio of test image was measured. In the comparison of the contrast ratio, three representative test images in Fig. 4-5 were chosen to be simulated and measured.
(a) moon (b) heart
(c) sunset Fig. 4-5 Three representative images: (a) moon (b) heart (c) sunset.
The backlight image from the projector is divided into 8x5 local dimming backlight regions. A two-dimensional Gaussian distribution was used as a typical representation of the free-spreading LSF, because it is being applied commonly in the HDR-LCD, as shown in Fig. 4-6.
Unlike the backlight setting in previous section, the local dimming is adopted to provide high contrast ratio. The simulated backlight distribution and corresponding compensated LC image are shown as follow:
Fig. 4-7 Simulated images after applying the proposed algorithm (a) Test image (b) simulated backlight distribution (c) compensated LC image.
(a) Test image (b) B/L distribution (c) Compensated
For backlight part, the backlight distribution varied with the image content. For LC image part, the original signal of the test image has been increased in order to compensate the decreased backlight luminance (see Fig. 4-8). The color information is also reproduced accurately. The undesired boundary did not exist in these LC compensated image.
(b) (c)
Fig. 4-8 Comparison of original LC signal and compensated LC signal (a) original signal of test image (b) dotted area of original signal (c) dotted area of compensated LC signal
The contrast ratio will be compared between full-on mode and dimming mode. The photographs of system output images and corresponding maximum and minimum luminance are presented in Fig. 4-9.
(a) Max L: 279 nits, Min L: 1.05 nits
(a) Max L: 384 nits, Min L: 0.95 nits
(a) Max L: 379 nits, Min L: 0.95 nits
(b) Max L: 377 nits, Min L: 0.18 nits
Fig. 4-9 Photographs of projector-based system and corresponding maximum and minimum luminance (a) full-on mode and (b) dimming mode.
The result is shown in Tab. 4-2 and Fig. 4-10. For dimming mode, the contrast ratio of the test image, heart, can be increased to 19050:1; while the full-on mode can only achieve the contrast ratio of 404:1.
Tab. 4-2 Contrast ratio of Moon, Heart and Sunset by using full-on and dimming mode.
4.6 Summary
The indices, luminance, chromaticity, and contrast ratio were used in evaluating the performance before and after applying the proposed algorithm. Several test images were chosen for the experiments.
According to the experimental results, the projector-based system can act as a HDR-LCD after applying the proposed algorithm. The luminance for middle to bright image can be maintained, and the minimum luminance is much lower than the full-on mode.The chromaticity can be reproduced accurately. Compare with the full-on mode, the dimming mode can provide much higher contrast ratio (around 20000:1). The proposed algorithm provides an alternative method for dual-modulation HDR system.
From the results mentioned above, the projector-based system can be operated as a HDR-LCD successfully. Hence, the projector-based system can be considered as a testing platform to compare the performance of the HDR-LCD with various LSFs.
Chapter 5
Conclusions and Future Works
5.1 Conclusions
For next-generation LCD TV backlights, dynamic backlights with local dimming will become the keys for high contrast ratio images, low power consumption. By controlling both the LCD panel and its backlight unit adequately according to the input image signal, the problem of the light leakage of liquid crystals in LCD displays can be solved.
For the HDR-LCD, the LSF and number of backlight segments have the strong impact on system performance. It is not efficient for a researcher to design various backlight control circuit and functional light guide to investigate the system performance. On the contrary, the dual-modulation HDR system provides a convenient platform to create different kinds of backlight distribution. Backlight dimming and backlight distribution built by different LSFs can be easily obtained by sending adequate signals to the display. However, for most LCDs, the tone reproduction curves of red, green and blue channel are not identical. This issue has serious influences on estimation the accurate luminance and color information.
In this research, a modified algorithm has been proposed and tested in projector-based system. By using the colorimetric characterization model, the digital value will be transformed to tristimulus values. All the computations are operated in tristimulus domain to provide more accurate driving signals.
of the projector-based system. After applying the proposed algorithm, the maximum luminance can be maintained and suppress the light leakage. The chromaticity can be reproduced accurately, and the contrast ratio is also improved rapidly. The proposed algorithm offers another method to drive the dual-modulation HDR system, especially for the system which consists of a non-calibrated LCD. After applying the proposed algorithm, the projector-based system can be functioned as the testing platform to compare the performance of the HDR-LCD with various LSFs
5.2 Future Works
Since the HDR-LCD was reported, the improvement on system performance has made a rapid progress. Among the technical considerations, LSF is a key parameter to correlate the optomechanical setup with the signal process of the HDR LCD. The former is resorted to the optical design of local-dimming backlight, while the latter is the signal levels of both light source and the corresponding LC panel. Although LSF is an important issue for HDR-LCD, there were few papers addressing on the influence of illumination profile upon the image performance, and thus keep the most efficient LSF as a challenging topic. Free-spreading LSF is the illuminous distribution on the LC panel from the light source, which is composed of a single or group of light emitting diode (LED) units. Due to the various optomechanical layouts, the illuminous patterns exhibit a great discrepancy and highly relevant to the backlighting system. Different LSFs would lead to several impacts on the system performance. First, accuracy of compensated LC signals will be reduced if the prediction of illumination distribution, obtained by the convolution (or deconvolution) computation, is incorrect while LSF is not a spatially shift-invariant system. Second, computational time and processing algorithm is strongly affected by the backlight uniformity. As
shown in Fig. 5-1, general Gaussian light spread pattern would result in the more complex processing algorithm by compensated LC signals.
(a)
(b)
Fig. 5-1 The intensity distributions of the Gaussian LSF of (a) single light source and (b) the overall panel area, which is computed using convolution calculation with the Gaussian LSF as the impulse response function. The overall intensity distribution is, in general, decreased from the center toward the panel edges.
Fortunately, aforementioned concerns can be overcome by an adequate LSF. In principle, an ideal uniformly square LSF would be the best choice; however, it is hard
to be realized due to the practical limitations. Therefore, our group proposed a isolated square super-Gaussian LSF to approach the ideal one [13]. The formulated super-Gaussian LSF will be produced by a light guide unit consisting of three main components: a side-emitting LED, a quadratic light guide, and a concentric prism sheet, as shown in Fig. 5-2.
(a) (b)
Fig. 5-2 (a) Schematic diagram of the optical component consists of a square light guide at the bottom, a side-emitting LED, and a concentric prism film on the top; (b) The central cross-sections of luminance distribution for single light guide.
Some issues should be concerned before fabricating the functional light guide. The fall of the profile margin deviates from an ideal square shape due to imperfect collimating and stray light. Such redundant light beyond the limited space led to grid lines while LGs were pieced together to illuminates the whole display area. Therefore, the projector-based system offers a convenient platform to find the optimized parameter to eliminate the grid visibility. After fabricating the light guide unit, the real HDR-LCD with isolated square super-Gaussian LSF will be constructed and investigate the performance.
Reference
[1] H. Seetzen, et al., “High Dynamic Range Display System,” Proc. of ACM SIGGRAPH, 23(3), pp. 760-768, 2004.
[2] F. C. Lin, et al., “Inverse of Mapping Function (IMF) Method for Image Quality Enhancement of High Dynamic Range LCD TVs,” SID07 Digest pp. 1343-1346, 2007.
[3] S. Swinkels, et al., “Effect of Backlight Segmentation on Perceived Image Quality for HDR Display,” IDW06, pp. 1451-1454, 2006.
[4] Y.K. Cheng, et al., “Analyses of Point Spread Function in High Dynamic Range Display System,” Optics and Photonics Taiwan 2005, Serial No. G-SA-X 4-3, 2005.
[5] N. Chang, et al., “DLS: Dynamic Backlight Luminance Scalingd of Liquid Crystal Display”, IEEE Trans. , Very Large Scale Integration Systems , Vol. 12, No.8, pp.837-846, 2004.
[6] W-C. Cheng, et al., “Power Minimization in a Backlit TFTLCD by Concurrent Brightness and Contrast Scaling”, IEEE Trans, Consumer Electronics, Vol. 50, No. 1, pp. 25-32, 2004.
[7] Ali Iranli, et al., “HEBS: Histogram Equalization for Backlight Scaling”, IEEE, 2005.
[8] H. Seetzen, et. al, “A High Dynamic Range Display Using Low and High Resolution Modulators”, SID03 Digest, pp. 1450-1453, 2003.
[9] Debevec, P. E., et. al, “Recovering High Dynamic Range Radiance Maps from Photographs”, Proc. of SIGGRAPH 97, ACM SIGGRAPH, 1997.
[10] L. Kerofsky, et al., “Brightness Preservation for LCD Backlight Reduction”, SID06 Digest, pp. 1242-1245, 2006.
[11] H. Seetzen, et al., “Benefits of Dual-Modulation High Dynamic Range Display Devices”, IDW06, pp. 2001-2004, 2006.
[12] Phil Green, et al., Colour Engineering, Chapter 7.
[13] Y. H. Lu, et al., “A Localized Pattern Approach for High-Dynamic-Range Display,” SID07 Digest, pp. 449-452, 2007.