ISSN 1450-2887 Issue 32 (2009) © EuroJournals Publishing, Inc. 2009 http://www.eurojournals.com/finance.htm
Board Characteristics and Overvalued
Equity: Evidence from Taiwan
Min-Jeng Shiue1
Department of Accountancy, National Taipei University, Taiwan (R.O.C.)
E-mail: [email protected]
Tel: +886-2-25024654 Ext. 18412; Fax: +886-2-25060730
Chan-Jane Lin
Department of Accounting, National Taiwan University, Taiwan (R.O.C.)
E-mail: [email protected]
Tel: +886-2-33661115; Fax: +886-2-23633640
Yi-Pei Liu
Department of Accounting, Providence University, Taiwan (R.O.C.)
E-mail: [email protected]
Tel: +886-4-26328001 ext. 13222; Fax: +886-4-26324661
Abstract
This study aims to examine whether seasoned offerings issued in Taiwan are overvalued. It also tries to test the proposition by Jensen (2005) that the solution of the agency costs of overvalued equity lies in the board of directors and the governance system. Using a sample of Taiwanese listed companies from 1991 to 2002, the empirical results show that equity overvaluation did occur upon seasonal offerings. In addition, we also find that corporate governance system, especially if the board of directors exhibits independence and competence, is negatively related to the overvalued equity. The findings provide empirical support for Jensen’s (2005) conjecture. That is, the solution to overvalued problems lies in stronger corporate governance. To policy makers and practitioners, the findings indicate that a more independent and competent board of directors can help depress the occurrence of overvalued equity.
Keywords: Directors Independence, Directors Competence, Overvalued Equity,
Corporate Governance, Seasoned Equity Offerings
JEL Classification Codes: M41; G30; C20
1. Introduction
A number of accounting scandals and abuses have occurred worldwide in recent years, such as Enron and WorldCom in America, and Procomp, Infodisc, and Summit in Taiwan. Most of these cases dramatically caused the destruction of equity value to the company. These effects all further result in great losses to the investors and the society. Jensen (2004, 2005) indicated the effects of the above
1 The first author acknowledges the financial support from the National Science Council of Taiwan, Republic of China.
tremendous loss as the agency costs of the overvalued equity. He also showed that these costs have reached an enormous figure and that more scandals and fraud charges have not yet to be announced. Under the agency theory of overvalued equity, managers of overvalued firms are likely to manage their firms’ earnings upwards to enhance the overvaluation. Kothari et al. (2006) provided empirical evidence which supported this argument. Jensen (2005) asserted that the solution to these overvalued problems lies in the board of directors and the governance systems, but not the market for corporate control, such as takeovers, leveraged buyouts, etc.
Fama (1980) and Fama and Jensen (1983) also pointed out that the board of directors is an important inner management mechanism of the company. In addition, Gompers et al. (2003) and Drobetz et al. (2004) indicated that those investing in firms with stronger governance systems or a well functioning board will earn higher returns. After Enron, the governance systems of companies, especially the systems of the board of directors, have drawn great attention from both academic and practical fields. For example, in Taiwan, to protect the broad range of investors, Securities Exchange Commissions entrusts the Taiwan Stock Exchange Corporation and GreTai Securities Market to make “Corporate Governance Best-Practice Principles for TSEC/GTSM Listed Companies”, which was promulgated on October 4, 2002. The best practice principles include those that explain how to strengthen the function of the board of directors and the supervisors.
There is a well-documented negative announcement effect on firms issuing seasoned equity. One of the major explanations is the information asymmetry between managers and the market. Myers and Majluf (1984) indicated that managers issue equity only when they believe it is being overvalued with respect to their private information. Prior research also presented evidence of poor stock performance over a period of three to five years following seasoned equity offerings (Loughran and Riter, 1995; Spies and Affleck-Graves, 1995; Ahn and Shivdasani, 1999). Based on the comparison analysis of the equity price before and after the equity offering, Jindra (2000) found that firms time their seasoned equity issues when equity is overvalued with respect to managers’ private information, which is named as timing hypothesis. Loughran and Riter (1997) also found that the operating performance of issuing firms shows substantial improvement prior to the offering, but then deteriorates.
Are the new equities issued in Taiwan overvalued? Take the Procomp case, a recent well- known financial scandal in Taiwan, as an example. This company had maintained a very high cash equivalent, but continuously raised funds through seasonal equity issues and convertible bonds from both domestic and international capital markets, which amounted to a total of 11 billion NT dollars since it was listed in 1999. On June 24th, 2004, after being a full-delivery stock for just seven days, Procomp was delisted from the Taiwan Stock Exchange and its stock price experienced an enormous drop of 42.6% within such a short period. Prior studies showed that investors may not see through the real economic situation of the issuers who tend to manage their earnings upward. Shiah-Hou (2000) found that seasoned equity issuers in Taiwan have lower long-term operating performance relative to matched firms. Moreover, she found that issuers manage the short-term accruals to increase book value of firms at the offering year. Chin et al. (2000), using listed firms in Taiwan as sample, also pointed out that the discretionary accruals increase by 0.46 percent of the total assets in the year before issuing the new equities. The above findings seem to indicate new equities offerings in Taiwan might have been overvalued.
The purpose of this study is to examine if Taiwanese companies are overvalued prior to their seasoned equity offering. Another focus of this study is to investigate whether the governance system of the board of directors can effectively alleviate the phenomenon of overvalued equity as predicted by Jensen (2005). Our analyses reveal that the phenomenon of overvalued equity occurs upon seasonal equity offerings made by Taiwanese listed companies. We also find that corporate governance systems, as proxied by the independence and competence of the board of directors, can help depress the occurrence of overvalued equity. The empirical results are consistent with the conjecture proposed by Jensen (2005).
This article proceeds as follows. Section 2 discusses how the board characteristics are related to overvalued equity and develops our hypotheses. Section 3 describes the sample and research method. The empirical results are presented in Section 4. Section 5 concludes the paper.
2. Literature Review and Hypotheses Development
2.1. Seasoned equity offerings and overvalued equityJindra (2000) showed that firms issue equity when they are overvalued compared to the control sample of non-issuing firms. Plenty of research also provided the evidence of poor performance of issuing firms after new seasoned equities (Loughran and Riter, 1997; Shiah-Hou, 2000). Moreover, it is not uncommon that IPOs are systematically overvalued compared with their fundamentals (Moeller et al., 2003; Shiah-Hou, 1997). Moeller et al. (2003) provided dramatic evidence of the magnitude of agency costs of overvalued equity in the recent period. Their research findings showed that in the three-day period surrounding the announcement of acquisitions in the period 1998-2001, acquiring firms nearly lost a total of $240 billion compared to a total loss of $4.2 billion in all of the 1980s. Jensen (2004, 2005) pointed out that the above overvalued equities are the agency costs. As Jensen (2005) defined that equity is overvalued when the stock price of a company exceeds its underlying value. Although the market for corporate control mechanisms such as hostile takeovers, leveraged buyouts, and management buyouts, might have mitigated many problems of undervalued equity in the 1970s and 1980s, it might not be an appropriate measure for the problem of overvalued equity. According to Jensen (2005), the main and quite possibly only way to deal with the agency problem caused by overvalued equity is to rely on a well-organized operating mechanism and board of directors.
2.2. Corporate governance and overvalued equity
There has been an abundance of research on the board of the directors’ mechanism of a company and firm’s stock price or profits. Gompers et al. (2003) has done research on the relation between the operation of a company and its equity price. Taking 1500 American listed firms as sample, they obtained 24 governance variables in these companies and further transformed these variables into a governance index to test whether there was a positive relationship between the index and the stock price. They showed that an investment strategy that bought firms in the lowest deciles of the index (strongest shareholder rights) and sold firms in the highest deciles of the index (weakest shareholder rights) would have earned abnormal returns of 8.5 percent per year during the sample period. Besides, their findings also showed that firms with stronger shareholder rights had higher firm value, higher profits, higher sales growth, lower capital expenditures, and made fewer corporate acquisitions. Using German listed companies as sample, Drobetz et al. (2004) had similar findings. They found a positive correlation between the board of directors’ mechanism of the company and firm’s expected stock returns. Drobetz et al. (2004) set up an investment portfolio, buying the stock of companies with a better operating mechanism and selling the companies with weaker operating mechanism, and found that a 12% abnormal return can be obtained.
Fama (1980) and Fama and Jensen (1983) pointed out the firm’s governance functions, such as setting up the board of directors, are very important. The characteristics of the board of directors’ include board size (BSIZE), independence (INDEP) and competence (COMP). With regard to board size (BSIZE), it is an important factor in determining whether the internal governance mechanism of a company is successful or not. However, past research has not yet reached a consensus about the extent to which the structure of the board can affect firm’s operating mechanism. Jensen (1993) pointed out that an over-sized board is prone to influence the CEO; thus, it may not function well. Beasley (1996) suggested that companies with larger board are more likely to have financial scandals. Shiue et al. (2004) showed that companies with larger board tend to restate their financial reports. On the contrary, Changanti et al. (1985) suggested that a larger board can include more professional members with different backgrounds, thereby providing a more versatile and valuable service. They found that firms
with larger board would be less likely to experience business failures. In sum, we propose that the board size is correlated with overvaluation of the equity, with no sign predicted. We therefore state the hypothesis as follows:
H1: The number of board members is correlated with overvaluation of the equity.
With regard to independence (INDEP), Taiwan’s Corporate Governance Best-Practice
Principles has clear guidance to the establishment of independent directors. Prior research pointed out
that the independence of board members are able to increase operating efficiency and enhance firm’s performanc (Brickley et al., 1994; Byrd and Hickman, 1992). Besides, Dechow et al., (1996) discovered that the percentage of outside board members is negatively associated with the likelihood of accounting scandals. Based on the above research findings, it is suggested that the independence of the board can help control the phenomenon of overvalued equities. Therefore, the proportion of independent directors is expected to be negatively correlated with the possibility of overvaluation of the equity. We state the hypothesis as follows:
H2: The percentage of independent directors is negatively correlated with overvaluation of the equity.
With regard to competence (COMP), whether or not the monitoring mechanism of the board can run well depends on the competence of the members. As indicated in Taiwan Corporate
Governance Best-Practice Principles, board members should normally possess certain knowledge,
skills, and the capacity required to perform their duties well. It is suggested that independent directors have expertise of management, accounting, finance or law. Beasley (1996) found that there is a negative correlation between the term of service of the independent board members and the possibility of financial report fraudulence. Shiue et al. (2004) used the tenure of the board members and that of independent directors to proxy their competence, and found a negative correlation between tenure and probability of restatements in Taiwan. Based on the above analyses, it is conjectured that competence of the independent board members can help control the phenomenon of overvalued equities. We therefore state the hypothesis as follows:
H3: The percentage of average tenure of independent directors is negatively correlated with overvaluation of the equity.
3. Methodology
3.1. SampleThis study collects the data of secondary equity offerings traded in the Taiwan Stock Exchange Corporation (hereinafter referred as TSEC) from September 1995 to June 2002. We select four quarters before SEOs and 12 quarters after SEOs to test our hypotheses. We drop the finance and insurance industries due to their unique nature of financial reporting. This study adopts one-to-one paired design proposed by Beaver (1966), Altman (1968) as well as Tam and Kiang (1992). Matched sample firms are selected based on year, industry and total assets. The final sample includes 122 firms, that is 61 companies with seasoned equity offerings (SEOs sample) and 61 matched firms.
Research data for this study is collected from various sources, including: (1) Financial database of listed companies provided by Taiwan Economic Journal (TEJ), (2) Website of Financial Supervisory Commission. (http://www.fscey.gov.tw/), (3) Guidelines of Securities Statistics provided by Securities and Futures Bureau of Financial Supervisory Commission and (4) Prospectus and financial reporting of listed firms.
3.2. Empirical model and definition of variables
The price earnings (P/E) model is one of the most popular and traditional equity valuation models (see Kaplan and Ruback, 1995; Kim and Ritter, 1999). Penman and Sougiannis (1998) provided evidence that valuation techniques based on earnings yield lower valuation error than those based on dividends or cash flows. In a comparison of the predictability of different valuation models, including cash flow
model, price earnings model and residual income model, Liu and Chuang (2003) found that price earnings model is the first choice for Taiwanese firms. The estimation process of P/E model is demonstrated as follows.
To control for industry effect, this study uses the median value of the price earnings ratio in a specific industry as the expected price earnings ratio (MEDPE). Expected equity values (EXOE) are the product of next quarter’s expected earnings per share (EPS) and MEDPE. Earnings per share are earnings before extraordinary items divided by weighted average outstanding shares. Next quarters’ earnings are analysts’ first forecast earnings, and overvalued value equity is the difference between actual price per share and expected equity value. In sum, overvaluation of the equity (OVE) is calculated as:
OVEt = Pt— EPSt+1 × MEDPEt (1)
where OVEt is the overvaluation of the equity at the end of time t; Pt is the stock price at the end of time t; EPSt+1 and MEDPEt are expected quarterly earnings per share and the median value of industry price earnings ratio, respectively.
This study uses board characteristics to capture the function of the board mechanism. Testing variables include board size (BSIZE), independence (INDEP) and competence (COMP). The size of the board, the percentage of independent directors and the average tenure of independent directors are used to proxy for the testing variables, respectively. Four additional variables are added in this study to control for the influence of factors that may affect the overvaluation of the equity. BIG4 and INSTITU are the control variables used to control for the audit quality and information transparency. If sample firm is audited by one of the Big-4 accounting firms, BIG4 is equal to 1 and 0, otherwise. Company transparency is measured as the proportion of the stock shares owned by foreign investors or institutional investors. Another two control variables are TOBINQ and BVPS. The former refers to Tobin's Q, and the latter refers to the book value per share at the end of the year. These two variables aim at controlling the growth potential and other firm characteristics (D'Mello and Shroff, 2000). The coefficients of BIG4 and INSTITU are expected to be negative. That is, higher quality auditors and institutional investors are employed as bonding mechanisms to alleviate the agency problems of OVE of SEOs. Based on the above analyses, our empirical model is as follows:
OVEt=a0+a1BSIZEt+a2INDEPt+a3COMPt+a4BIG4t
+a5INSTITUt+a6TOBINQt+a7BVPSt+et (2)
The regression equation are run for SEO’s sample with OVE greater than 0 and those with OVE less than or equal to 0. It is expected that the coefficients of INDEP and COMP (a2, and a3) are
negative, but the coefficient of BSIZE (α1) may be positive or negative (an unexpected sign) in the
equation with OVE over 0; that is, the function of the board of directors can help companies alleviate the agency’s problems of overvalued equities of SEOs. To yield a composite measure of the board function, this study further estimates the factor score of the above three testing variables using factor analysis and conduct the regression analysis of equation (3). The BOARD denotes the composite index of the board characteristics and its coefficient β1 is expected to be negative.
OVEt=β0+β1BOARDt+β2BIG4t+β3INSTITUt+β4TOBINQt+β5BVPt+et (3)
4. Empirical Results
4.1. Descriptive statistics
As shown in Table 1, total assets of companies with seasoned equity offerings and their matched firms are 8,304,252 (in thousands of NT dollars) and 8,749,009 (thousand), respectively. Mean values of net sales are 3,581,330 (thousand) and 3,707,918 (thousand) for SEOs and the matched firms, respectively. The debt ratios for SEOs and their matched forms are 37.94% and 34.33% of lagged total assets. On average, the profit margin as measured by net income divided by net sales is 7.52% and 7.77% for SEOs and the matched firms, respectively. In sum, Table 1 shows that there is no significant difference in size, financial structure and profitability between SEOs sample and and their matched firms.
Table 1: Size, Financial Structure and Profitability: SEOs Sample vs Matched Sample (in thousands NT dollars)
SEOs sample: Mean Matched sample: Mean Difference t-value Wilcoxon Statistics
SIZE a 8,304,252 8,749,009 -444,757 -0.25 -0.01
Net Sales 3,581,330 3,707,918 -126,588 -0.14 -0.55
Debt Ratiob 37.94% 34.33% 3.61% 1.52 -1.41
Profit marginc 7.52% 7.77% -0.25% -0.08 -0.08
Notes: (a)Total assets. (b) Debt ratio=total liabilities divided by total assets at the end of the year. (c)profit margin ratio=
net income after tax divided by net sales.
4.2. Measurement and test of overvalued equity
We perform the test of “differences of OVE within a group” (SEOs firms) and “differences of OVE between groups” (SEOs firms vs. non-SEOs firms). Table 2 reports the difference of OVE before and after SEO-within group. As shown in Table 2, the mean OVE before seasonal equity offerings is statistically significantly lower than that after seasoned equity offerings (p=0.08). However, nonparametric Wilcoxon rank-sum tests do not find the significant difference (Z=-0.37, p=0.71).
Table2: Comparison of OVE before and after SEO-within group test
Parameter statistics test (t test) Nonparametric statistics test
Before SEO After SEO Before SEO After SEO
Mean (Rank) of OVE 1.19 6.53 242.16 246.84
p-value of t test(two-tailed) p-value of Wilcoxon rank-sum test ( two-tailed)
0.08 0.71
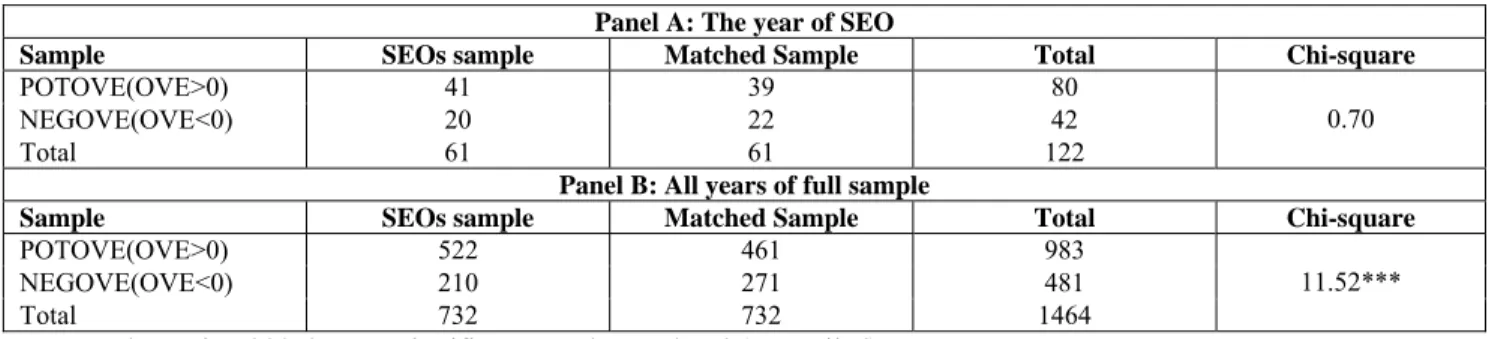
Next, we perform a between-group test for OVE differences. Panel A of Table 3 contains only SEOs sample and their matched firms in the year of SEOs, while Panel B of Table 3 investigates all firm-year data of the SEOs and their matched firms. For each SEOs sample and matched sample, we further classify those with positive OVE as POTOVE group, and those with negative OVE as NEGOVE group. We then use 2 x 2 contingency tables to test whether SEOs sample are overvalued (Chi-Square test). As shown in Panel A, more SEOs are found in POTOVE group, but in significant between two subsamples in year of SEO. As Panel B shows, it is found that the number of SEOs sample with positive OVE are more than those in matched sample, which is significant at the 1% level (Chi-Square=11.52). These findings are similar to the empirical results obtained by Jindra (2000). In sum, the above findings indicate that the SEOs’ firms in Taiwan are overvalued before they offer their new equities to the market.
Table 3: The differences of OVE between groups- 2 x 2 contingency table Panel A: The year of SEO
Sample SEOs sample Matched Sample Total Chi-square
POTOVE(OVE>0) 41 39 80
NEGOVE(OVE<0) 20 22 42
Total 61 61 122
0.70
Panel B: All years of full sample
Sample SEOs sample Matched Sample Total Chi-square
POTOVE(OVE>0) 522 461 983
NEGOVE(OVE<0) 210 271 481
Total 732 732 1464
11.52*** Note: The notion *** denotes significance at the 1% level (two-tailed).
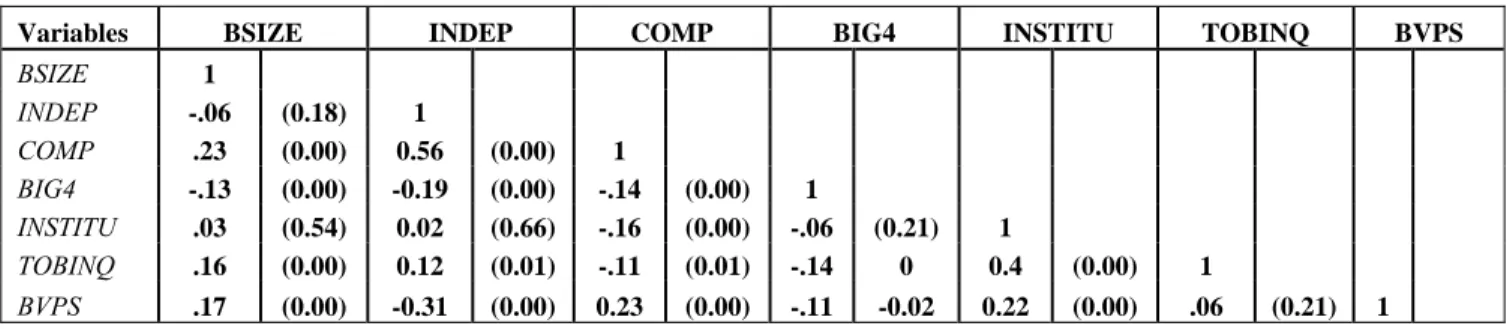
Table 4 presents the correlation matrix for all independent variables. As shown in Table 4, there is a positive and significant correlation between BSIZE and COMP. In contrast, BSIZE is negatively
correlated with INDEP but insignificant. BSIZE is negatively correlated with BIG4 but positively correlated with TOBINQ and BVPS. The correlation between INDEP and TOBINQ are positive and significant, but INDEP has significant and negative association with BIG4 and BVPS. Overall, except for the higher correlation between COMP and INDEP, most of the correlation coefficients in Table 4 are below 0.4, which implies that multicollinearity among variables may not be a severe problem.
Table 4: Correlation analyses
Variables BSIZE INDEP COMP BIG4 INSTITU TOBINQ BVPS
BSIZE 1 INDEP -.06 (0.18) 1 COMP .23 (0.00) 0.56 (0.00) 1 BIG4 -.13 (0.00) -0.19 (0.00) -.14 (0.00) 1 INSTITU .03 (0.54) 0.02 (0.66) -.16 (0.00) -.06 (0.21) 1 TOBINQ .16 (0.00) 0.12 (0.01) -.11 (0.01) -.14 0 0.4 (0.00) 1 BVPS .17 (0.00) -0.31 (0.00) 0.23 (0.00) -.11 -0.02 0.22 (0.00) .06 (0.21) 1
Notes: (1) Figures in the lower left triangle are Pearson correlation coefficients. (2) Figures in parenthesis are p-value.
4.3. The impact of a corporate governance system on overvalued equity
In Table 5 panel A, for those sample firms with positive OVE (OVE>0), both INDEP and COMP are smaller in SEOs than their matched firms (under both t test and Wilcoxon test). That is, the positive OVE sample has moderately weak corporate governance. In contrast, in panel B, this study does not find any significant difference in these variables between SEOs and their matched firms. To sum up, the result of univariate analysis moderately supports the arguments on hypothesis 2 and 3. That is, the independence and competence of the board of directors can help control the agency problem of overvalued equities in SEOs.
Table 5: Univariate test of seasoned equity sample and matched sample Panel A: OVE>0
SEOs sample (n=41) Matched sample (n=39) Variables
Mean Median S.D. Mean Median S.D. Difference t-value
Wilcoxon Statistics BSIZE 9.02 7.00 5.38 7.87 7.00 3.53 1.15 1.13 0.87 INDEP 0.34 0.33 0.26 0.46 0.45 0.26 -0.12 -1.95* -1.86* COMP 6.42 5.64 5.96 9.10 7.71 7.22 -2.68 -1.76* -1.66* BIG4 0.29 0 0.46 0.26 0.00 0.44 0.03 0.36 0.36 BVPS 28.34 27.71 7.31 22.83 22.30 6.53 5.51 3.55*** 3.60*** TOBINQ 0.75 0.62 0.46 1.00 0.81 0.77 -0.25 -1.76** -1.45 INSTITU 9.56 1.77 13.44 9.08 4.02 13.66 0.48 0.16 0.32 Panel B: OVE<0 SEOs sample (n=20) Matched sample (n=22) Variables
Mean Median S.D. Mean Median S.D. Difference t-value
Wilcoxon Statistics BSIZE 7.45 7.00 3.27 9.32 7.00 5.31 -1.87 -1.36 -1.04 INDEP 0.36 0.35 0.28 0.42 0.31 0.40 -0.06 -0.53 -0.13 COMP 6.57 6.25 5.83 20 3.75 7.45 -13.43 -0.12 -0.44 BIG4 22 0 9.32 20 0 0.36 2.00 0.19 0.19 BVPS 22 23.20 0.42 20 23.43 6.57 2.00 0.35 0.18 TOBINQ 22 0.60 6.84 20 0.75 0.30 2.00 -0.28 -1.21 INSTITU 22 3.23 0.27 20 2.64 26.37 2.00 -0.88 -0.38
Notes: The notions *, **, and *** denote significance at the 10%, 5% and 1% levels, respectively (two-tailed).
Table 6 presents the OLS regression results of SEOs sample. Major findings are similar to prior univariate analysis. In the positive OVE group, the coefficients of INDEP and COMP are negative and statistically significant at the 10% and 5% level, respectively. These findings support hypothesis 2 and
hypothesis 3, and are also consistent with the results in Beasley (1996) and Shiue et al. (2004). The evidence suggests that outside independent board members have a better understanding of corporate operations and better supervision over the financial reporting process. Therefore, they are helpful in depressing the phenomenon of overvalued equity of SEOs. However, in the negative OVE group, the coefficient of BSIZE is positively significant at the 10% level. Both of the coefficients of INDEP and
COMP are negative but not significant at any conventional level. In the pool sample of SEOs and their
matched firms, it is found that the coefficient of BSIZE is positive and significant and the coefficient of
INDEP is still negative and significant, both at the 1% level. Moreover, the coefficient of BIG4 is
negative and significant at the 5% level in positive OVE group and the full sample. It seems to suggest that audit quality also plays an important role in solving overvalued equity problem.
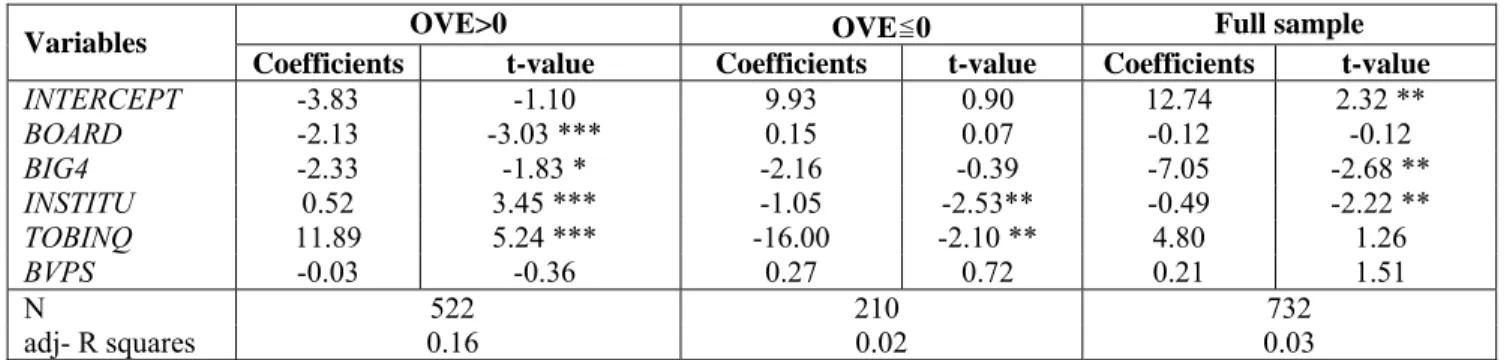
Finally, Table 7 presents the results using composite measure for governance variables. As expected, we find that the coefficient of BOARD is negative and significant (p<0.001) in positive OVE group, and findings in other control variables are similar to those in Table 6.
Table 6: Board characteristics and overvalued equity
OVE>0 OVE≦0 Full sample
Variables
Coefficients t-value Coefficients t-value Coefficients t-value
INTERCEPT 4.12 0.99 9.00 0.62 18.65 2.99 ** BSIZE -0.14 -1.05 1.72 1.68 * 0.68 3.45 *** INDEP -4.70 -1.74 * -16.13 -1.54 -14.07 -3.44 *** COMP -0.29 2.18 ** -0.02 -0.06 0.05 0.31 BIG4 -2.64 -2.07 ** -1.55 -0.28 -7.68 -2.93 ** INSTITU 0.51 3.32 *** -1.09 -2.60 ** -0.61 -2.62 ** TOBINQ 11.52 4.94 *** -15.34 -2.01 ** 5.36 1.43 BVPS -0.05 -0.52 0.23 0.61 0.22 1.56 N 522 210 732 adj- R squares 0.16 0.02 0.04
Notes: The notions *, **, and *** denote significance at the 10%, 5% and 1% levels, respectively (two-tailed). Table 7: The composite measure of the board characteristics and overvalued Equity
OVE>0 OVE≦0 Full sample
Variables
Coefficients t-value Coefficients t-value Coefficients t-value
INTERCEPT -3.83 -1.10 9.93 0.90 12.74 2.32 ** BOARD -2.13 -3.03 *** 0.15 0.07 -0.12 -0.12 BIG4 -2.33 -1.83 * -2.16 -0.39 -7.05 -2.68 ** INSTITU 0.52 3.45 *** -1.05 -2.53** -0.49 -2.22 ** TOBINQ 11.89 5.24 *** -16.00 -2.10 ** 4.80 1.26 BVPS -0.03 -0.36 0.27 0.72 0.21 1.51 N 522 210 732 adj- R squares 0.16 0.02 0.03
Notes: The notions *, **, and *** denote significance at the 10%, 5% and 1% levels, respectively (two-tailed).
5. Summary and Concluding Remarks
The issue of agency costs caused by overvalued equity has attracted much attention in recent years due to the emergence of many business fraud charges world-wide. Jensen (2004; 2005) suggested that the key to solving such agency problems lies in the development of a corporate governance system and the function of the board of directors. Therefore, this study covers two purposes. First, it examines if the phenomenon of overvalued equity occurs upon seasonal equity offerings made by Taiwanese listed companies. Second, it further tests the conjecture that corporate governance system, especially the function of the board of directors, may help depress the occurrence of overvalued equity. The empirical results show that overvalued equity occurs upon seasonal equity offering made by Taiwanese listed
companies. Furthermore, this study finds that a corporate governance system, exhibiting independence and competence by the board of directors, can help decrease the magnitude of overvalued equity.
References
[1] Ahn, D. H. and A. Shivdasani, 1999, “Long-Term Returns Following Seasoned equity Issues: Bad Performance or Bad Models,” Working paper, University of North Carolina.
[2] Altman, E. I., 1968, “Financial Ratios Discriminate Analysis and the Prediction of Corporate Bankruptcy,” The Journal of Finance 23, pp. 589-609.
[3] Beasley, M. S., 1996, “An Empirical Analysis of the Relation between the Board of Director Composition and Financial Statement Fraud,” The Accounting Review 71, pp. 443 -465.
[4] Beaver, W. H., 1966, “Financial Ratios as Predictors of Failure,” Journal of Accounting
Research 4, pp. 71-111.
[5] Brickley, J.A., J. L., Coles and R. L. Terry, 1994, “Outside Directors and the Adoption of Poison Pills,” Journal of Financial Economics 35, pp. 371-390.
[6] Byrd, J. W., and K. A. Hickman, 1992, “Do Outside Director Monitor Managers? Evidence from Tender Offer Bids,” Journal of Financial Economics 32, pp. 195-222.
[7] Changanti, R. S., V. Mahajan, and S. Sharma, 1985, “Corporate Board Size, Composition, and Corporate Failures in Retailing Industry,” Journal of Management Studies 22, pp. 400-417. [8] Chin, C. L., and H. W. Lin, 2000, “Seasoned Equity Offerings and Earnings Management,” Sun
Yat-Sen Management Review 8, pp. 709-744.
[9] D’Mello, R., and P. Shroff, 2000, “Equity Undervaluation and Decisions Related to Repurchase Tender Offers: An Empirical Investigation,” The Journal of Finance 55, pp. 2399-2424.
[10] Dechow, P. M., R. Sloan., and A. Sweeney, 1996, “Causes and Consequences of Earnings Manipulation: An Analysis of Firms Subject to Enforcement Actions by the SEC,”
Contemporary Accounting Research 13, pp. 1-36.
[11] Drobetz, W., A. Schillhofer., and H. Zimmermann, 2004, “Corporate Governance and Expected Stock Returns: Evidence from German,” European Financial Management 10, pp. 267-293. [12] Fama, E. F., 1980, “Agency Problems and Theory of the Firm,” Journal of Political Economy
88, pp. 288-308.
[13] Fama, E.G., and M. Jensen, 1983, “Separation of Ownership and Control,” Journal of Law and
Economics 26, pp. 301-325.
[14] Gompers, P., J. Ishii., and A. Metrick, 2003, “Corporate Governance and Equity Prices,” The
Quarterly Journal of Economics 118, pp. 108-155.
[15] Jensen, M., 1993, “The Modern Industrial Revolution, Exit, and the Failure of the Internal Control System,” The Journal of Finance 48, pp. 831-880.
[16] Jensen, M., 2004, “The Agency Costs of Overvalued Equity and the Current State of Corporate Finance,” European Financial Management 10, pp. 549-565.
[17] Jensen, M., 2005, “The Agency Costs of Overvalued Equity,” Financial Management 34, pp. 5-19.
[18] Jindra, J., 2000, “Seasoned Equity Offerings, Overvaluation, and Timing,” Working paper, Ohio State University.
[19] Kaplan, S. N., and R. S. Ruback, 1995, “The Valuation of Cash Flow Forecasts: An Empirical Analysis,” The Journal of Finance 50, pp. 1059-1093.
[20] Kim, M., and J. R. Ritter, 1999, “Valuing IPOs,” Journal of Financial Economics 53, pp. 409-437.
[21] Kothari, S., E. Loutskina., and V. Nikolaev, 2006, “Agency Theory of Overvalued Equity as an Explanation for the Accrual Anomaly,” Working Paper, MIT Sloan School of Management. [22] Liu, D. M., and C. L. Chuang, 2003, “An Empirical Analysis on the Effectiveness of Equity
[23] Loughran, T., and J. R. Riter, 1995, “The New Issues Puzzle,” The Journal of Finance 50, pp. 23-52.
[24] Loughran, T., and J. R. Riter, 1997, “The Operating Performance of Firms Conducting Seasoned Equity Offerings,” The Journal of Finance 52, pp. 1823-1850.
[25] Moeller, S. B., F. P. Schlingemann., and R. M. Stulz, 2003, “Wealth Destruction on a Massive Scale? A Study of Acquiring-Firm Returns in the Recent Merger Wave,” Working paper, National Bureau of Economic Research (NBER).
[26] Myers, S., and N. Majluf, 1984, “Corporate Financing and Investment Decisions When Firms Have Information that Investors Do Not Have,” Journal of Financial Economics 13, pp. 187-221.
[27] Penman, S., and T. Sougiannis, 1998, “A Comparison of Dividends in Equity Valuation,”
Contemporary Accounting Research 15, pp. 343-384.
[28] Shiah-Hou, S. R., 1997, “Empirical Study of the IPO Long Run Performance,” Proceedings of
the National Science council, Republic of China 7, pp. 260-275.
[29] Shiah-Hou, S. R., 2000, “The Long-Run Performance of Seasoned Equity Offering in Taiwan,”
Management Review 19, pp. 1-33.
[30] Shiue, M. J., C. J. Lin., and S. P. Lin, 2004, “Corporate Governance, Earning Management and Restatement,” 2004 International Conference on Economics, Finance and Accounting, Taipei, Taiwan.
[31] Spiess, D. K., and J. Affleck-Graves, 1995, “Underperformance in Long-Run Stock Returns Following Seasoned Equity Offerings,” Journal of Financial Economics 38, pp. 243-268. [32] Tam, K. Y., and M. Y. Kiang, 1992, “Managerial Applications of Neural Networks: The Case