Quantitative relationship between fluctuations of blood pressure
and sympathetic nerve activity in pentobarbital anesthetized rats
M.L. Tsai
a, F.-Z. Shaw
b, C.-T. Yen
a,*
aDepartment of Zoology, National Taiwan University, #1, Section 4, Roosevelt Road,Taipei, Taiwan 10764 bInstitute of Electrical Engineering, National Taiwan University, Taipei, Taiwan
Received 9 December 1998; received in revised form 20 January 1999; accepted 20 January 1999
Abstract
Transfer function analysis was used to examine the coupling between the sympathetic nerve activity (SNA) and the blood pressure (BP) fluctuations. In pentobarbital anesthetized Wistar rats, linear regression of the relationship between frequency (X-axis) and the logarithmic transfer magnitude, i.e. log (BP power density/renal SNA power density) (Y-(X-axis), in the low frequency range (0.016–0.85 Hz) revealed an excellent fit (r=0.97–0.98). Comparing the regression lines, rats under large dose of pentobarbital anesthesia (40 mg/kg, i.v. single dose) had significantly smaller intercept and slope values compared to rats under small dose of pentobarbital anesthesia (12.5 mg/kg). When intercept and slope values were compared between intact and acutely sinoaortic denervated rats, no significant difference were found. The results suggest that sympathetic modulation of vasomotor tone may be a major factor in generating BP fluctuations between 0.016 and 0.85 Hz in rats. Furthermore, these results support the possibility of using low frequency spectral power of BP to quantitatively estimate the fluctuations of SNA for rats under pentobarbital anesthesia if anesthetic depth is controlled.1999 Elsevier Science Ireland Ltd. All rights reserved. Keywords: Blood pressure fluctuation; Power spectral analysis; Sympathetic nerve activity; Transfer function
Spectral power of blood pressure (BP) fluctuation at a frequency range slower than the respiratory rate (low fre-quency BP fluctuation, LFBP) has been proposed to reflect
sympathetic modulation of the vasomotor tone because it is significantly decreased after sympathetic blockade [2–6]. Many physiological and pathological conditions which increase or decrease sympathetic nerve activity (SNA) usually increase or decrease LFBP levels concomitantly
[7,8]. However, there has not been an universal agreement on the frequency band for the LFBP. Furthermore, there are
situations, for example, during exercise, where prediction of the sympathetic activity from LFBPfailed [9]. Therefore, it
seems that LFBPvalue can be used to quantitatively estimate
SNA only under favorable conditions. The purpose of the present study was to determine firstly the useful frequency band and secondly the influences of baroreceptor activity
and anesthetic depth on the relationship between LFBPand
renal sympathetic activity.
Recently, we found an equation which was able to describe the relationship between the fluctuations of BP and renal SNA under a simplified condition [11]. In that study, rats were anesthetized, paralyzed and sinoaortic deaf-ferented (SAD). In addition, cardiac autonomic control and angiotensin converting enzyme were blocked and the respiration frequency controlled by a respirator. We found that the fluctuation of SNA induced by stimulating the sym-pathoexcitatory areas of the medullary oblongata produced BP fluctuation at the same frequency. The efficiency of this effect was frequency dependent, such that sympathetic effect on the vasculature was the highest at the lowest fre-quency and rapidly decreasing as the stimulation frefre-quency increased. This relationship can be mathematically expressed as PSNA=PBP×a×10b×(frequency), where PBP
and PSNAare the power spectral densities of BP and SNA,
and a, b are constants.
This mathematical relationship demonstrates that the Neuroscience Letters 263 (1999) 85–88
0304-3940/99/$ - see front matter 1999 Elsevier Science Ireland Ltd. All rights reserved.
P I I : S 0 3 0 4 - 3 9 4 0 ( 9 9 ) 0 0 1 0 0 - 7
* Corresponding author. Tel.: +886-2-23630231 ext. 3322; fax: +886-2-23636837; e-mail: [email protected]
variability of BP can be used to quantitatively estimate SNA variability in this restricted condition. Under natural condi-tions, SNA tends to fire in bursts. This can be thought as spontaneous central stimulation. It is interesting, therefore, to assess whether the same transfer function can be applied to spontaneously occurring BP and SNA fluctuations. For this purpose, we recorded the BP and SNA of the rats under pentobarbital anesthesia and calculated their transfer func-tion. Effects of different anesthetic depths and deafferenta-tion of baroreceptor on this transfer funcdeafferenta-tion were assessed. This is to test the general applicability of this relation-ship.
Twelve adult male Wistar rats (350–450 g) were used. They were divided into two groups, six each. All the rats were anesthetized with sodium pentobarbital (50 mg/kg, i.p. initially and 12.5 mg/kg i.v., supplemented as necessary). Femoral artery and vein were cannulated for systemic arter-ial BP recording and drug administration respectively. Rec-tal temperature of the rat was maintained at 37.5±0.1°C with a feedback controlled thermal blanket. A bipolar stain-less steel electrode with fire-polished ball tip was attached to the diaphragm through an opening in the abdomen to record the electromyograph (EMG) of the diaphragm mus-cle.
After left kidney was exposed retroperitoneally, the renal nerve was dissected free from the surrounding connective tissues, and crushed distally. A bipolar hook electrode made of fine strains of stainless steel microwires (biomedical wire AS 634; Cooner wire Co., Chatsworth, CA) was placed under the renal nerve. The exposed nerve and electrode were encased in silicon gel (Wacker Siligel 604; Munich). Following surgery, a period of time was allowed to pass to let the animal return to a lighter level of anesthesia as indi-cated by its ability to withdraw the hindlimb slightly when pinched. Then pentobarbital was administrated as a single dose. In the first group, after the flexor reflex returned, a small dose of sodium pentobarbital solution (12.5 mg/kg) was injected intravenously. The recording period covered approximately 30 min starting from the time when the BP returned to a stable level. When the recording finished, the rats were subjected to SAD. Detail of the procedures have been described previously (Yang et al., 1995) [12]. Briefly, carotid sinus nerves, glossopharyngeal nerves, superior lar-yngeal nerves, and sympathetic trunks near the superior cervical ganglia were transacted bilaterally. The carotid bifurcations were stripped of fibers and connective tissues. The extent of baroreceptor denervation was confirmed by the elimination of both the cardiac rhythm in the SNA power spectrum and the reflex inhibition of heart rate and SNA during BP increase subsequent to administration of phenylephrine (5 mg/kg, i.v.). After completion of the SAD, a period of waiting ensued to allow the flexor reflex of the rat to recover. Thereafter, the same dose of pentobar-bital (12.5 mg/kg) was given, and the same procedure of data acquisition was followed as before SAD. In the second group, after the return of the flexor reflex, a larger dose of
pentobarbital (40 mg/kg) was injected intravenously. The recordings were still made of the initial 30 min following the return of the BP to a steady level. In the end of the experiment, hexamethonium (20 mg/kg, i.v.) was admini-strated to obtain the background noise level in the recording system.
The BP signal was obtained through the arterial cannula via a pressure-voltage transducer (Gould P23 ID) and ampli-fied (Grass 7D). The electrical signal of renal SNA and diaphragm EMG were band-pass filtered (30–3000 Hz for renal SNA and 300–3000 Hz for EMG) and amplified (10 000×) by Grass P511 differential amplifiers. All signals were stored on a tape recorder (model DR-886; Neuro Data, New York, NY). Each recording period was divided into thirteen 64 s epochs, which were collected every two min-utes for off-line power spectral analysis. All the signals were digitized at 6000 samples/s by using a MP 100 A/D converter (BIOPAC System, Goleta, CA). The SNA and EMG signals were integrated by a digital integrator with a 20 ms resetting time. The digitized blood pressure and inte-grated signals were resampled at 128 Hz. Power spectral densities of the integrated signals and the blood pressure
Fig. 1. An example of the logarithmic of the transfer magnitude between the BP and SNA (in mmHg2/(mV×s)2, Y-axis) plotted against frequency (X-axis) during one 64 s epoch each before and after SAD in the same rat. Note transfer magnitude decreased expo-nentially when the frequency was increased between 0.016 and 0.85 Hz both in the intact and SAD conditions. The regression coefficients were 0.82 and 0.81 for the top and the lower figures, respectively. The dotted line indicates 0.85 Hz. Note above this frequency transfer magnitude followed diaphragm EMG spectrum (lower traces, (mV×s)2/Hz) closely.
were computed by fast Fourier transform (Matlab 4.2c.1; MathWorks) after removing DC component and applying a Hanning window. The transfer magnitude of sympathetic activity to blood pressure was obtained by dividing the blood pressure spectral power (PBP) to the sympathetic
spec-tral power (PSND) at each frequency point. Data were
expressed as mean±SE if not specified. Paired t-test was used to compare the data for intact and SAD conditions. Student’s t-test was used to compare data between two pen-tobarbital dosage treated conditions.
The average BP, heart rate (HR), renal SNA and respira-tory rate of the recording periods of the rats given a small dosage (12.5 mg/kg) of pentobarbital were 124±10 mm Hg, 398±14 beat-per-minute (bpm), 13.7±4.0 mV× s and 79±4 cycle-per-minute (cpm) respectively. The cor-responding values in the recording periods of the other six rats given a large dosage (40 mg/kg) of pentobarbital were 115±5 mmHg, 369±10 bpm, 14.5±1.5 mV×s and
79±5 cpm, none of which were statistically different (P. 0.05). Thirty minutes after the SAD procedure, during which phenylephrine test was performed and the rat was allowed to recover until its flexor reflex returned, the aver-age BP, renal SNA and the respiration rate were also not significantly different from those before SAD (P. 0.05).
Transfer function analysis of BP power versus SNA power revealed two different frequency zones in all cases. Examples are shown in Fig. 1. In the top figure, original transfer magnitude data (open circles) in one epoch of a rat injected with a 12.5 mg/kg dose of pentobarbital is plotted against frequency. Also plotted is the spectrum of the diaphragm EMG. At frequency range higher than 0.85 Hz, logarithmic transfer magnitude of PBP(mmHg2/Hz)
ver-sus PSND((mV×s)2/Hz) correlated strongly with the
spon-taneous respiration of the rat, indicating the mechanical pumping of the respiratory organs on the BP.
At frequencies slower than 0.85 Hz, transfer magnitude decreased logarithmically with the increase of frequency. The relationship between frequency versus the logarithmic magnitude of transfer function in the low frequency range (0.016–0.85 Hz) was further analyzed by linear regression method. The correlation coefficient of the examples in the top of the Fig. 1 was−0.82. If the PBP/PSNDvalues of all the
13 epochs in all six rats were averaged, significant higher correlation coefficient values were obtained (Fig. 2, light,
−0.98 ±0.00, n=6). This result was in striking similarity with those of our previous study [11]. It was valid whether the pentobarbital anesthesia dose was large or small and whether baroreflex was intact or eliminated (Fig. 2). The results suggest that sympathetic modulation of vasomotor tone may be a major factor in generating BP fluctuations between 0.016–0.85 Hz in the pentobarbital anesthetized rats.
The slope and intercept of the regression line of the rats given a small pentobarbital dose were −3.81±0.10 and Fig. 2. Semi-logarithmic plots of averaged transfer magnitudes in
frequency range from 0.016 to 0.85 Hz. From top to bottom are averaged data from the six rats injected with 12.5 mg/kg bolus of pentobarbital solution (LIGHT), the same group of rats with the same injection after sinoaortic denervation (SAD), and the other six rats injected with a larger pentobarbital dosage (40 mg/kg, DEEP). In each figure are individual data (dotted lines), arithmetic means of individual data (circles), and regression lines (solid lines) of the arith-metic means. Note logarithmic decreasing of the transfer magnitude against frequency in all three conditions.
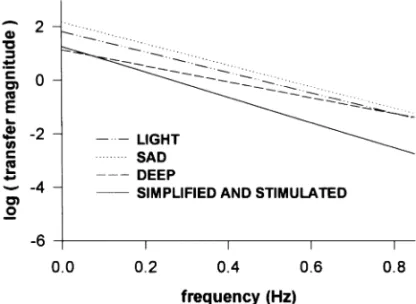
Fig. 3. Comparison of the regression lines obtained in LIGHT (dash-dot-dot line), SAD (dotted line) and DEEP (dashed line) conditions in the present study, and the heart blocked, captopril treated, paral-yzed, respired and centrally stimulated condition (solid line, SIMPLI-FIED AND STIMULATED) from a previous study [11].
87 M.L. Tsai et al. / Neuroscience Letters 263 (1999) 85–88
1.82±0.15 respectively, −4.01± 0.12 and 2.17±0.31 in the SAD condition. The value of slope and intercept in the intact and SAD conditions were not significantly different. But these numbers in the rats given a large pentobarbital dose were significantly smaller (−3.11±0.14 and 0.66 ± 0.34, respectively) than those given a small dosage anesthe-sia. A close comparison of the four regression lines (three from the present study and 1 from reference 11) also reveals some differences (Fig. 3). Compared with the present results, the regression line of the previous study [11] was at a lower position. It seems that cardiac factors, renin-angiotensin system or spontaneous breathing interact with sympathetic action on the vasculature to cause a general increase in the transfer magnitude. For example, angiotensin II can facilitate sympathetic neurotransmission at the adre-nergic nerve terminal by increasing the amount of norepi-nephrine in the synaptic cleft. This may result from an increased release or a decreased reuptake of norephinephr-ine, or both [10].
We also found that the larger amount of pentobarbital anesthesia caused a larger decrease in the transfer magni-tude. Altura and Altura [1] demonstrated that pentobarbital dose-dependently attenuates the vascular contractions induced by epinephrine and serotonin. It is likely that the larger amount of pentobarbital (40 mg/kg) depressed sym-pathetic-vasculature transmission more and hence, their transfer magnitude decreased.
Baroreflex is an important factor to generate the LFBP[3].
In this study, baroreflex was operating normally under the control conditions and was eliminated completely by SAD, but the frequency-transfer magnitude relationship unaltered by SAD. A possible explanation may be that influences of the baroreflex on the vasculature travel through the sympa-thetic fibers. Relative to SNA, the baroreflex is secondary. Hence the removal of the baroreceptors, although changing the distribution of the individual spectral power of BP and SNA, did not alter the coupling ratio between them.
Based on results from the present study (spontaneous SNA and BP fluctuation) and from the stimulated fluctua-tions of SNA and BP [11], we propose that there is a quan-titative relationship between the BP fluctuation and SNA fluctuation at frequencies slower than the respiration rate, expressed as follows: PSNA=PBP×a×10b×(frequency), where
a and b are constants obtained from the intercept and slope values (respectively) of the regression line of the semi-loga-rithmic plot.
Although our present data support the possible use of the
LFBPas a quantitative index of SNA variability in
anesthe-tized rats, the precise utility of the equation remains to be determined. Variations of the regression slope and intercept values in different individuals and different conditions call for further study of possible complications from various control factors.
This study was supported by a grant NSC 86-2314-B002-095-M04 from the National Science Council, Republic of China.
[1] Altura, B.T. and Altura, B.M., Pentobarbital and contraction of vascular smooth muscle, Am. J. Physiol., 229 (1975) 1635– 1640.
[2] Akselrod, S., Eliash, S., Oz, O. and Cohen, S., Hemodynamic regulation in SHR: investigation by spectral analysis, Am. J. Physiol., 253 (1987) H176–H183.
[3] Cerutti, C., Barres, C. and Paultre, C., Baroreflex modulation of blood pressure and heart rate variabilities in rats: assessment by spectral analysis, Am. J. Physiol., 266 (1994) H1993– H2000.
[4] Cerutti, C., Gustin, M.P., Paultre, C.Z., Lo, M., Julien, C., Vincent, M. and Sassard, J., Autonomic nervous system and cardiovascular variability in rats: a spectral analysis approach, Am. J. Physiol., 261 (1991) H1292–H1299.
[5] Daffonchio, A., Franzelli, C., Radaelli, A., Castiglioni, P., Di Rienzo, M., Mancia, G. and Ferrari, A.U., Sympathectomy and cardiovascular spectral components in conscious normo-tensive rats, Hypertension, 25 (1995) 1287–1293.
[6] Japundzic, N., Grichois, M.-L., Zitoun, P., Laude, D. and Elghozi, J.-L., Spectral analysis of blood pressure and heart rate in conscious rats: effects of autonomic blockers, J. Auton. Nerv. Syst., 30 (1990) 91–100.
[7] Malliani, A., Pagani, M. and Lombardi, F., Physiology and clin-ical implications of variability of cardiovascular parameters with focus on heart rate and blood pressure, Am. J. Cardiol., 73 (1994) 3C–9C.
[8] Malliani, A., Pagani, M., Lombardi, F. and Cerutti, S., Cardio-vascular neural regulation explored in the frequency domain, Circulation, 84 (1992) 482–492.
[9] Parati, G., Saul, J.P., Di Rienzo, M. and Mancia, G., Spectral analysis of blood pressure and heart rate variability in evaluat-ing cardiovascular regulation: a critical appraisal, Hypertension, 25 (1995) 1276–1286.
[10] Peach, M.J., Renin-angiotensin system: biochemistry and mechanisms of action, Physiol. Rev., 57 (1977) 313–370. [11] Tsai, M.L., Chu, L.W., Chai, C.Y. and Yen, C.-T., Frequency
dependent sympathetic modulation of vasomotor tone in the anesthetized rat, Neurosci. Lett., 221 (1997) 109–112. [12] Yang, T.L.-C., Chai, C.Y. and Yen, C.-T., Enhanced
sympa-thetic reactivity to glutamate stimulation in medulla oblongata of spontaneously hypertensive rats, Am. J. Physiol., 268 (1995) H1499–H1509.