This article was downloaded by: [National Chiao Tung University 國立交通大學] On: 28 April 2014, At: 04:19
Publisher: Taylor & Francis
Informa Ltd Registered in England and Wales Registered Number: 1072954 Registered office: Mortimer House, 37-41 Mortimer Street, London W1T 3JH, UK
Aerosol Science and Technology
Publication details, including instructions for authors and subscription information:http://www.tandfonline.com/loi/uast20
Factors Influencing Pressure
Drop through a Dust Cake during
Filtration
Yu-Hsiang Cheng a & Chuen-Jinn Tsai a
a
Institute of Environmental Engineering, National Chiao Tung University , No. 75, Poai St., Hsin Chu, Taiwan, Republic of China
Published online: 13 Jun 2007.
To cite this article: Yu-Hsiang Cheng & Chuen-Jinn Tsai (1998) Factors Influencing Pressure Drop through a Dust Cake during Filtration, Aerosol Science and Technology, 29:4, 315-328, DOI: 10.1080/02786829808965572
To link to this article: http://dx.doi.org/10.1080/02786829808965572
PLEASE SCROLL DOWN FOR ARTICLE
Taylor & Francis makes every effort to ensure the accuracy of all the information (the “Content”) contained in the publications on our platform. However, Taylor & Francis, our agents, and our licensors make no
representations or warranties whatsoever as to the accuracy, completeness, or suitability for any purpose of the Content. Any opinions and views expressed in this publication are the opinions and views of the authors, and are not the views of or endorsed by Taylor & Francis. The accuracy of the Content should not be relied upon and should be independently verified with primary sources of information. Taylor and Francis shall not be liable for any losses, actions, claims, proceedings, demands, costs, expenses, damages, and other liabilities whatsoever or howsoever caused arising directly or indirectly in connection with, in relation to or arising out of the use of the Content.
This article may be used for research, teaching, and private study purposes. Any substantial or systematic reproduction, redistribution, reselling, loan, sub-licensing, systematic supply, or distribution in any form to anyone is expressly forbidden. Terms & Conditions of access and use can be found at http:// www.tandfonline.com/page/terms-and-conditions
ELSEVIER
Factors Influencing Pressure Drop through a Dust
Cake during Filtration
Yu-Hsiang Cheng and Chuen-Jinn
Tsai*
~NSTITUTF OF ENVIRONMENTAL EPUGINEIIRIYG, N A T I O ~ A I CHIAO TUNG UNIVLKSITY, NO 75, POAI S I , HSIN CIIU, TAIWAN, RLPUBLIC or CHINA
ABSTRACT. Three kinds of dust materials, Hy ash (MMAD : 6.28 pm), limestone (MMAD : 2.53 pm) and SAE fine dnst (MMAD : 3.88 pm), have been used to test the dust cake compaction and its influence on the specific dust cake resistance coefficient at filtration velocity ranging from 1 to 9 cmlsec. An accurate laser dispacement system was used to determine dust cake thickness and the amount of dust cake compaction during filtration. In the range of filtration velocity tested, dnst cake compaction has been found to occur. Higher filtration velocity results in larger amount of irreversible dust cake compaction and lesser amount of elastic dnst cake compaction. The experimental specific dnst cake resistance coefficient, K,, has also been found to increase with an increasing filtration velocity. For the three dusts tested, K, relates to filtration velocity V, as K2 .x V,", where n is 0.52, 0.38 and 0.43, for Hy ash, limestone and SAE fine dust respectively. The theoretical K, values predicted by the Rudnick-Happel equation has been shown to agree better with the experimental K2 values than those by the Kozeny-Carman equation. The maximum difference between the K, values predicted by the Rudnick-Happel equation and the experimental values is less than about 16%. &ROSOL SCIENCE AND TEC~~NOLOGY 29:315-328 (1998) 63 1998 American Association for Aerosol Research
INTRODUCTION
Filtration velocity, V,, has been found to affect the magnitude of specific dust cake resistance coefficient, K,,(Spaite and Walsh, 1963; Borgwardt and Durham, 1967; Dennis and Durham, 1979; Dennis and Dirgo, 1981). Most previous researchers have re- ported that the relationship between K, and V, is K, =
fV;,
where f and n are constants.The constant n is always positive, indicating that higher filtration velocity always results in greater K,. A wide range of n exists in the literature. Experimental data of Spaite and Walsh (1963) show that n is about 0.5 for -'Corresponding author.
Aerosol Science and Technology 29315-328 (1998) O 1998 American Association for Aerosol Research Published by Elsevicr Sciencc Inc.
both mica and fly ash, despite that particle shape between mica (roughly plate-like) and fly ash (roughly spherical) is quite different. Other experimental data have shown that n is 0.75 for fly ash (Borgwardt and Durham, 1967); 0.19 for submicron Arizona road dust (Rudnick and First, 1978a and 1978b); 0.5 for coal fly ash (Dennis et al., 1979; Dennis and Dirgo, 1981). These results show that dust cake will be compacted to a greater extent when subjected to a higher fluid drag force leading to smaller dust cake porosity and greater K, at higher filtration velocity, (VanOsdell et al., 1984; Klemm et al., 1980). Rudnick and First (1978a, 1978b) also in- dicated that dust cake compaction was due
316 C.-J. Tsai and K H Cheng Aerosol Science and Technology
29:4 October 1998
mainly to increasing pressure drop as dust cake thickened. But, the amount of compac- tion of the dust cake with respect to filtration velocity and its influence on the K, value remained to be determined. In particular, an accurate system to measure the amount of compaction of the dust cake has yet to be developed.
The theoretical method to estimate the K, value is based upon filtration theory. The Kozeny-Carman equation has been used widely to calculate the pressure drop across dust cake deposited on a filtration medium. This semiempirical equation also may be used to predict K, value based on dust cake porosity and an empirical constant. Rudnick and First (1978a, 1978b) provided an equa- tion that derived from the Happel's cell model (1958) to predict K, without an cm- pirical constant. K2 values predicted by the classical Kozeny-Carman equation and by the Rudnick-Happel equation agree to within 2 2 0 % over the dust cake porosity ranging from 0.3 to 0.7. When the dust cake porosity is greater than 0.7, the Rudnick- Happel equation always predicts higher K, values than those computed by the Kozeny- Carman equation. Dennis and Dirgo (1981) measured K, values of several fly ashes at the laboratory and compared them with the prc- dieted values by the Rudnick-Happel equa- tion. The predicted values were found to be three times greater than the measured val- ues.
Most previous theories are unable to pre- dict K, values accurately, becausc errors may occur when measuring pararnetcrs such as dust cake porosity or particle sizc distribu- tion (Dennis et al., 1979; Dennis and Dirgo, 1981). T o account for thc polydispersity of the particulate material, volume-surface mean diameter (also called Sautcr diameter) was usually used to rcpresent the particle size of the lognormally distributed dust for calculating specific dust cake resistance co- efficient. Gupta et al. (1993) used the Rud- nick-Happel equation to predicted K, val- ues. The results were shown to be in good agreement with the experimental data for nonhygroscopic aluminum oxide for the dust cake porosity ranging from 0.84 to 0.95.
However, for the hygroscopic sodium chlo- ride, the agreement was shown to be poor due to large variation in the dust cake po- rosity measurement.
The previous review points out there are substantial differences between experimen- tal data as well as theoretical predictions in the property and specific rcsistance coeffi- cient of the dust cake. The incapability of measuring porosity and compressibility of the dust cake accurately under different fil- tration conditions seems to be one of the major factors that leads to these discrepan- cies. There is a critical need to measure the porosity and compressibility of the dust cake accurately using different dust materials at different filtration velocities. Current theo- retical models for K, should be reexamined using reliable experimental data under well- controlled conditions.
In this study, laboratory measurement was conducted to obtain K, values for three kinds of dust cakes: fly ash, limestone, and SAE fine dust, at different filtration veloci- ties. After the dust cake was formed, an accurate laser displacement system was used to measure the thickness of dust cake and to obtain its porosity. Then the experimental
K, values were compared with theoretical predictions at filtration velocity ranging from 1 to 9 cmlsec.
FUNDAMENTAL THEORY OF K2 When there is a significant particle mass loaded on a filter, total pressure drop across the filter can be expressed as the sum of the pressure drop across the clean filter me- dium, AP, , and that across the dust cake, Ap, as follows
AP = APf
+
AP,. ( I From Darcy's law, AP, can be written as the filtration velocity times the filter resistance constant K, asAP, = K , V, (2)
where K, depends upon the physical charac- teristics of the filter medium such as the
Aerosol Science and Technology 2 9 4 October 1998
Pressure Drop through a Filter Dust Cake 317
filter pore size, filter material and filter thickness.
The pressure drop across the dust cake can be derived from the drag force across all individual particles. It also can be described by Darcy's law as a function of the specific dust cake resistance coefficient, K2, the dust mass deposited, M, the filtration velocity, V,,
and the filtration area, A, as
where W is the mass areal density of the dust cake and S is the filter drag. If the drag force FD exerted on each particle by the airflow is governed by the Stokes law, the above equa- tion can be expressed as
where N is the total particle number in the dust cake, p is the gas viscosity, D, is the particle size, and C is the Cunningham slip correction factor.
If particles are monodisperse and isolated, then Eq. (4) can be written as
where K2,, is the theoretical specific dust cake resistance coefficient for separate, iso- lated and monodisperse spherical particles.
To account for the fact that particles are in contact with each other, and are polydis-
perse, different researchers have developed methods to calculate the specific dust cake resistance coefficient such as the Kozeny- Carman equation or the Rudnick-Happel equation (Happel, 1958; Rudnick and First, 1978a, 1978b; Gupta et al., 1993).
Kozeny and Carman derived a semiem- pirical equation that represents the dust cake as a series of parallel capillaries or channels whose total volume equals the void volume of the cake and whose surface area equals the surface area of the particles con- stituting the cake. The specific dust cake resistance coefficient is defined as a function of the dust cake porosity E as
where the empirical constant k is equal to 4.8 for spherical particles and 5.0 for irregular particles, the Dvs is the volume-surface mean diameter (or Sauter diameter).
Rudnick and First (1978a, 1978b) dc- scribed an equation for specific dust cake resistance coefficient that derived from the Happel's cell model (1 958) to predict pres- sure drop across a dust cake without an em- pirical constant. The Happel's cell model treats the dust cake as an assemblage of individual particles, each cell containing a particle surrounded by an imaginary concen- tric spherical shell. The porosity of the dust cake is cqual to the ratio of the volume between the spherical shell and the particle to that of the spherical shell. The specific dust cake resistance coefficient based on the Happel's cell model and reformulated by Gupta et al. (1993) can be expressed as
In this model, D,, is the geometric mean particle size distribution. The dust cake po- diameter for polydisperse dusts, and slip cor- rosity is often difficult to estimate theoreti- rection factor, C, is calculated based on D,, cally or experimentally due to the complexity (Gupta et al., 1993). of cake structure. This study improves the However, these equations require a experimental method to measure the dust knowledge of the dust cake porosity and cake porosity, the particle size distribution
318 C.J. Tsai and Y - H Cheng Aerosol Science and Technology 29:4 October 1998
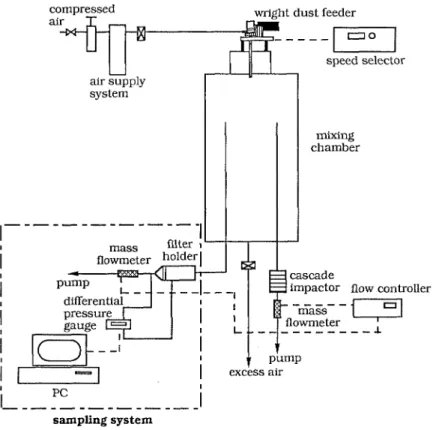
FIGURE 1. Schematic diagram of the experimental setup for dust filtration.
and the specific dust cake resistance coeffi- cient under well-controlled conditions. The experimental K, values then will be com- pared with theoretical predictions by differ- ent models, Eqs. (6) and (7).
EXPERIMENTAL METHOD
An experimental system shown in Fig. 1 was designed to measure the pressure drop as a function of sampling time or mass areal loading (mass per unit area of filter, MIA). Three test dusts, fly ash (obtained from the Wsin-Da coal-fired power plant, Taiwan), limestone (Lih Hsiang Industrial Co., Ja- pan), and SAE fine dust (Power Technology Inc., Burnsville, MN, USA) were used in this study. A Wright dust feeder (WDF-TI, BGI Inc., Waltham, MA, USA) was used to gen- erate the test dust, which was introduced into a dust chamber. The dust chamber is 35
cm in diameter and 50 cm in height. The dust chamber has two sampling tubes which arc 45 cm long. The inner diameter of the sam- pling tube is 1.05 cm. One sampling tube was connected to a Marple personal cascade im- pactor (Model 225-50-001, SKC Inc., Eighty Four, PA, USA) to measure the particle size distribution of the test dust, while another one was connected to the filtration system using a 90° elbow. The cutoff aerodynamic diameters of the Marple cascade impactor are 21.3, 14.8, 9.8, 6.0, 3.5, 1.55, 0.93, and 0.52 mm respectively for each stage at the sampling flow rate of 2.0 Llmin. In this study, particles were found to deposit on the filter uniformly which allowed the thickness of the dust cake to be measured accurately.
The filtration system includes a filter holder, a digital manometer, a mass flowme- ter, and an IBM PC. The diameter of the filter collection area was designed to be 3.5
Aerosol Science and Technology Pressure Drop through a Filter Dust Cakc 319 2 9 4 October 1998 sensor controller
UI!
-
digital display laser sensor y-direction control x-direction controlass flow meter
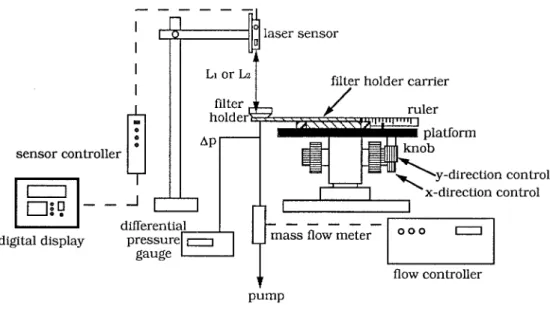
FIGURE 2. Schematic diagram of the laser displacement sensor system.
cm. A straight tube that is 8 cm long and 3.5 cm in diameter was connected carefully be- fore the filter holder to keep the air velocity and deposited particles uniform on the filter surface. The pressure drop across the filter holder was measured using a digital differ- ential pressure gauge, and the signal of the pressure drop was recorded with an IBM PC continuously. The constant filtration velocity through thc filter was controlled by a mass flowmeter. Filtration velocities used in this study were 1.0,3.0,6.0, and 9.0 cmlsec, which corresponded to sampling flow rates of 0.58, 1.73, 3.46, and 5.20 Llmin.
The dust concentration in the chamber was controlled by the rotational speed of the dust feeder and the flow rate of the com- pressed air. In this study, the revolution speed of the Wright dust feeder was kept at 0.8 RPM, and the inlet pressure of com- pressed air was controlled at 6 psig. At these operating conditions, the mass conccntra- tion was about 1.36
-
1.96 g/m3 for fly ash, 2.83-
3.40 g/m"or limestone, and 2.78-
3.72 g/m3 for SAE fine dust respectively. Test particles generated by the dust feeder might carry electrostatic charge. However, the effect of electrostatic charge on dust cake properties was not studied.The particle size distribution of the dust was measured twice with the cascade impac- tor at each run. The impactor sampling time took about 15 to 20 sec to avoid overloading of the cascade impactor stages. The particle loss in the sampling tubc and the filtration system was taken into account by consider- ing diffusion, impaction, sedimentation and turbulent deposition mechanisms (Liu et al., 1985).
To investigate dust cake porosity, a mea- surement system shown in Fig. 2 was de- signed. A laser displacement sensor (Model LB-72lLB-12, Keyencc Corp., Takatsuki, Osaka, Japan) was used to measure the dis- tance between the laser sensor and the filter surface or dust cake surface. The sensor was mounted on a support that was fixed on a laboratory desk. The resolution of this laser displacement sensor is 2 mm. Before dust sampling, the blank filter was weighted for its blank weight M,. Then, this filter was installed into thc filter holder, supported by a stainless screen, and mounted on a remov- able platform. The distance between the sen- sor and the clean filter surface was deter- mined while clean air was flowing through the filter at a designated filtration velocity to minimize measurement errors. The baseline
320 C.-3. Tsui and Y.-H Cheng Aerosol Science and Technology 29:4 October 1998
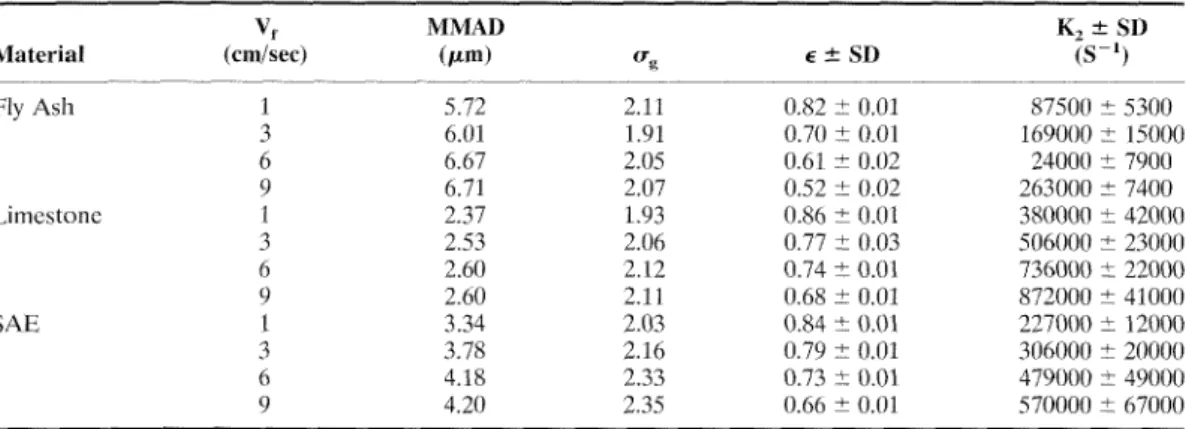
TABLE 1. Measured Particle Size, Geometric Standard Deviation, Porosity of Dust Cake, and Specific Dust Cake Resistance Coefficient for Test Dusts
v,
MMAD K, r SDMaterial (cmlsec) (pm) uz E 2 SD (S-I)
F I ~ ~ s h 1 5.72 2.11 0.82 i 0.01 87500 r 5300 3 6.01 1.91 0.70 2 0.0 l 169000 i 15000 6 6.67 2.05 0.61 i 0.02 24000 i 7900 9 6.71 2.07 0.52 f 0.02 263000 i 7400 Limcstonc 1 2.37 1.93 0.86 i 0.01 380000 i 42000 3 2.53 2.06 0.77 i 0.03 506000 i 23000 6 2.60 2.12 0.74 i 0.01 736000 i 22000 9 2.60 2.11 0.68 i 0.01 872000 2 41000 S AE 1 3.34 2.03 0.84 ? 0.01 227000 i- 12000 3 3.78 2.16 0.79 i 0.01 306000 r 20000 6 4.18 2.33 0.73
+
0.01 479000 i 49000 9 4.20 2.35 0.66 i 0.01 570000 i 67000distance, L,, was calculated as the average of measurements at 18 points evenly distrib- uted on the filter. It was noted that the filter support must be firm enough to avoid defor- mation when the air was drawn through the filter. After measuring the baseline distance, the filter holder was removed from the plat- form and was assembled in the filtration sys- tem. It was found that the coefficient of variation of thickness measurement was about 396, indicating the reliability of cur- rent experimental method.
T h e ~ p - t curve then was obtained bv sam- pling test dust through the filter at a cdnstant filtration velocity. Total filtration time was recorded after an uniformed dust cake was formed. Typically, a uniform dust layer was formed on the filter when the mass areal density was greater than 0.02 &m2 for lime- stone and SAE fine dust, and 0.04 g/cm2 for fly ash. After sampling, the filter holder was disassembled from the filtration system with- out turning off the sampling pump. The dust cake otherwise would fracture when the pump was turned off. The filter holder with dust loaded filter was reinstalled on the plat- form to measure the distance, L,, between the sensor and the dust cake surface. Again, L, was the avcragc of 18 measurements on the dust cake surface. To study dust cake compaction by filtering air, changes of the pressure drop and the cake thickness were recorded while the cake was subjected to dust-free air at a certain face velocity, which
was lower or higher than the filtration veloc- ity used to form the dust cake.
After measuring the thickness of the dust cake L, which was calculated as L = L,-L,,
the dust loaded filter was disassembled from the filter holder and weighted again to ob- tain the weight of dust loaded filter, M,. The total mass areal density on the filter, W,, was calculated as W = (M, - M,)IA. The dust cake porosity was then determined as
The particle densities of fly ash, limestone, and SAE fine dust are 2.06 g/cm3, 2.70 g/cm3 , and 2.65 g/cm3 respectively, as obtained from the manufacturers or suppliers.
After the experiment, the AP-t data was transformed into the S-W data. The experi- mental K, value was determined as the slope of the linear portion of the S-W curve by linear regression. The linear portion of the S-W curve corresponds to the condition when an uniform dust cake is formed.
RESULTS AND DISCUSSION
Measured data of particle mass median aerodynamic diameter (MMAD), geometric standard deviation (IT,), dust cake porosity
(E), and specific dust cake resistance coeffi- cient (K,), for fly ash, limestone, and SAE fine dust at different filtration velocities are
Aerosol Science and Technology 29:4 October 1998
Pressure Drop through a Filter Dust Cake 321
0,l
FIGUR
1,o
10,o
10
D,
Aero
[pin]
c) SAE fine dust
--7-
1) limestone0.1
10
100
1C
D,
Aero
[pin)1,o
10.0
1000
D,
Aero
[pin]:E 3. Typical measured particle size distributions at the filtration velocity of 9 cmlsec. (a) fly ash, MMAD =
6.71 mm, cr, = 2.07 (b) limestone, MMAD = 2.60 mm, a,= 2.11 (c) SAE fine dust, MMAD = 4.20 mm, a, = 2.35. The solid curves and fitting parameters, MMAD and %, were obtained using DISFIT program.
shown in Table 1. Each data is the average of four to five test runs. In the dust chamber, the temperature was kept at 26 +- 1°C, and the relative humidity was below 10%. The MMAD and a,for the test dusts loaded on the filter were measured and corrected for particle loss in the transport tubes of the cascade impactor and filtration system. Figs. 3a-3c show the typical particle size distribu- tion for fly ash, limestone and SAE fine dust,
respectively, at the filtration velocity of 9 crnlsec. Solid curves in the figures were ob- tained by fitting the data using DISFIT pro- gram distributed by TSI Inc. (St. Paul, MN, USA). The MMAD of the loaded dusts on the filter was found to be smaller than that in the test chamber mainly due to particle loss in the transport tube of thc filtration line. It was found that loss due to large particle sedimentation in the horizontal tube of the
322 C.-J. Tsni ~znd Y. -H Cheng Aerosol Scicnce and Technology 29:4 October 1998
-43- Limestone
0.00 0.02 0 .04 0.06 0.08 0.10
mass areal density,
g/cm2
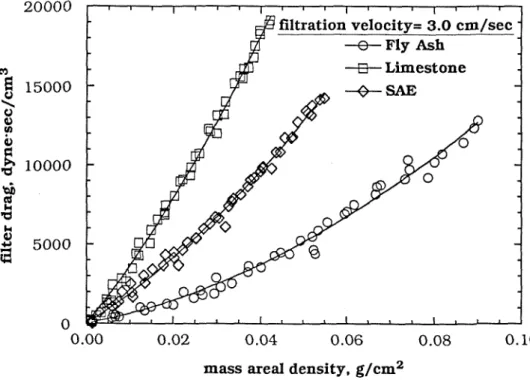
FIGURE 4. Filter drag versus mass areal density for fly ash, limestone and SAE fine dust at the filtration velocity
filtration system was severe when the filtra- tion velocity was low. This led to a smaller MMAD for smaller filtration velocity as shown in Table 1. Average MMAD for dif- ferent filtration velocities for fly ash, lime- stone, and SAE fine dust is 6.28, 2.53, and 3.88 mm respectively.
The S-W curve can be divided into two regions: initial cake developing region and uniform cake region. In the initial region, the filter drag increases as particles are cap- tured on the filter. The increase of filter drag is dependent on the initial filtration mecha- nisms, filter material, and particle character- istics. When a uniform dust cake forms on the filter, the filter drag increases linearly with mass areal density.
An example of the S-W curve is shown in Fig. 4 for fly ash, limestone, and SAE fine dust when the filtration velocity equals to 3 cmlsec. It can been seen that the S-W curve for fly ash has a clear initial region, but the region is not very obvious for limestone and
SAE fine dust. This is because when the pore diameter of the filter is small relative to particles size, the pores can be filled up faster at a given mass areal density (Gupta et al., 1993; Novick et al., 1992; Japuntich ct al., 1994). In Table 1, it can be seen that the K, increases as particle size decreases. At the same filtration velocity, limestone has the highest K, since it is the smallest in size among the three dust materials. Also Table 1 shows that for the three test dusts tested, higher filtration velocity results in a smaller porosity but higher K, value.
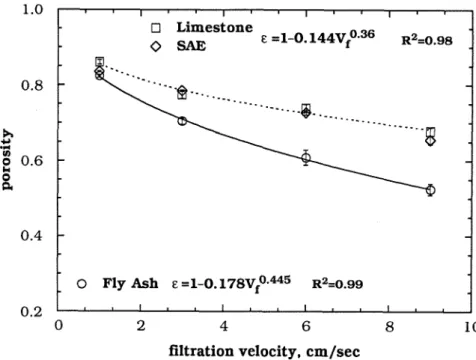
Figure 5 shows the relationship between the filtration velocity and the dust cake po- rosity of fly ash, limestone, and SAE fine dust. It is seen that the dust cake porosity decrease with an increasing filtration veloc- ity for all three test dusts. At higher filtration velocity, larger fraction of particles will be compressed deeper into the cake when fluid drag force overcomes particle adhesion force. Despite their smaller sizes, irregular
Aerosol Science and Technology
29:4 Octobcr 1998
Pressurc Drop through a Filter Dust Cake 323
filtration velocity, cmlsec
FIGURE 5. The relationship between filtration velocity and dust cake porosity for fly ash, limestone and SAE fine dust.
limestone, and SAE fine dust particle have larger dust cake porosity than spherical fly ash particles. The possible reason could be due to the more random arrangement of irregular particles in the dust cake than the spherical particles. This confirms that the dust cake porosity also depends on the shape of the particle. Two empirical equations to express the relationship between the filtra- tion velocity and the dust cake porosity are developed as
E = 1 - 0.178
q.445,
R'= 0.99, for fly Ash (9a)
= 0.98, for Limestone and SAE (9b) where the unit of V, is cmlsec. These two empirical equations are suitable for filtration velocity ranging from 1 to 9 cmlsec. When determining the theoretical K2 values, knowledge of the dust cake porosity and its dependence on filtration velocity, such as Eqs. (9a) and (9b), is very important.
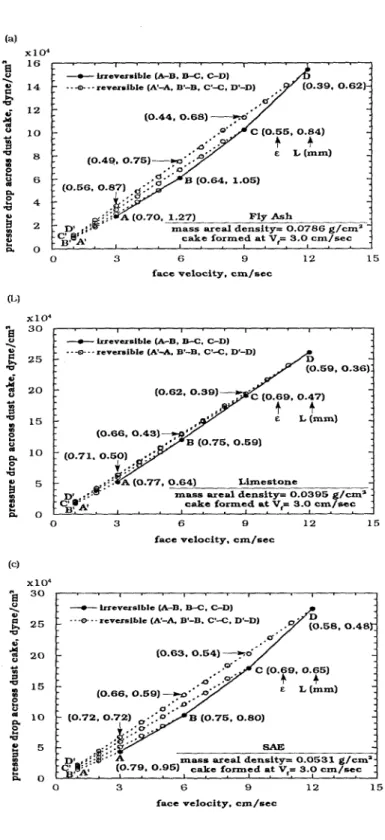
The compaction characteristics of the dust cake was examined further by measuring the pressure drop across an uniform dust cake when it is subject to clean air at face veloc- ities different from the filtration velocity used to form the dust cake. The results are shown in Figs. 6a - 6c for fly ash, limestone, and SAE fine dust respectively. In Fig. 6a, the dust cake was formed at filtration veloc- ity of 3 cm/sec, where the pressure drop shown at point A in the figure is 2.6 X lo4 dyne/cm2. As the clean air is drawn through the cake at a face velocity smaller than 3 cmlsec, it is seen that the pressure drop de- creases linearly with decreasing face velocity as shown by the dashed line AA'. This indi- cates the dust cake may expand elastically from that formed at higher filtration veloc- ity. By increasing the face velocity from 1 cmlsec at point A' to 3 cm/sec at point A does not change the characteristic of the dust cake so that the pressure drop increases along the same dashed line A'A. This further confirms that the dust cake compaction is
324 C.-J. Tsai and Y.-
N
Cheng Aerosol Science and Technology 29:4 October 1998 (31 x104-
-
4mass areal density= 0.0786 g/cmz 1
cake formed at V,= 3.0 cm/sec :
I . . , . . , . . , . .
0 3 6 9 12 15
face velocity, cm/aec
(L)
x104
--t Lrevcrrrible (A-B. B-C. C-D)
- -
-3- -.
reversible ( A l h B'-B. C'-C. D'-D)Limestone
mass areal density= 0.0395 g/cma cake formed at Vf= 3.0 cm/sec
0 6 12 15
face velocity, cm/sec
(a
x104
: --t- irreversible (A-B. B-C. D D )
0 3 6 9 12 15
face velocity. cm/sec
FIGURE 6. The compressibil- ity characteristic of dust cake at different clean air face veloc- ities. (a) fly ash, (b) limestone, (c) SAE fine dust. First and sec- ond number in the parenthesis is the porosity and thickness re- spectively.
Aerosol Science and Technology 29:4 October 1998
Pressure Drop through a Filter Dust Cake 325
~ 1 0 ~
Kozen y-Carman
0 2 4 6 8 10 12
experimental KS, sec-l X ~ O ~
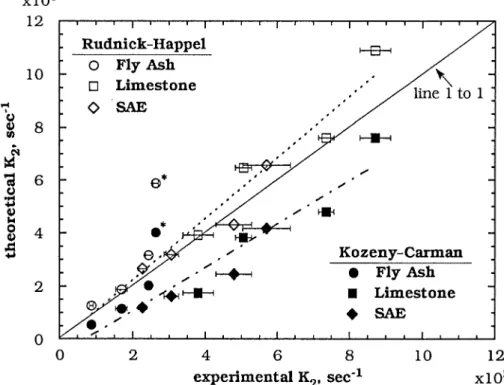
FIGURE 7. Comparison of the experimental K, values with theoretical predictions using Rudnick-Happel (open symbols) and Kozeny-Carman (filled symbols) equations. (*:exceptional data point for fly ash particles at the filtration velocity of 9 cmlsec)
elastic as long as the clean air face velocity is below the cake-forming filtration velocity.
However, if the clean air face velocity in- creases from 3 cmlsec (point A) to 6 cmlsec (point B), then the porosity of the dust cake becomes smaller as witnessed by a greater slope of line AB compared to that of line A'A. This observation is consistent with Fig. 5 that shows a similar trend that higher fil- tration velocity yields a less porous dust cake. Continuing the experiment by decreas- ing the clean air face velocity from 6 cmlsec (point B) to 1 cmlscc (point B') along BB', it is seen that the pressure drop decreases lin- early with decreasing velocity. However, the slope of line BB' is greater than that of line AA', indicating that a portion of the dust cake may have been compacted irreversibly as face velocity increases from point A to B.
Again, increasing the face velocity from B' to B does not change the slope of the pressure
drop line. This also indicates the recovery of the portion of the dust cake that is under elastic compaction. At even high face veloc- ity, 12 cmlsec, similar compressibility char- acteristics can be observed in Fig. 6a. For limestone and SAE fine dust, similar behav- ior of dust cake compaction also appears as in Fig. 6b and 6c respectively.
It is important to have a proper K, model that predicts pressure drop accurately to fa- cilitate the design of a baghouse. The poros- ity of the dust cake shown in Fig. 5 taking into account of the effect of filtration veloc- ity was used to calculate the theoretical K2 values by Rudnick-Happel equation, Eq. (7),
and Kozeny-Carman equation, Eq. (6). In Eq. (6), the Sauter diameter D,, was calcu- lated as (Hinds, 1982)
Dvs = DM,, exp ( - 0.5 ln2 a,) (10)
326 C.-J. Tsai and Y -H Cheng Aerosol Science and Technology
2 9 4 October 1998
filtration velocity, cmfsec
X ~ O ~
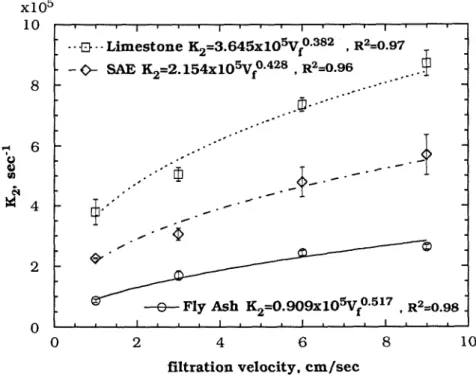
FIGURE 8. The relationship between filtration velocity and K, for fly ash, limestone and SAE fine dust. 8 y f 3 - 0
S
E 4
2 0Figure 7 compares the experimental K, values with theoretical predictions using Rudnick-Happel equation (open 5ymbols) and Kozeny-Carman equation (filled sym- bols). Herein, it can be seen that the predic- tion of K, values by Rudnick-Happel equa- tion is more accurate than the Kozeny- Carman equation. Excluding the data points for Ay ash at the filtration velocity of 9 cm/ sec, the Rudnick-Happel equation overcsti- mates the experimental K, values by no more than 16% for the three tested dusts, which is much better than the Kozeny-Car- man equation that underestimates the ex- perimental K, by as much as 35%. Much grcater overestimation of about 120% oc- curs for the Rudnick-Happel equation when the dust cake porosity is smaller than 0.6 for fly ash at the filtration velocity of 9 cmlsec. The exact reason why the Rudnick-Happel equation is unable to predict K, values at this high filtration velocity accurately is un- known. It is speculated that nonuniform po-
l o m ~ ~ ~ ~ ~ ~ ~ , ~ . ~ , l ~ ~ l ~ ~ ~
-
- - E l 0. Limestone ~~=3.645x10%f0.~~~ , ~~30.97- -
+
SAE K2=2. 1 5 4 ~ 1 0 % ? ~ ~ ~ , ~ ~ = 0 . 9 6. .
,_..-..
IP
-
-
.--
..--
.,,jj..-,-'
. .--
. .
.
.
..'
,.
_ / . -
.:'.
cp
id
.
_ . - - -
. .
1
fl-
0
i
-
-
-e-
Fly Ash ~~=0.909x10%f0.~~~ , ~ ~ ~ 0 . 9 8:
I I I , I I I I I a ~ ~ I ~ ~ ~
rosity distribution across the thickness of the cake may have occurred for the cake that is formed at high filtration velocity.
The relationship between the filtration ve- locity and the specific dust cake resistance coefficient, K,, for fly ash, limcstone, and SAE fine dust are shown in Fig. 8. According to the experimental data, the relationship between the filtration velocity and the spe- cific dust cake resistance coefficient, K,, for fly ash, limestone, and SAE fine dust can be expressed as
0 2 4 6 8 1 0
= 0.98 for Fly Ash
= 0.97 for Limestone
= 0.96 for SAE
Aerosol Science and Technology 29:4 October 1998
Pressure Drop through a Filtcr Dust Cake 327
where the unit of V, is cm/sec a n d that of K,
is scc-l. In this study, n for fly ash is found to 0.52, which is close to the values of Spaite and Walsh (1963) and Dennis and Dirgo (1981).
These three empirical equations are suit- able for the filtration velocity ranging from 1 to 9 cmlsec and MMAD from 5 pm to 7 pm for fly ash, 2 pm to 3 pm for limestone, and 3 pm to 5 pm for SAE finc dust. From these equations, it can be seen that for fly ash, an increasing filtration velocity leads to more increase in I(, than both limestone and SAE fine dust as is evident from the values of the exponent n. This is maybe due to the fact that spherical fly ash particles are more ame- nable to compaction than irregular limc- stone and SAE finc dust particles at a given filtration velocity. Such speculation can also be seen from Fig. 5 where it shows the change of the porosity with increasing filtra- tion velocity for fly ash is more drastic than that of limestone and SAE fine dust.
CONCLUSIONS
This study has investigated the dust cake porosity, specific dust cake resistance coef- ficient, and compressibility of dust cake for Ay ash, limestone, and SAE fine dust. Lab- oratory experimental system has been set up to facilitate accurate measurement of the dust cake porosity. It has been found that K2 increases as particle size decreases, or when the filtration velocity increases. At the same filtration velocity, limestone has the highest
K? since it is the smallest in size among the three dust materials.
From the experimental results, the dust cake is seen to be irreversibly compressed during filtration. The fraction of the dust cake undergoes irreversible compaction is seen to increase with increasing filtration velocity. At higher filtration velocity, the dust cake is compacted more resulting in a smaller dust cake porosity and a larger K,
value.
Despite their smaller sizes, irregular lime- stone and SAE fine dust particles have larger dust cake porosity than spherical fly ash par- ticles. The possible reason could be due to
the more random arrangement of irregular particles in the dust cake than the spherical particles.
In this study, the prediction of K, values by Rudnick-Happel equation is more accu- rate than the Kozeny-Carman equation. The Rudnick-Happel equation overestimates the experimental K2 by no more than 16% for the three dusts tested.
The ~ i u t h o n would like to thank the Taiwan National Science Council ofthe Republic of China for the financial suppot-t under Contmct No. NSC 8.5-2211-E-009-012
References
Borgwardt, R. H., and Durham, J . F. (1967). Fac- tors Affecting the Pcrformancc of Fabric Fil- ters. Paper presented at the 60th Annual Meet- ing of the American Institute of Chemical Engineers, New York, Nov. 29.
Dennis, R., and Dirgo, J. A. (1981). Comparison of Laboratory and Field Derived K, Values for Dust Collected on Fabric Filters, Filtration and Separation 18:394-417.
Dennis, R., Klemm, H. A., and Battye, W. (1979).
Fabric Filter Model Sensitivity Analysis. GCAJ
Technology Division, EPA-60017-79-043c, pp. 40 -5 1.
Gupta, A,, Novick, V. J., Biswas, P., and Monson, P. R. (1993). Effect of Humidity and Particle Hygroscopicity on the Mass Loading Capacity
of High Efficiency Particulate Air Filtcrs,Aem- sol Sci. and Technol. 19:94-107.
Happel, J. (1958). Viscous Flow in Multiparticle Systems: Slow Motion of Fluids Relative to Beds of Spherical Particles, AIChE J. 4:197- 201.
Hinds, W. C. (1 982). Aemsol Technology: Proper- ties, Belzuvio~; and Mcasuremcmt of Airborne Particles, Wiley, New York.
Japuntich, D. A,, Stenhouse, J. I. T., and Liu, B. Y. H. (1994). Experimental Results of Solid Monodisperse Particle Clogging of Fibrous Fil- ters, J. Aerosol Sci 25385-393.
Klemm, H. A., Dirgo, J. A,, and Dennis, R. (1980). Fabric Filtration Anulyses for Three Util- ity Boiler Flyaslzes. EPA-60017-80-157.
Liu, B. Y. H., Pui, D. Y. H., Rubow, K. L., and Szymanski, W. W. (1985). Electrostatic Effects
328 C.-J. Tsui and Y -H Cheng
in Aerosol Sampling and Filtration. Ann. Oc- cc~p. Hyg. 22:25 1-269.
McKenna, J. D., and Turner J. H. (1993). Fabric
Filter Bughouse I, ETS, Inc., Roanoke, VA.
Novick, V. J., Monson, P. R., and Ellison, P. E. (1992). The Effect of Solid Particle Mass Load- ing on the Pressure Drop of HEPA Filters, J. Aerosol Sci. 23:657-665.
Rudnick, S. N., and First, M. W. (1978a). Third
Symposium on Fabric Filteers fbr Particulate Col- lection, EPA-60017-78-007, pp. 251-288.
Rudnick, S. N., and First, M. W. (1978b). Pro-
ceedings of the 71" Annual Meeting of the Air
Aerosol Science and Technology 29:4 October 1998
Polhtion Control Association, Paper No. 78-
62.7. June 25-30, Houston, Texas.
Spaite, R. H., and Walsh, G. W. (1963). Effect of Fabric Structure on Filter Performance. '4rner. Ind. Hyg. A ~ o c . J. 24: 357-355.
VanOsdeli, D. W., Donovan, R. P., Furlong, D. A., and Hovis, L. S. (1984). Fourth Sympo-
sium on the Transfer and Utilization of Purticu- lute Control Technology, EPA-60019-84-025a,
pp.342-356.
Received July 18, 1997; accepted June 1, 1998.