ELSEVIER
Ewrgy foliq Vol. 24. No. 3. pp. 221-228. 1996 Copyright 8 1996 Elsevier Science Ltd Printed in Great Bntain. All rights reserved
0301-4215/96$15.00+0.00
0301-4215(95)00133-6
The CO, mitigation options for the
electric sector
A case study of Taiwan
Hsunling Bai and Jong-Hourm Wei
Institute @Environmental Engineering, National Chiao-Tung University, 75, Po-Ai Street, Hsin-Chu, Taiwan
A linear programming model is presented to evaluate the effectiveness of possible CO2 mitigation options for the electric sector. The options being considered are fuel alternatives, energy conserva- tion, reduced peak production, improved electric efficiency and CO2 capture technologies. The results indicate that energy conservation can significantly reduce CO2 emissions only when com- bined with reduced peak production and improved electric efficiency. The cost effectiveness of in- stalling CO, capture and disposal devices was compared to that of fuel alternative plan. It is concluded that the installation of CO2 capture and disposal devices can be an effective and eco- nomic option.
K~Iww&: CO? control strategies; Fuel alternatives; CO, capture technologies
The global warming problem is raising international con- cerns among developed and developing countries. As esti- mated by the Intergovernmental Panel on Climate Change (IPCC. 1990), CO, is the most important greenhouse gas, making over one-half of the contribution to climate change. After the Earth Summit, many countries in the Organization for Economic Cooperation and Development have pub- lished their preliminary national polices on CO2 emission reductions, with decisions fixing the amount of CO, emis- sion in the year 2000 to at least no more than that in 1990. For example, the USA and Canada tend to hold their total CO2 emissions in 2000 to earlier (eg 1990) level of emis- sions, while Japan and France will fix their COZ emissions on a per capita basis.
For countries not listed in the Annex I parties of the IPCC, the Climate Change Convention does not have a rig- orous restriction on the levels of their CO, emission reduc- tions. This indicates that CO, emissions in 2000 may not necessarily be reduced to the level of 1990 for less devel- oped countries and newly industrialized countries. How- ever, for newly industrialized countries such as Taiwan, the impact of adopting CO2 mitigation options on the economic growth rate is still a primary concern of our energy policy.
It is well known that the damage induced by climate change can only be estimated with huge uncertainty. The ef- fectiveness of CO, control strategies as well as their eco- nomic impacts can also be estimated only within a large range of uncertainty. Therefore, studies on the CO, mit- igation options are usually limited to evaluating their indi- vidual effectiveness (Blok et al, 1993; Yamaji et al, 1993; Huang, 1993; Herzog, 1994). Recently during the revision of this paper, several papers have been published which ad- dress the cost-effectiveness of CO, control strategies (Morthorst, 1994; Maya and Fenhann, 1994; Amous et al,
1994; Mahgary et al, 1994; Halsnses et al, 1994). They re- ported that negative marginal abatement costs are possible via the employment of appropriate CO, control options. These options include energy conservation, fuel substitu- tion, use of renewables, increasing of GHG sinks etc.
In this paper, a multiobjective linear programming model is proposed to assist in evaluating the cost impacts of several possible CO* mitigation options for the elec- tric sector as well as the associated CO, emission reduc- tions. With the base year of 1990, this model is applied to study the best short-term (to the year 2000) solution for Taiwan’s electric sector in order to accomplish maximum
222 CO, reduction,fbr the electric sector in Taiwan: H Bai and J-H Wei
possible CO2 reduction with minimum cost. The CO, emis- sion data are presented as per capita emissions.
Mitigation options
CO, control strategies for the electric sector may include one or more of the following options: a carbon tax, CO2 emission standard, fuel alternatives, electric energy conser- vation, reduced peak production, improved electric effi- ciency and CO, capture technologies. The employment of a tax policy and CO, emission standard are regulations but not the actual means which lead to CO* emission reduction. The carbon tax and CO2 emission standard as determined by the government depend on the cost-effectiveness of other CO, mitigation options. They are therefore not con- sidered in this study. The CO, mitigation options evaluated in this paper are fuel alternatives, electric energy conserva- tion, reduced peak production, improved electric efficiency and CO, scrubbing devices. These options are described below.
Fuel alternatives
Fuel substitution can be done for both existing and new power plants. It is achievable for existing plants but with high retrofit costs. The cost for retrofitting a power unit may be even higher than that for installing a new power unit, while a fuel alternative plan for new power plants is easier and economic to accomplish. Although power gener- ation by hydropower and other renewable energy emits no CO,, it would be difficult to drastically increase the per- centage of power generation by renewable energy in a short period. Therefore the focus of fuel alternative options will aim at an optimization of new fossil fuel tiring units, and adoption of a new 2000 MW nuclear plant.
Electric energy conservation
The definition of energy conservation from the electric sec- tor is that it is a measure which leads to a decreased con- sumption of electricity but does not reduce the level of the activity for which the electricity is used. Electricity energy consumption in 1990 was 8.7 x lOto kWh in Taiwan. The associated CO, emission was about 36 Mt from the electric sector, which accounted for about 3 1% of the total CO, emission in 1990. Projected electricity energy demand is
14.8 x 10¹⁰ kWh in 2000. As a result of comparison be- tween Taiwan and other developed countries on the gross national product per unit of electricity used (GNP/ GWh) (Taiwan Energy Statistics, 1993; International Energy Statistics, 1992) a maximum energy conservation rate of 35% is achievable in the long term. But in the near future such as in 2000, the energy conservation goal rate as desig- nated by the Taiwan government is around 10% (Tzeng, 1992). In this study an electric energy conservation rate of O-20% is employed to evaluate its effectiveness in CO, emission reduction.
Reducedpeakproduction
The total installed nameplate capacity for new units is re- duced by a reduction of peak production; it is therefore also possible to reduce CO, emission. However, it requires some incentives such as time zoning of the electricity charge. The range of reduction rate on the peak production employed in this study is O-1 0% (Wei, 1994).
Improved electric @ciency
Electric efficiency can be improved by an increase in ther- mal efficiency and in the operation efficiency of the power plant. Since a significant improvement in thermal efftci- ency in the near future is not easy and its associated cost is difficult to estimate, the present paper aims at studying the effect of improving power plant operation efficiency on CO, emission reduction, which requires a negligible cost as compared to a power unit installation cost. As a result of better training of power plant operators, the pos- sibility of power unit malfunction due to human factors is greatly reduced, and the capacity factor of a power unit is thus increased. A possible range of 0- IO% (Tzeng, 1992) for improving electric operation efficiency is used in this study.
COz removal technologies (end ofpipe option)
Available CO, removal technologies are liquid solvent (eg MEA) scrubbing, solid adsorbents, separation processes, and CO, recycle etc (Booras and Smelser, 1991; Kreith et al, 1991). Although CO, emissions from thermal plants could be reduced significantly by the above technically feasible processes, the costs are enormous and uncertain. Given the lack of local CO, treatment data for Taiwan, the results of recent studies on the CO2 treatment and disposal costs from other countries are evaluated.
The engineering contractor Bechtel in the UK (Rose, 1993) estimated that the total cost, including CO, capture in the power plant and its disposal in the ocean, would be US$3&I 80 per tonne of avoided carbon emissions, while the cost, as estimated in a US study (Herzog, 1994), ranges from US$l8 to USS37 per tonne of CO, captured for various types of power plant, and the CO, disposal costs were estimated to be US$l5-50 per tonne of CO, disposed. Therefore, the total costs of CO, treatment and disposal were in the range of US$33-87 for every tonne of avoided CO* emission. These studies concluded that CO* capture and disposal techniques, although technically fea- sible, are still too expensive to be used as a CO, mitiga- tion option.
System optimization
The conflict between economic development and environ- mental protection is always a subject of argument. The electric power company tends to select the option that leads to a minimum power generation cost, but environmentalists
CO, t-edtrction,fbr the electric sector in Taiwan: H Bai and J-H Wei 223 will force them to choose the one that causes minimum
damage to the environment. Therefore there are two objec- tives in this study.
The first objective is the economic approach which is to minimize power plant installation and operation costs; the second objective is the environmental approach to mini- mize COz emission from the electric sector. However, as a result of conflict, the final decision may fall somewhere be- tween these two objectives. The multiobjective linear pro- gramming model is then to,
4 3 Minimize Z, = ~~CjNj, r=l /=I (1) Minimize Z, = k$ RiNij
(2)
i=l j=[ whereZ, = new power plant installation cost Z, = CO, emissions from new installations Ci = generation cost of unit i
Nij = electricity generation of new unit i designed for load j
T = total installed nameplate capacity Lb = lower limit of base load generation ratio U, = upper limit of base load generation ratio L, = lower limit of middle load generation ratio U,,, = upper limit of middle load generation ratio Lp = lower limit of peak load generation ratio UP = upper limit of peak load generation ratio Wj = installed nameplate capacity from hydro
power and renewable energy
eii = installed nameplate capacity of existing unit i for load j
nii = installed nameplate capacity of new unit i for load j
Ri = CO2 emission per unit of power generation i = I : coal-tired unit
i = 2: oil-fired unit i = 3: LNG-fired unit i = 4: nuclear fuel unit i = 1: base load j = 2: middle load j = 3: peak load
The above two models are subject to the following con- straints:
(3) Satisfaction of peak production and reserve margin:
T>P(I +B) (8)
where
P = peak production
B = percent reserve margin, 20% used in this study
(4) (I) Satisfaction of electricity demand in 2000:
J .i
x.@,j+N;,)+W= D (3)
;=I j=l
Relationship between installed nameplate capacity and energy generation:
where
Eii = electricity generation of existing unit i for load j
Ei=ei*h*J~
Ni = ni * h *,1; where
W = percentage of power generation from hydro power plants and renewable energy (esti- mated as 10% of total power generation in this study)
h = hours per year (= 8760 hr)
,fi =
capacity factor of plant iD = electricity demand (5) Non-negative decision variables:
(2) Satisfaction of base, middle and peak load requirement:
4
T*L,<~(ei,+ni,)+W, IT*U,, (4)
i=l
NV20,nj20
Results and discussion
Fuel alternative plan T*L,~,~~(ei2+ni?)+W2ST*U,,i=l
(5) Table I shows the results of CO, emissions in 2000 and as- sociated new power unit installation costs. Results are
T*Lp4i(ei3+ni,)+W3ST*Up i=l (6) (7) where (9) (10)
224 CO, tvduclion,fbr the electric seclor in Taiwan: H Bai and J-H Wei
Table 1 Predicted results of CO, emissions in 2000 and corresponding new power unit costs based on fuel alternative plan
Without nuclear plant With nuclear plant
Minimize Mlnimlze CO, Minimize
cost emission cost
Total CO, emission ( IOh Mt) 89.6 77.8 78.5
Per capita CO, increase 127 97 99
rate (%) (compared to 1990)
CO? emission reduction rate Base case 13 I2
(X) (compared to base case)a
Total cost for new units (I 06 US$) 3800 4700 3700
Cost in US per tonne of CO, Base case 76 -9
avoided (compared to base case)
Minimize CO, emission 67.3 70 25 4600 36
aThe base case is the uncontrolled emission in the year 2000, ie 89.6 Mt.
shown in terms of two objectives (minimizing cost and minimizing CO2 emission) under conditions of with and without a 2000 MW nuclear plant installation. For the case with the objective of minimizing the new unit cost but with- out a new nuclear plant, the total CO, emission is 89.6 Mt, which corresponds to a 127% increase of per capita CO, emission as compared to 1990. This is the uncontrolled amount of CO2 emission in 2000 from the electric sector, and will be used as the base case for comparison. If the ob- jective were to minimize the CO, emission, the correspond- ing CO, emission increase rate would be 97% on a per capita emission basis. This is about a 30% per capita emis- sion reduction as compared to the uncontrolled emission.
If the proposed 2000 MW nuclear plant can be installed and operated by 2000, the CO, emission increase rate is 99% on a per capita emission basis with the objective of minimizing cost. The amount of COZ.emission reduction achieved by a 2000 MW nuclear plant IS about the same as that by a fuel alternative plan based on minimizing the CO, emission. Therefore, if the objective of minimizing CO, emission is in conjunction with a new nuclear plant, the CO, emission reduction rate is about doubled.
In order to evaluate the cost-effectiveness of the fuel al- ternative plan, the costs per tonne CO, avoided were calcu- lated from the differences of the costs of new unit installa- tion and the amounts of CO, emission from the case of uncontrolled emission. The results are shown in the last row of Table 1. It is seen that for the case of minimizing cost and in conjunction with a new nuclear plant, the cost of CO, emission reduction is negative. For every tonne of CO, avoided, the benefit is US$9 as compared to the base case. This is due to the low power generation cost for a nuclear plant as compared to other thermal plants, and is one of the reasons why Taiwan’s government plans to have a nuclear plant installed by 2000. However, a huge number of people in Taiwan are objecting to the nuclear plant, which may overturn it. If a new nuclear plant is not possible, the marginal cost of CO, reduction is about US$76 with the ob- jective of minimizing CO, emission.
Energy conservation
Since uncertainty remains as to whether one more nuclear
plant will be built in Taiwan, the following discussion will focus on conditions without a new nuclear plant. Figure I shows the CO, emission reduction rates as achieved by
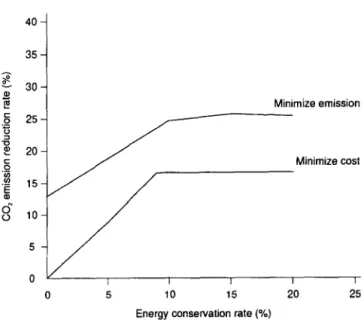
electric energy conservation. The cost of energy conserva- tion was not considered in this study. The base case of 0% CO* emission reduction is obtained from the uncontrolled emission as discussed previously. The two curves shown in Figure I represent the two objectives of minimizing CO, emission and minimizing unit installation cost respectively. As can be seen for an energy conservation rate less than around IO%, an increase in the energy conservation rate does yield an increase in the CO* emission reduction. How- ever, as the energy conservation rate increases to larger than IO%, its effectiveness on the CO2 emission reduction disap- pears. This is due to constraints on the satisfaction of the peak production as well as the percentage requirement of each load. Although electric energy is conserved to a cer- tain degree, the peak production as well as the loading per- centages may not be satisfied at the same time. Therefore, the same capacity of new power units may be required al- though electric energy is conserved. As a result, the poten- tial amount of CO2 emission may not be changed.
40 1 35 i T ; 30 E i Minimize emission .: 25 4 P 20 s ‘5 .” E 1.5 N s 10 5 Minimize cost 0 I I I I I 0 5 10 15 20 25
Energy conservation rate (%)
Figure 1 The CO, emission reduction rate in 2000 as compared to uncontrolled emission achieved by electric energy conservation
CO, reductiotzfor the electric sector in Taiwan: H Bai and J-H Wei 225
Minimize emission
r
ov
I I I I I0 5 10 15 20 25
Energy consetvation rate (%)
Figure 2 The CO, emission reduction rate in 2000 as compared to uncontrolled emission achieved by electric energy conservation plus 10% reduction on peak production
Energy conservation and reducedpeakproduction
The effect of 10% reduction on peak production along with the energy conservation on the CO, emission reduction is shown in Figure 2. It is seen that under the objective of minimizing CO, emission, the CO;! emission reduction rates for energy conservation rates less than 10% are the same as the results shown in Figure I. While the energy conservation rates are higher than IO%, a continuous CO, emission reduction is observed in Figure 2. This was not seen in Figure I without simultaneous reduction of peak production. A similar observation is seen for the objective of minimizing the cost of new installations.
Improved electric @‘iciency
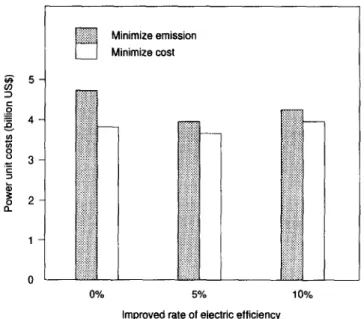
Figure 3 shows the effect of improving electric operation efficiency on the CO;! emission reduction. The increased rates of electric operation efficiency under consideration are O%, 5% and IO%, respectively. The CO, emission is slightly reduced under a 5% improvement of electric opera- tion efficiency. However, if the improved rate of electric op- eration efficiency was IO%, the CO, emission may be even higher than that without any improvement. The benefit of improving the electric operation efficiency lies in the fact that it may reduce the cost of new power units. As indicated in Figure 4. the cost for new power units has its minimum value at a 5% improvement in the electric operation effr- ciency. whether the objective was based on minimizing CO* emission or minimizing cost. The new unit cost under a 10% improvement in electric efficiency is higher than that at 5%, but still lower than that at 0%. This is due to the con- straint on the satisfaction of peak production, although an improvement in the electricity operation efficiency yields a higher value of electricity supply under the same unit in- stallation capacity. However, the peak production must be
20 0
:$;is, Minimize emission
E3
Minimize costImproved rate of electric efficiency
Figure 3 The CO, emissions in 2000 as achieved by increasing electric operation efficiency
satisfied at the same time, and more power units may still be needed, which results in increases in the CO, emission and power generation costs.
Combination
qf
the optionsIt has been shown previously that the options of energy conservation, reduced peak production, and improved elec- tric efficiency may not yield a profound reduction on the CO, emission if only one of them is imposed on electric utilities. Under some cases the potential CO, emission from each option may even increase. However, when the three options are combined, the results are different. According
5%
Improved rate of electric efficiency
Figure 4 The costs of new power unit installation in 2000 as achieved by increasing the electric operation efficiency
226 CO, reductiotzfor the electric sector in Taiwan: H Bai and J-H Wei
to the designated goal in 2000 by the Taiwan Council of
Energy Commission Ministry, the energy conservation can
be achieved at a rate of 10% and the reduced rate of peak
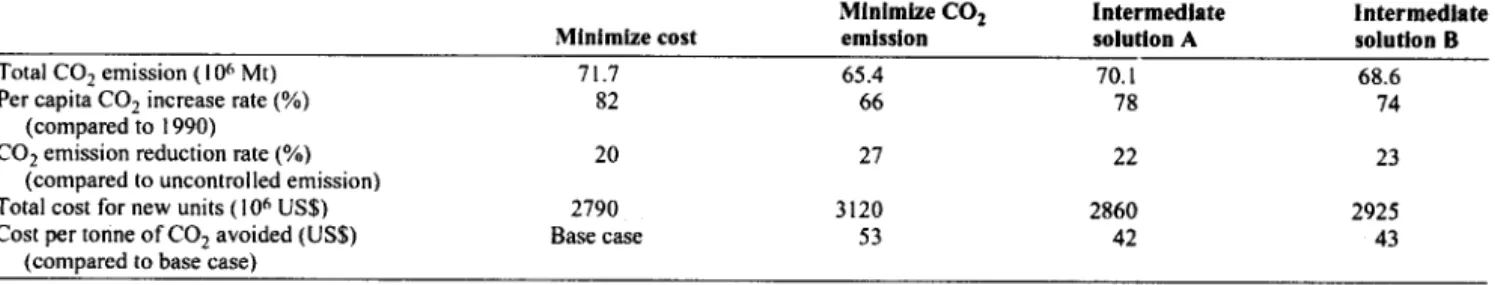
production will be 10%. Table 2 shows the results on the
combined option of the designated goal plus a 5% increase
in the electric operation efficiency in 2000. The total
amounts of CO, emission without an introduction of a nuc-
lear plant are 71.7 and 65.4 Mt, respectively, with the
objectives of minimizing cost and minimizing CO* emis-
sion. As compared to the uncontrolled emission (base case
shown in Table I), the CO* emission reduction rates are
20% and 27%, respectively, with the objectives of minimiz-
ing cost and CO, emission reduction. Compared to previ-
ous results on the individual effects of each of the three
options, the combination of these three options offers better
CO* removals and lower unit installation costs.
The results of intermediate solutions (A and B) on the
fuel alternative plan are also shown in Table 2; their CO2
emissions and unit installation costs fall between those
based on minimizing cost and minimizing CO, emission.
Using the objective of minimizing unit installation cost as
the new base case, the marginal costs of CO, reduction
were calculated for the other three solutions. The costs for
these three fuel alternate plans are US$42, 43 and 53 for
every tonne of CO, avoided, respectively, for intermediate
solutions A, B and the objective of minimizing COZ emis-
sion. These values are significantly lower than that of mini-
mizing the CO, emission shown in Table 1 without
introducing a new nuclear plant (USS76 per tonne CO*
avoided). Therefore if combination of the three options can
be achieved in 2000, the fuel alternative plan is a more cost
effective option for CO, emission reduction.
Cost efectiveness offiel alternative plan and
CO,
capture technologiesIs
the fuel alternative plan or is the installation of CO, cap-
ture devices an economic option for CO, emission reduc-
tion? The answer is clear if the alternative fuel is nuclear
fuel since it has the lowest power generation cost and emits
no COZ. However, due to social and political concerns, nu-
clear plants may not be built. If the alternative fuel is the
low CO2 emitted LNG or light oil, then the answer depends
on the cost effectiveness of the two options. The amounts of
CO* emission shown in Table 2 can be further reduced by
installing CO, capture and disposal devices. Since the ob-
jective of minimizing the unit installation cost was used as
the
newbase case, the marginal cost of CO, removal for the
base case is simply the CO, capture and disposal cost.
The marginal costs ofCO, removal for the other three solutions
were obtained from the differences of the total costs (in-
cluding unit installation and CO, capture and disposal
costs) and total amounts of CO* emission from the base
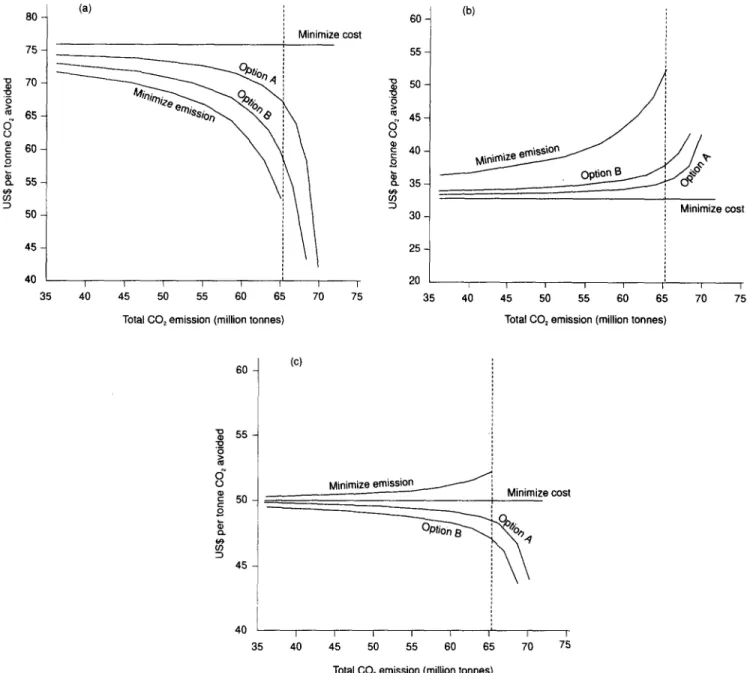
case. The results are shown in Figures 5a, 5b and 5c for
high, low and intermediate CO, capture and disposal costs,
respectively. The cost effectiveness is
shown as a functionof total CO, emission from the electric sector in the year of
2000.
The CO, capture and disposal cost was set to be at a high
value of USS76 per tonne of CO, removed in Figure 5a. It
is seen that the marginal cost of CO* removal was always
lower for the fuel alternative plan aimed at minimizing the
COZ emission. Therefore, it is economic to select the fuel
alternative plan which minimizes COZ emission instead of
CO, capture and disposal devices. However, as also indi-
cated as a dotted line in Figure 5a, the fuel alternative plan
results in the best achievement of 65.4 Mt of CO2 emitted to
the atmosphere. A further reduction of the CO, emission
must also rely on the CO2 capture devices.
On the other hand, the opposite results are shown in Fig-
ure 5b as the CO, capture and disposal cost was set at a low
value of US$33 per tonne CO, removed. The fuel altemat-
ive plan aims at minimizing the unit installation cost yields
the lowest cost for every tonne of CO, avoided. Therefore
in order to achieve the same amount of CO* emission re-
duction, it would be beneficial to select the fuel plan that
minimizes the unit installation cost, and then install CO,
capture devices to avoid the CO2 emission.
If the CO, capture and disposal cost is at an intermediate
value such as US$50 for every tonne of CO, removed, the
best solution turns out to be the fuel alternative options
which lies between minimizing cost and minimizing CO,
emission as indicated in Figure 5c. However, it is also seen
that if the total CO, emission in 2000 were to be held the
same as in
1990 (ie 36 Mt), the differences between each
option in terms of costs per tonne CO, avoided become less
significant.
Summary and conclusions
In this paper a linear programming model was presented
which is useful for studying the effectiveness of possible
Table 2 Predicted results of CO, emissions in 2000 and corresponding new power unit costs based on combined options of 10% energy conservation, 10% reduction on peak production and 5% increase in electric efficiency without the introduction of a nuclear plant
Minimize CO, Intermediate Intermediate
Mlnlmize cost emission solution A solution B
Total CO, emission ( 10” Mt) 71.7 65.4 70. I 68.6
Per capita CO, increase rate (%) 82 66 78 74
(compared to 1990)
CO, emission reduction rate (%) 20 27 22 23
(compared to uncontrolled emission)
Total cost for new units (IO” US$) 2790 3120 2860 2925 Cost per tonne of CO, avoided (US%) Base case 53 42 43
CO, reduction for the electric sector in Taiwan: H Bai and J-H Wei 227 j Minimize cost p 70- 0 0 ” 65 - s ? 60- 2 $ 55- : 50 - 40 I I I I / I I r 35 40 45 50 55 60 65 70 75
Total CO, emission (million tonnes)
60 i
(c)
45 50 55 60 65
Total CO, emission (million tonnes)
70 75
40 1 -i
Minimize cost
I I
35 40 45 50 55 60 65 70 75
Total CO, emission (million tonnes)
Figure 5 Marginal costs as achieved by fuel alternatives and CO, capture technologies in 2000. CO, capture and disposal cost is (a)
USS76, (b) US$33 and (c) US$SO per tonne of CO, capture
CO2 mitigation options for the electric sector. The model was applied to evaluate the best solution for Taiwan’s power plants in order to reduce the CO, emission in 2000 with minimum costs. The mitigation options being con- sidered were fuel alternatives, energy conservation, reduced peak production, improved electric efficiency, and CO, capture technologies. The results indicated that without considering cost effectiveness, fuel alternatives for new power units are an effective means of reducing the CO, emission. The options of energy conservation, reduced peak production, and improved electric efficiency may not yield a profound reduction on the CO, emission if em- ployed separately. However, by combining any of the re- duced peak production and improved electric efficiency with the energy conservation, the CO, emission as well as the new unit installation cost can be significantly reduced.
This also results in an increase in the cost effectiveness of the fuel alternative plan. The cost effectiveness of installing CO, capture and disposal devices and fuel alternative plans were also compared. It was seen that for a relatively low CO1 capture and disposal cost (less than about US%40 for every tonne of CO2 avoided), it may be beneficial to select the power units which bum high CO, emitted fuels, then in- stall the CO* capture and disposal devices to reduce the emission.
Acknowledgements
Support from the National Science Council, ROC through a grant number NSC 83-0410-E-009-024 is gratefully ac- knowledged. The authors would like to thank Miss G W Chang for assistance in preparing part of the illustrations.
228 CO, reductiort,fbr the electric sector in Taiwan: H Bai and J-H Wei
The results represent the views of the authors and do not
necessarily represent the options, policies or the recom-
mendations of Taiwan’s governmental agencies.
References
Amous, S, Revet, D and Sokona, Y (I 994) ‘Greenhouse gas abatement in
Senegal’ Energy Policy 22 (I I) 947-954
Blok, K, Worrell, E, Cuelenaere, R and Turkenburg, W (I 993) ‘The cost
effectiveness of CO, emission reduction achieved by energy conserva-
tion’ Energv Policy 21 (6) 656666
Booras, G S and Smelser, S C (1991) ‘An engineering and economic eval-
uation of CO2 removal from fossil-fuel-tired power plants’ Energy 16
(I I) 1295-1305
HalsntEs K, Mackenzie, G A, Swisher, J N and Villavicencio, A (I 994)
‘Comparable assessment of national GHG abatement costs’ Energy Pol-
icy 22 (I I) 925-934
Herzog, H (I 994) ‘CO, mitigation strategies: how realistic is the capture
and sequestration option?’ Paper 94-RA I 13.02, presented at the 87th
Annual Meeting and Exhibition of the Air and Waste Management As-
sociation, Cincinnati, Ohio, 19-24 June
Huang, J P (I 993) ‘Energy substitution to reduce carbon dioxide emission in China’ Energy IS (3) 281-287
/n/ernariona/ Energ_v Sta/is/its (I 992) Energy Commission Ministry of
Economic Affairs, Republic of China
IPCC ( 1990) Polices Makers Summary qf the Scienf$ic Assessment of Cli-
male Change Report to IPCC from Working Group, Meteorological Of- fice, Bracknell, UK
Kreith. F, Norton, P and Brown, P (1990) ‘A comparison of CO, emis-
sions from fossil and solar power plants in the United States’ Em&y 15 (12) IISI-II98
Mahgary, Y El, Ibrahim, A-F, Shama, M A-F, Hassan, A, Rifai, M A-H,
Selim, M, Gelil, I A, Korkor, H, Higazi, A, Amin, A, Bedewi, F and
Forsstrom, J (I 994) ‘Costs of CO, abatement in Egypt using both bot- tom-up and top-down approaches’ Energy Policy 22 (I I) 935-946
Maya, R S and Fenhann, J (1994) ‘Methodological lessons and results
from UNEP GHG abatement costing studies’ Energy Policy 22 (I I)
955-963
Morthorst. P E (I 994) ‘Constructing CO, reduction cost curves’ Energy
Policy 22 (I I) 964-970
Rose, J (1993) ‘Disposing of CO, from fossil-fueled power plants’ En-
vironmental Science and Technology 27 (7) 1282-I 283
Taiwan Energy Sfatistics ( 1993) Energy Commission Ministry of Eco-
nomic Affairs, Republic of China
Tzeng, S-H (I 992) The Energy Conservation Potential and Econom-
ical Assessment qfC0, Control Strategies Energy Report, April (in Chinese)
Wei, J-H (I 994) Short Term CO, Miligation Options for Electric Utilities
in Taiwan MS thesis, National Chiao-Tung University, Taiwan
Yamaji, K, Matsuhashi, R, Nagata, Y and Kaya, Y (1993) ‘A study on
economic measures for CO, reduction in Japan’ Energy Policy 21 (2)