太魯閣國家公園台灣水鹿(Rusa unicolor swinhoii)分布之預測
顏士清1 * 王穎1 歐恒佑2 1國立臺灣師範大學生命科學系 2國立台灣大學生態學與演化生物學研究所 (收稿日期:2010.4.12,接受日期:2010.5.21) 摘 要台灣水鹿(Rusa unicolar swinhoii)之數量在近年有增加趨勢,但國內目前對水鹿之分布情形仍不 十分了解,造成經營管理上的困難。本研究以太魯閣國家公園為樣區,進行穿越線調查獲得 181 筆水鹿分布資料,以地理資訊系統結合海拔、坡度、坡向、規整差植生指標、環境型態、與道路距 離、與水源距離等七項環境因子,利用軟體 DK-GARP 進行遺傳演算法之運算,建立台灣水鹿生態 區位模式及分布預測圖。結果顯示南湖山區、奇萊與磐石山區、陶塞溪流域、耳無溪流域等地為太 魯閣國家公園內最適合水鹿生存的地區,而合歡東峰及合歡北峰等地是未來水鹿可能擴散之區域, 但中橫公路帶來的干擾可能使其沿線較不適合水鹿生存。此外,太魯閣國家公園北側之和平南溪與 闊闊庫溪流域緊鄰園區內之水鹿熱點,但未受到生態保護區保護,未來應進行調查了解該區狀況。 本研究成功的預測太魯閣國家公園之水鹿分布情形,未來可應用到其他地區,以增加對本種之了解。 關鍵詞:水鹿、太魯閣國家公園、分布、遺傳演算法、生態區位模式
緒 言
水鹿(sambar deer, Rusa unicolor)廣泛分布在 南亞及東亞地區,包括中國、印度、斯里蘭卡、 尼泊爾、中南半島、印尼、海南島、馬來西亞、 婆羅洲及台灣等地,此外亦被引進至紐西蘭、澳 洲、美國、南非等國家。近三十年來,由於狩獵 及棲地破碎化的影響,水鹿數量在其原產國家中 已大量減少,儘管其分布仍廣泛,但各個族群之 數 量 往 往 很 少 , 常 面 臨 區 域 性 的 滅 絕 危 險 (Timmins et al. 2008.)。
台 灣 水 鹿 (Formosan sambar deer, R. u. swinhoii)屬於水鹿七個亞種之一,僅分布於台 灣,過去亦受狩獵及棲地破壞之影響導致數量大 量減少,但約在 1990 年代後,由於法律對本種 之保護、伐木業的停止、鹿茸價格下跌等因素, 台灣水鹿數量漸漸成長(Timmins et al. 2008.)。經 過此大量減少又重新擴增的過程,目前台灣水鹿 的分布以中央山脈及其周圍為主 (Wang et al. 2003),另根據民間登山記錄目擊水鹿情形,以北 三段至南二段的高海拔地區為目前所知水鹿分 布之熱點(Guo, unpublished data)。但這些研究受 人力、取樣方式等限制,只能提供較粗略的台灣 水鹿分布狀況,其詳細分布狀況在許多未調查地 區仍屬未知。 太魯閣國家公園範圍包括中央山脈北一段 至奇萊山區(北三段北段)、合歡山區、以及中央 山脈東側中低海拔山區,動物資源豐富,目前針 對太魯閣國家公園境內之調查顯示,在中央尖 溪、南湖山區、奇萊東稜磐石山區等地具有較多 的台灣水鹿族群(Lu 1983; Wu et al. 2004),但在 許多不易到達之地區仍缺乏台灣水鹿的調查資 料。 保育工作的落實與經營管理政策的決定,常 需仰賴對物種分布範圍的正確了解(Boitani et al. 2008),但山區面積廣大,全面性的野外調查極為 困難。近年來,學界發展出多種生態區位模式 (Ecological niche modeling)來評估生物可能的棲 地,生態區位模式係將記錄到物種出現的座標位 置與該地區的各種環境因子進行運算,評估各種 環境因子對該物種棲地選擇的影響,建立該物種 棲地選擇模式後,便可藉由各地區之環境因子來 評估該物種在各地區出現的可能性。目前已有多 種評估生態區位模式的軟體可供研究使用,如: BIOCLIM、BRT、DK-GARP、DOMAIN、GAM、 GDM、GLM、LIVES、MARS、MAXENT 等(Elith et al. 2006),這些軟體除可評估物種可能分布情 形外,亦被用來評估入侵物種的可能擴散趨勢、
氣候變遷對物種分布的影響、或是用來偵測新的 族群或物種等(Peterson et al. 2007)。
本研究將太魯閣國家公園野外調查所獲得 的台灣水鹿分布資料,與各種環境因子結合,以 軟 體 DK-GARP (genetic algorism for rule-set production)進行遺傳演算法運算,建立太魯閣國 家公園台灣水鹿生態區位模式及太魯閣國家公 園台灣水鹿分布預測圖,並結合文獻與野外調查 資料進行評估,製作太魯閣國家公園台灣水鹿實 際分布圖,最後藉以上結果對保育及經營管理政 策提出建議。
材料與方法
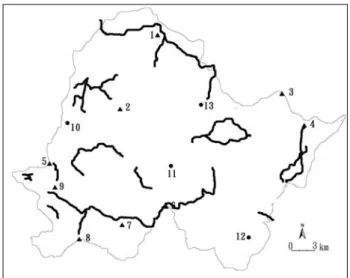
研究地區 太魯閣國家公園位於花蓮、臺中及南投三縣 境內,其範圍以立霧溪流域、中部東西橫貫公路 沿線及其外圍山區為主,包括合歡山區、奇萊連 峰(中央山脈北三段北段)、南湖中央尖山區(中央 山脈北一段)、中央山脈北二段、陶塞溪流域、清 水山及三棧溪流域等,面積共約 92,000 ha。海 拔高度從海平面到 3742 m,溫度隨海拔高度上 升而遞減,園內海拔 1,000 m 處之年均溫為 17.5℃,主要在中橫公路天祥以東一帶;海拔 2,000 m 處年均溫為 12.5℃,主要在慈恩以東; 接近中央山脈主稜之海拔 3000 m 以上高山地 區,其年均溫則為 7.7℃,冬季一、二月間溫度 常在 0℃以下。園內年雨量在 2,000 mm 以上, 夏季多雨,冬季較乾。植物相隨海拔上升,大致 依常綠闊葉林、針闊葉混合林、高山針葉林、玉 山箭竹矮灌叢等類群次序變化,常綠闊葉林植物 組成十分複雜,主要以樟科及殼斗科植物較為優 勢,針葉林則以雲杉、鐵杉、冷杉、二葉松等為 主,針闊葉混合林則兼有常綠闊葉林及針葉林之 植物,而玉山箭竹矮灌叢除玉山箭竹為優勢種 外 , 亦 常 有 圓 柏 及 杜 鵑 花 科 植 物 (Yang et al. 2004)。 台灣水鹿分布資料 本研究於 2008 年 3 月至 2009 年 5 月間進 行,於太魯閣國家公園內共劃設 20 條樣線(圖一) 進行穿越線調查,總長度約為 170 km,由於太 魯閣國家公園地形險峻多變,樣線主要沿登山路 線、獵徑、林道、溪流等劃設。 每次調查至少由兩名研究人員組成,研究人 員記錄樣線上之台灣水鹿目擊或其他痕跡出現 圖一、2008-2009 年太魯閣國家公園水鹿分布調查之 樣線分布。線條為穿越線路徑,1 為南湖大山,2 為無 明山,3 為曉星山,4 為清水山,5 為合歡北峰,6 為 立霧主山,7 為磐石山,8 為奇萊主峰,9 為合歡東峰, 10 為耳無溪,11 為立霧溪,12 為三棧溪,13 為陶塞 溪。Figure 1. The distribution of the transect lines in Taroko
National Park during 2008-2009. The bold lines denote the transect lines. The place names are: 1, Mt. Nanhu; 2, Mt. Wuming; 3, Mt. Xiaoxing; 4, Mt. Qingshui; 5, Hehuan North Peak; 6, Mt. Liwuzhu; 7, Mt. Panshi; 8, Mt. Qilai; 9, Hehuan East Peak; 10, Erwu River; 11, Liwu River; 12, Sanzhan River; 13, Taosai River.
情形,包括:叫聲、排遺、腳印、磨痕、屍骸等, 以 GPS 將 其 定 位 並 利 用 地 理 資 訊 系 統 軟 體 ArcGIS version 9.2 (Environmental Systems Research Institute, Redlands, CA, USA) 建檔。共 記錄到 181 筆台灣水鹿定位資料進行後續分析。 生態區位模式建立方法 我們使用遺傳演算法軟體 DK-GARP 預測台 灣水鹿的可能分布位置,DK-GARP 的運算過程 僅需使用動物出現(presence)的資料,不似傳統邏 輯回歸法必須要有動物不出現(absence)的資料才 能運算,在資料收集時免除了如何確認某地區無 目標物種的疑慮。 DK-GARP 利用動物出現的點位與該位置之 各種環境因子進行一連串的演算,使用 atomic rules, range rules, negated range rules, logistic regression 四種規則進行選擇、修正、合併、或拒 絕,最後計算出一個適合該物種生存的環境狀態 模式,亦即其生態區位模式。此法已成功運用在 許 多 研 究 上 (e. g., Illoldi-Rangel et al. 2004; Munguia et al. 2008),即使在樣本數較小時亦有
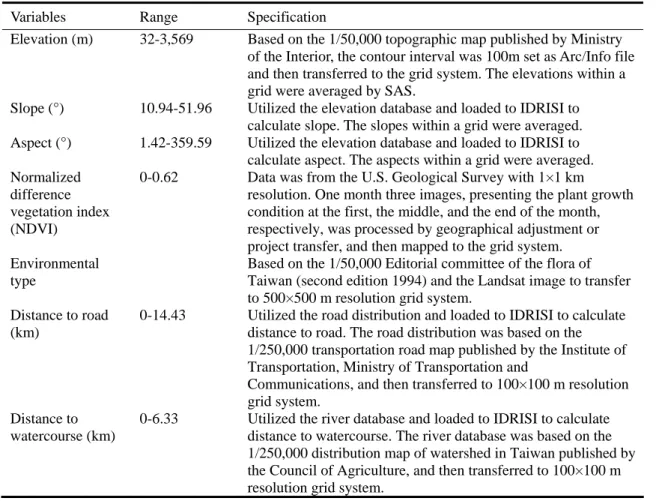
可信賴之預測結果(Stockwell and Peterson 2002)。 利用 ArcGIS 9.2 將太魯閣國家公園劃分為 100 × 100 m 的網格,使用 181 筆定位資料與其 網格中的七種環境因子進行運算,DK-GARP 軟 體隨機挑取 50%的定位資料用來建立模式(訓練 資料群,training dataset),另外 50%的定位資料 則用來測試該模式(測試資料群,test dataset),七 種環境因子包括:(1) 海拔:此因子可能影響氣 溫、太陽輻射、植被類型等多種環境因子;(2) 坡 度:此因子可能與動物對環境的偏好有關,Lee et al.(2006)指出台灣水鹿偏好坡度較平緩的地形; (3) 坡向:不同坡向之太陽輻射、濕度、溫度、 受風程度等都可能有所不同;(4) 規整差植生指 標 (normalized difference vegetation index, NDVI):此因子與綠色植物密度有關,因此可反 映出食物資源的豐富度或是植被類型的不同, Chang (2008)指出 NDVI 值與台灣水鹿的分布顯 著相關;(5) 環境型態:本研究將環境分為 11 種 類型,包括針葉林、闊葉林、針闊混淆林、松類 純林、箭竹與草生地、竹林、裸露地、水域、人 類建設、耕作地、其他,反映出各種不同的棲地 類型。李玲玲等(2006)指出台灣水鹿偏好鐵杉、 冷杉林、松類森林及其與草原交界等棲地類型; (6) 與道路距離:離道路越近的地區越容易受到 人類的干擾,可能會影響野生動物的分布與數 量;(7) 與水源距離:本因子與動物的生理需求 甚至社會行為有關,Lee et al.(2006)與 Wang et al.(2008)均指出接近溪流處台灣水鹿族群相對密 度較高(表一)。 由於 GARP 運算方式是讓各種規則隨機發 展,而每次運算用來建立模式的資料也是隨機 的,因此每次運算得到的結果與正確性都可能會 不同,為得到最可靠的結果,我們使用 GARP 運 算建立 400 個模式,再從中選取 20 個最佳的模 式,多個模式結合得到的結果會較單一模式更值 得信賴(Anderson et al. 2003; Ortiz-Martínez et al. 2008)。模式的選取參考 Anderson et al.(2003)提出 的方法,先剔除未預測面積超過 5 %的模式,計 表一、預測台灣水鹿分布所使用之環境因子及其說明。
Table 1. List and specification of environmental variables used to predict distribution of Formosan sambar deer (Rusa unicolor swinhoii).
Variables Range Specification
Elevation (m) 32-3,569 Based on the 1/50,000 topographic map published by Ministry of the Interior, the contour interval was 100m set as Arc/Info file and then transferred to the grid system. The elevations within a grid were averaged by SAS.
Slope (°) 10.94-51.96 Utilized the elevation database and loaded to IDRISI to calculate slope. The slopes within a grid were averaged. Aspect (°) 1.42-359.59 Utilized the elevation database and loaded to IDRISI to
calculate aspect. The aspects within a grid were averaged. Normalized
difference vegetation index (NDVI)
0-0.62 Data was from the U.S. Geological Survey with 1×1 km resolution. One month three images, presenting the plant growth condition at the first, the middle, and the end of the month, respectively, was processed by geographical adjustment or project transfer, and then mapped to the grid system. Environmental
type
Based on the 1/50,000 Editorial committee of the flora of Taiwan (second edition 1994) and the Landsat image to transfer to 500×500 m resolution grid system.
Distance to road (km)
0-14.43 Utilized the road distribution and loaded to IDRISI to calculate distance to road. The road distribution was based on the 1/250,000 transportation road map published by the Institute of Transportation, Ministry of Transportation and
Communications, and then transferred to 100×100 m resolution grid system.
Distance to watercourse (km)
0-6.33 Utilized the river database and loaded to IDRISI to calculate distance to watercourse. The river database was based on the 1/250,000 distribution map of watershed in Taiwan published by the Council of Agriculture, and then transferred to 100×100 m resolution grid system.
算餘下各個模式之漏判誤差(omission error)與誤 判誤差(commission error)後,選取漏判誤差最小 的40 個模式,並以卡方檢定(chi-square test)再次 確認其預測結果是否優於隨機,再從中選取誤判 誤差最小的20 個模式,將這 20 個模式產生的預 測圖堆疊成一複合的預測圖。由於每個模式製造 的預測圖會顯示各個網格被預測為 1(有台灣水 鹿)或 0(無台灣水鹿),將 20 個預測圖堆疊後,每 個網格預測台灣水鹿出現的可能性則為0 至 20。 最後我們以不同的門檻標準,呈現3 張太魯閣國 家公園水鹿分布預測圖:(1) 顯示超過 16 個模式 預測有台灣水鹿之地點,(2) 顯示超過 11 個模式 預測有台灣水鹿之地點,(3)顯示超過 6 個模式預 測有台灣水鹿之地點。 太魯閣國家公園台灣水鹿實際分布圖 由於生態區位模式預測結果為所有適合該 物種棲息的地區,並不會考慮到歷史或地理因素 (Peterson et al. 1999; Soberon and Peterson 2005),因此某些地區若過去受到狩獵影響而導致 該物種滅絕,或者因地理上的隔離致使該物種無 法擴散至此,便可能被預測為有該物種出現但實 際並無該物種分布。 為呈現台灣水鹿在太魯閣國家公園內的實 際分布情形,以作為經營管理時的參考,並可作 為環境解說教育的背景資料,在以DK-GARP 運 算、繪製出太魯閣國家公園台灣水鹿分布預測圖 後,我們參考本研究野外調查之結果,並比對過 去太魯閣國家公園境內之調查文獻,以分布預測 圖為藍本加以修改,繪製成太魯閣國家公園台灣 水鹿實際分布圖。
結 果
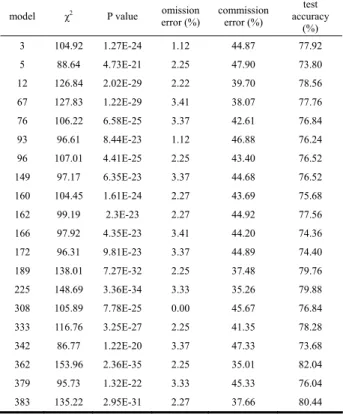
我們計算400 個模式之漏判誤差與誤判誤差 後,選出了20 個表現最佳的模式進行後續分析, 卡方檢定顯示這 20 個模式之正確性均顯著優於 隨機選擇之結果(表二),其漏判誤差在 0.00%到 3.37%之間,而誤判誤差在 35.01%到 47.90%間, 測試資料群之測試結果顯示,其正確性在73.68% 到82.04%之間。 將 20 個模式產生之預測圖堆疊後,我們呈 現超過 16 個模式預測有水鹿分布之地點(圖二 a),顯示南湖山區、奇萊與磐石山區、陶塞溪流 域等地區具有較大的棲地面積適合水鹿生存。在 此門檻下,太魯閣國家公園約 92,000 ha 的面積 中,約有7.55%的面積適合水鹿生存。 表二、利用太魯閣國家公園之台灣水鹿(Rusa unicolor swinhoii)痕跡定位資料,使用 DK-GARP 產生 400 個 生態區位模式後,以漏判誤差及誤判誤差為標準選取 20 個表現最佳的模式。Table 2. We used DK-GARP to establish 400 ecological
niche models with the Formosan sambar deer (Rusa
unicolor swinhoii) occurrence data in Taroko National
Park. Twenty best models were selected by estimating the omission error and commission error.
model χ2 P value omission
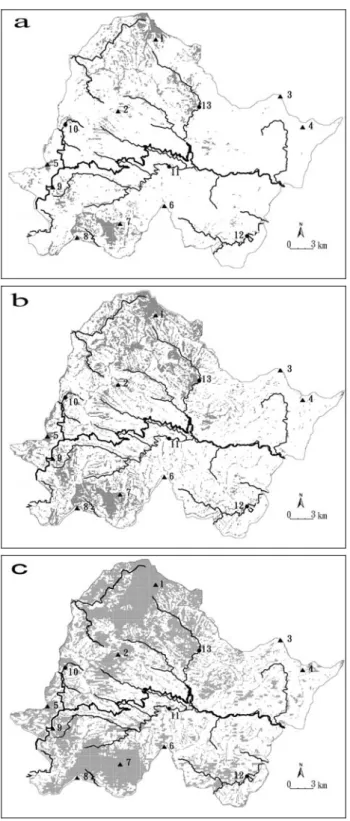
error (%) commission error (%) test accuracy (%) 3 104.92 1.27E-24 1.12 44.87 77.92 5 88.64 4.73E-21 2.25 47.90 73.80 12 126.84 2.02E-29 2.22 39.70 78.56 67 127.83 1.22E-29 3.41 38.07 77.76 76 106.22 6.58E-25 3.37 42.61 76.84 93 96.61 8.44E-23 1.12 46.88 76.24 96 107.01 4.41E-25 2.25 43.40 76.52 149 97.17 6.35E-23 3.37 44.68 76.52 160 104.45 1.61E-24 2.27 43.69 75.68 162 99.19 2.3E-23 2.27 44.92 77.56 166 97.92 4.35E-23 3.41 44.20 74.36 172 96.31 9.81E-23 3.37 44.89 74.40 189 138.01 7.27E-32 2.25 37.48 79.76 225 148.69 3.36E-34 3.33 35.26 79.88 308 105.89 7.78E-25 0.00 45.67 76.84 333 116.76 3.25E-27 2.25 41.35 78.28 342 86.77 1.22E-20 3.37 47.33 73.68 362 153.96 2.36E-35 2.25 35.01 82.04 379 95.73 1.32E-22 3.33 45.33 76.04 383 135.22 2.95E-31 2.27 37.66 80.44 將門檻降低為呈現超過 11 個模式預測有水 鹿分布之地點(圖二 b),顯示除南湖山區、奇萊與 磐石山區、陶塞溪流域外,耳無溪流域、西喀拉 罕溪流域、合歡北峰、合歡東峰等地區也具有較 大的棲地面積適合水鹿生存。在此門檻下,太魯 閣國家公園約有18.40%的面積適合水鹿生存。 將門檻再降低為呈現超過6 個模式預測有水 鹿分布之地點(圖二 c),顯示包含前述地點及三棧 溪 流 域 等 地 都 具 有 大 面 積 的 棲 地 適 合 水 鹿 生 存,除鄰近中橫公路的地區外,園區內多數中高 海拔地區都可能是適合水鹿生存的環境。在此門 檻下,太魯閣國家公園約有40.02%的地區適合水 鹿生存。 三個門檻的分布預測圖中,以圖二b 與穿越 線調查結果最吻合,因此以圖2-b 為藍本,參考 過去文獻與穿越線調查結果,繪製成太魯閣國家 公園台灣水鹿實際分布圖(圖三)。
圖二、太魯閣國家公園水鹿分布預測,顯示根據不同 門檻預測有水鹿分布的地點(a:超過 16 個模式預測有 分布;b:超過 11 個模式預測有分布;c:超過 11 個 模式預測有分布)。暗色區域為預測水鹿出現的區域, 粗線為中部橫貫公路,細線為河流,1 為南湖大山,2 為無明山,3 為曉星山,4 為清水山,5 為合歡北峰, 6 為立霧主山,7 為磐石山,8 為奇萊主峰,9 為合歡 東峰,10 為耳無溪,11 為立霧溪,12 為三棧溪,13 為陶塞溪。
Figure 2. The predictive potential distribution of
Formosan sambar deer (Rusa unicolor swinhoii) in Taroko National Park. Panels a-c show various thresholds of concordance among the 20 models (at least 16, 11, 6 out of the 20 models predicted presence, respectively). The dark areas indicate the predicted distribution of Formosan sambar deer. The bold line depicts the Central Cross-Island Highway, and the thin lines are used to denote the rivers. The place names are: 1, Mt. Nanhu; 2, Mt. Wuming; 3, Mt. Xiaoxing; 4, Mt. Qingshui; 5, Hehuan North Peak; 6, Mt. Liwuzhu; 7, Mt. Panshi; 8, Mt. Qilai; 9, Hehuan East Peak; 10, Erwu River; 11, Liwu River; 12, Sanzhan River; 13, Taosai River. 圖三、太魯閣國家公園水鹿實際分布圖。暗色區域為 水鹿分布地區,粗線為中部橫貫公路,細線為河流,1 為南湖大山,2 為無明山,3 為曉星山,4 為清水山, 5 為合歡北峰,6 為立霧主山,7 為磐石山,8 為奇萊 主峰,9 為合歡東峰,10 為耳無溪,11 為立霧溪,12 為三棧溪,13 為陶塞溪。
Figure 3. Distribution map of Formosan sambar deer
(Rusa unicolor swinhoii) in Taroko National Park. The dark areas indicate the distribution of Formosan sambar deer. The bold line depicts the Central Cross-Island Highway, and the thin lines are used to denote the rivers. The place names are: 1, Mt. Nanhu; 2, Mt. Wuming; 3, Mt. Xiaoxing; 4, Mt. Qingshui; 5, Hehuan North Peak; 6, Mt. Liwuzhu; 7, Mt. Panshi; 8, Mt. Qilai; 9, Hehuan East Peak; 10, Erwu River; 11, Liwu River; 12, Sanzhan River; 13, Taosai River.
討 論
圖二 a 為門檻最高之分布預測圖,顯示南湖 山區、奇萊與磐石山區、陶塞溪流域具有較大面 積適合水鹿生存,其中前兩者亦是過去研究調查 顯示及一般民眾較熟知之水鹿常出沒地區,因此 圖二 a 顯示之地區可能為最適合水鹿生存的區域,再比較王等(2008)之調查結果,這些地區也 是水鹿相對豐度較高的地區。圖二 b 為門檻次高 之分布預測圖,顯示了更多水鹿可能生存的地 區,依本研究穿越線調查結果,圖二 b 顯示的地 點更貼近水鹿實際分布的情形。圖二 c 則顯示將 近 一 半 的 太 魯 閣 國 家 公 園 均 可 能 適 合 水 鹿 生 存,這個結果可能較接近水鹿在未受干擾下最佳 的分布狀態。軟體 DK-GARP 運算結果顯示出所 有可能適合水鹿生存的地區,但未能考慮歷史或 地理隔離等因素,因此被預測為適合水鹿生存但 實際卻未分布的地區,可視為未來該物種分布擴 散的潛在區域,或是復育、重新引入的適合區域 (Klar et al. 2008)。 合歡東峰東方一帶及合歡北峰一帶被預測 為水鹿可能分布之地點,但根據穿越線調查結 果,兩處均未發現水鹿蹤跡,這兩個地區雖然環 境適合,但可能因過去的狩獵、或受到鄰近的合 歡山區遊憩壓力所影響、或是中橫公路帶來的種 種干擾,以致水鹿未能重新回到這些地區。這兩 個地區具有潛力成為未來水鹿族群擴散或重新 人為引入的區域,且合歡東峰一帶較靠近奇萊山 區,水鹿擴散的時間可能更先於受到中橫公路阻 隔的合歡北峰,建議未來可在這些地區持續進行 監測。但目前由於關於水鹿的研究仍十分少,高 海拔環境對水鹿的承載量及高海拔地區水鹿的 活動範圍等均仍屬未知,因此尚難以估計水鹿擴 散的速度。 動 物 的 移 動 不 會 受 人 類 劃 設 的 界 線 所 侷 限,因此緊鄰國家公園的外圍區域也應納入保育 考量。本研究指出的幾個水鹿重要棲地中,奇萊 山區南方有丹大野生動物重要棲息環境延續進 行保護,南湖山區北方則有棲蘭野生動物重要棲 息環境,但在南湖山區的東側及陶塞溪的北側, 即和平南溪流域及闊闊庫溪流域,其環境位置緊 鄰太魯閣國家公園內之水鹿熱點,環境亦較原始 且不易抵達,可能擁有豐富的動物資源,但目前 未受到任何生態保護區所保護,未來應調查此區 生態資源及狩獵狀況,再視調查結果擬定保護策 略。 許多研究均指出,動物會傾向避開靠近公路 的地區(Ager et al. 2003; Johnson et al. 2000; Park and Lee 2003),中橫公路橫貫太魯閣國家公園, 車流量大,具有一定的遊憩壓力,且沿路時有聚 落、農場等,人類之燈光、噪音、飼養之犬隻也 都 可 能 對 動 物 造 成 干 擾 而 使 其 不 願 靠 近 (Debeljak et al. 2001; Klar et al. 2008)。此外,交
通便利的地方狩獵壓力也較高。這些原因都可能 令中橫公路沿線大多被評估為不適合水鹿生存 的地區。而遠離公路的中高海拔山區,尤其是鄰 近陶塞溪、耳無溪、和平南溪等溪流流域的地 區,多被評估為適合水鹿生存的地區。 本研究預測並描繪了台灣水鹿在太魯閣國 家公園的分布現況,未來有關單位擬定本區之經 營管理策略時,可參考本研究之結果進行規劃, 以增進保育成效。更進一步可將本法應用在其他 地區,或是其他大型哺乳動物上,以增進對本種 或其他大型哺乳動物現況之了解。
誌 謝
感謝太魯閣國家公園管理處以研究計畫編 號 PG9701-0446 支持本研究進行,並感謝實驗室 同仁們林子揚、賴冠榮、廖家宏、葉建緯等人及 義工李華彥、洪偉琮、林宗億、張國威等人協助 野外調查進行,最後感謝審查委員的細心指正。參考文獻
Ager, A., Johnson, B., Kern, J., Kie, J., 2003. Daily and seasonal movements and habitat use by female rocky mountain elk and mule deer. Journal of Mammalogy 84: 1076-1088.
Anderson, R.P., Lew, D., Peterson, A.T., 2003. Evaluating predictive models of species' distributions: criteria for selecting optimal models. Ecological Modelling 162: 211-232. Boitani, L., Sinibaldi, I., Corsi, F., De Biase, A.,
Carranza, I.D., Ravagli, M., Reggiani, G., Rondinini, C., Trapanese, P., 2008. Distribution of medium- to large-sized African mammals based on habitat suitability models. Biodiversity and Conservation 17: 605-621. Chang, H.L., 2008. Using geographical information
system to predict the distribution of Formosan sambar deer (Rusa unicolor swinhoei) in Yushan National Park. National Chiayi University MS thesis, 72 pp. (In Chinese). Debeljak, M., Dzeroski, S., Jerina, K., Kobler, A.,
Adamic, M., 2001. Habitat suitability modelling for red deer (Cervus elaphus L.) in South-central Slovenia with classification trees. Ecological Modelling 138: 321-330.
Elith, J., Graham, C.H., Anderson, R.P., Dudı´k, M., Ferrier, S., Guisan, A., Hijmans, R.J., Huettmann, F., Leathwick, J.R., Lehmann, A.,
Li, J., Lohmann, L.G., Loiselle, B.A., Manion, G., Moritz, C., Nakamura, M., Nakazawa, Y., Overton, J.M., Peterson, A.T., Phillips, S.J., Richardson, K.S., Scachetti-Pereira, R., Schapire, R.E., Sobero´n, J., Williams, S., Wisz, M.S., Zimmermann, N.E., 2006. Novel methods improve prediction of species’ distributions from occurrence data. Ecography 29: 129-151.
Illoldi-Rangel, P., Sanchez-Cordero, V., Townsend Peterson, A., 2004. Predicting ditributions of Mexican mammals using ecological niche modeling. Journal of Mammalogy 85: 658- 662.
Johnson, B., Kern, J., Wisdom, M., Findholt, S., Kie, J., 2000. Resource selection and spatial separation of mule deer and elk during spring. The Journal of Wildlife Management 64: 685- 697.
Klar, N., Fernandez, N., Kramer-Schadt, S., Herrmann, M., Trinzen, M., Buttner, I., Niemitz, C., 2008. Habitat selection models for European wildcat conservation. Biological Conservation 141: 308-319.
Lee, L.L., Lin, C.Y., Tsai, C.G., 2006. Food habitats and population ecology of Formosan sambar deer (Rusa unicolor swinhoei) at Yu-Li Wild life Refuge. Council of Agriculture, Taipei, Taiwan., 64 pp. (In Chinese).
Lu, K.Y., 1983. Faunal survey of Taroko National Park. Headquarter of Taroko National Park, Ministry of Interior, 17 pp. (In Chinese). Munguia, M., Peterson, A.T., Sanchez-Cordero, V.,
2008. Dispersal limitation and geographical distributions of mammal species. Journal of Biogeography 35: 1879-1887.
Ortiz-Martínez, T., Rico-Gray, V., Martínez-Meyer, E., 2008. Predicted and verified distributions of Ateles geoffroyi and Alouatta palliata in Oaxaca, Mexico. Primates 49: 186-194.
Park, C.-R., Lee, W.-S., 2003. Development of a GIS-based habitat suitability model for wild
boar Sus scrofa in the Mt. Baekwoonsan region, Korea. Mammal Study 28: 17-21. Peterson, A.T., Papes, M., Eaton, M., 2007.
Transferability and model evaluation in ecological niche modeling: a comparison of GARP and Maxent. Ecography 30, 550-560. Peterson, A.T., Soberon, J., Sanchez-Cordero, V.,
1999. Conservatism of ecological niches in evolutionary time. Science 285: 1265-1267. Soberon, J., Peterson, A.T., 2005. Interpretation of
models of fundamental ecological niches and species' distributional areas. Biodiversity Informatics 2: 1-10.
Stockwell, D.R.B., Peterson, A.T., 2002. Effects of sample size on accuracy of species distribution models. Ecological Modelling 148: 1-13. Timmins, R.J., Steinmetz, R., Sagar Baral, H.,
Samba Kumar, N., Duckworth, J.W., Anwarul Islam, M., Giman, B., S., H., Lynam, A.J., Fellowes, J., Chan, B.P.L., Evans, T., 2008. Rusa unicolor. In: IUCN 2009. IUCN Red List of Threatened Species.
Wang, Y., Wang, C.C., Kuo, C.Y., Wu, H.J., Chen, S.C., Tsai, C.C., 2003. Status of large mammals in Taiwan. Council of Agriculture. Taipei, Taiwan, 28 pp. (in Chinese).
Wang, Y., Yen, S.C., Liao, C.H., Yeh, C.W., 2008. Alpine ecosystem of Taroko National Park - The study on Formosan sambar deer's (Rusa unicolor swinhoei) habitat use. Headquarter of Taroko National Park, Ministry of Interior, 52 pp. (In Chinese).
Wu, H.Y., Wu, S.H., Wu, Y.H., 2004. Fuana survey in alpine area of Taroko National Park. Headquarter of Taroko National Park, Ministry of Interior, 66 pp. (In Chinese).
Yang, Y.P., Shih, K.S., Chou, F.S., Ke, C.J., Yang, C.K., Chao, S.C., 2004. Flora survey of alpine area in Taroko national Park. Headquarter of Taroko National Park, Ministry of Interior, 89 pp. (In Chinese).
Predictive Distribution Map of Formosan Sambar Deer (Rusa unicolor
swinhoii) in Taroko National Park
Shih-Ching Yen
1*, Ying Wang
1, Heng-You Ou
21
Department of Life Science, National Taiwan Normal University Taipei, Taiwan
2
Institute of Ecology and Evolutionary Biology, National Taiwan University Taipei, Taiwan
ABSTRACT
In recent years, the population size of Formosan sambar deer (Rusa unicolar swinhoii) has increased. However, the distribution patterns of Formosan sambar deer remain unclear, which has caused difficulties for conservation and management. We carried out line transects and obtained 181 deer occurrence data in Taroko National Park. The data was analyzed using geographical information system (GIS). Seven environmental factors including altitude, slope, aspect, normalized difference vegetation index, environmental type, distance to road, and distance to watercourse were used. We developed ecological niche model and predictive distribution map of Formosan sambar deer by the software DK-GARP. The results suggested that Mt. Nanhu, Mt. Qilai, Taosai river basin, and Erwu river basin are the most suitable habitats for Formosan sambar deer in Taroko National Park. Hehuan east peak and Hehuan north peak are the potential areas of deer dispersing. But the disturbance from Central Cross Island Highway may affect deer’s dispersion. Besides, it’s recommended that survey of Heping south river basin and Kuokuoku river basin be done in the near future because these areas are in close proximity to the deer hotspots yet outside the National Park boundary. This study successfully predicted the distribution of Formosan sambar deer in Taroko National Park. In the future, this method can be applied to other areas and improve our knowledge of Formosan sambar deer.
Keywords: Rusa unicolor, Taroko National Park, geographic distribution, genetic algorism, ecological