以利害關係人觀點分析公司零盈餘門
檻操控
Earnings Management of Firms Just Meeting
Zero-earnings Thresholds: The Stakeholders’ Perspective
李淑華1
Shu-hua Lee
國立台北大學 會計學系
Department of Accounting, National Taipei University
簡雪芳 Hsueh-Fang Chien
東吳大學 會計學系
Department of Accounting, Soochow University
蔡彥卿 Yann-Ching Tsai
國立台灣大學 會計學系
Department of Accounting, National Taiwan University
張玲玲2
Ling-Ling Chang
銘傳大學 會計學系
Assistant professor, Department of Accounting, Ming Chuan University
摘要:本文以兩項觀點 (公司治理與審計品質將增加監控且降低盈餘管理之 觀點,以及分析各利害關係人決策與企業決策關係之觀點),探討董事長兼任 總經理、獨立董監事、機構法人持股與大型會計師事務所查核與零盈餘門檻 操控行為之關係。實證結果顯示獨立董監席次比率及機構法人持股比率,皆 與零盈餘門檻操控為顯著正相關,而審計品質 (以四大會計師事務所查核衡 量) 及董事長兼任總經理則與零盈餘門檻操控間不存在顯著關聯。該實證結 果傾向支持由利害關係人決策與企業決策觀點解釋企業零盈餘門檻操控行為。 本文並以 Jacob and Jorgensen (2007) 之研究設計,發現台灣上市 (櫃) 公司 存在會計年度年盈餘分配圖在零盈餘門檻附近存在不連續現象;另估計剛跨
1
Corresponding author 1: Department of Accounting, National Taipei University, New Taipei City, Taiwan, E-mail: [email protected]
Acknowledgements: This study was supported by the National Science Council under project Grant NSC-97-2410-H-002-043. The authors would like to thank the National Science Council for the financial support.
2
Corresponding author 2: Department of Accounting, Ming-Chuan University, Taipei, Taiwan, E-mail: [email protected]
越零盈餘門檻公司 (小額正年盈餘公司組) 之實質盈餘管理與異常裁量性應 計數,兩項平均值皆不顯著異於零,該結果與本文主張零盈餘門檻操控為小 金額損益操控之想法一致。
關鍵詞:利害關係人;避免損失;盈餘門檻;盈餘管理
Abstract:This paper aims to examine whether CEO-board chairperson duality,
board independence, institutional holding, and audit quality affect earnings management behavior of firms that are just meeting zero-earnings thresholds. The empirical tests are based on the following two perspectives: the perspective that corporate governance and audit quality can constrain earnings management and the perspective of stakeholders’ interests and firms’ decisions. Our empirical findings suggest that firms with a higher proportion of independent board members and higher institutional shareholding are more likely to meet the zero-earnings thresholds through earnings management. However, we find insignificant results for CEO-board chairperson duality and audit quality. In summary, the findings support the perspective of the stakeholders’ interests and the firms’ decisions. In addition, we document the existence of discontinuities around zero-earnings thresholds in earnings distributions based on the methodology of Jacob and Jorgensen (2007). Also, discretionary accrual and real activities manipulation are insignificantly different from zero for firms just meeting zero-earnings thresholds, which supports our assumption that those firms are likely to involve only an insignificant amount of earnings management.
Keywords: Stakeholders’ interest; Avoiding loss; Earnings threshold; Earnings management
1. Introduction
Schipper (1989) defines that earnings management is an act of intentionally influencing the process of financial reporting to obtain private gains. Healy and Wahlen (1999) indicate that earnings management occurs “when managers use judgement in financial reporting and in structuring transactions to alter financial reports to either mislead some stakeholders about the underlying economic
performance of the firm, or to influence contractual outcomes that depend on reported accounting numbers.” Empirical studies by Hayn (1995), Burgstahler and Dichev (1997), Degeorge, Patel and Zeckhauser (1999), and Jacob and Jorgensen (2007) find discontinuities in net income histograms regarding zero-earnings and earnings thresholds close to zero and attribute these findings to firms managing earnings in small amounts to meet zero-earnings thresholds when facing small losses.3
Kahneman and Tversky (1979) propose the prospect theory, which states that people choose among probabilistic outcomes that involve risks by evaluating outcomes as changes from a reference point, at which a kink transforms the overall curve of the utility function into an S shape.4 According to the concept of reference points,5 Scott (2011) asserts that prospect theory assumes loss aversion. Thus, starting at the breakeven point of the investment, the rate of utility loss for a loss in value is greater than the rate of utility increase for a gain in value. Degeorge, Patel and Zeckhauser (1999) report that if the preferences of the executives and the boards that review them, or the behavior of the investors who trade the company stocks are consistent with the prospect theory predictions, then the executives will have threshold-dependent compensation schemes and are likely to manage reported earnings to meet the thresholds that they wish to attain. According to the transaction cost theory, Burgstahler and Dichev (1997) maintain that, because it is costly for stakeholders to retrieve and process detailed company earnings information, the terms of transactions are generally more favorable for firms with earnings that are higher, rather than lower, than zero and for firms with positive change in earnings. In other words, earnings information affects the terms of transactions between firms and stakeholders. Degeorge, Patel and Zeckhauser (1999) describe the importance of thresholds from the perspective of
3
The discontinuities around zero in annual income histograms indicate that firms have manipulated their earnings to meet the thresholds (Hayn, 1995, last paragraph on p. 132; Burgstahler and Dichev, 1997, abstract; Jacob and Jorgensen, 2007, abstract and first paragraph on p. 370).
4
Specifically, the curve of the utility function is convex for losses and concave for gains. 5
According to the concept of reference points in prospect theory, Scott (2011) reports that assessing gains and losses separately is a form of psychological narrow framing; in other words, individual problem analysis is restricted to the decision-making psychology framework.
psychological effects and indicate that reporting gains is the most crucial threshold for firms.
Manipulating earnings around the zero-earnings threshold is a subtopic of earnings management. Such manipulation differs from other topics in earnings management in that the amounts involved in the manipulation process may be relatively small (Gunny, 2009; Graham, Harvey and Rajgopal, 2005).6 Small, manipulated amounts around the zero-earnings threshold are difficult to detect because of high monitoring costs (Moeckel, 1990).7 In addition, firms may manipulate the earnings around zero-earnings thresholds in small amounts through real activity manipulations (e.g., providing customers with price discounts and preferential credit terms to increase sales) or discretionary accrual estimates (e.g., bad debt estimates, inventory valuation losses, and useful life estimates for depreciation). Real activity manipulations entail actual firm transactions and executives would assert such transactions are the results of business decisions for the firm. In addition, a small amount of discretion in accrual estimates falls within the acceptable range when applying generally accepted accounting principles (GAAP).8 Thus, firms are likely to engage in aggressive financial reporting when facing zero-earnings thresholds. Based on
6
The manipulation of small amounts around the zero-earnings threshold is discussed further in the subsection on real activities manipulations and accrual-based earnings management.
7
The potential amounts hidden in each account by company executives through earnings management are small, making the confirmation of earnings management behaviors in each account difficult for auditors (Moeckel, 1990).
8
Real activities manipulations, which affect firm cash flow, entail actual company transactions and may not violate GAAP. This problem is also indicated on p. 1048 of iGAAP 2013: A Guide
to IFRS Reporting, which is published by Deloitte, one of the Big Four audit firms. Furthermore,
discretionary accrual estimates typically satisfy an acceptable range. For example, when the estimated life for the depreciation of fixed assets is extended from 8 to 10 years, the rationality of such a change is evaluated according to range estimation rather than point estimation. Therefore, if it is within the acceptable estimation range as perceived by the auditors, the auditors may not object to such changes. As long as firms manage earnings within the acceptable range for accrual accounting estimates, the firms are considered compliant with GAAP regarding accounting discretion. Conversely, transactions such as fraudulent sales (typically involving accounts receivable and inventory) and fraudulent entries (e.g., in the US WorldCom Scandal, an expense for network maintenance was capitalized to inflate the earnings of the firm) are deemed illegal and to have violated GAAP even if the amounts involved are small.
prospect theory predictions, the consideration of transaction costs between firms and stakeholders, and the monitoring of such manipulation being costly or impossible, empirical verification is required to determine whether the argument that conventional corporate governance and audit quality can reduce earnings management effectively (Becker et al., 1998; Klein, 2002; Peasnell, Pope and Young, 2005; Prencipe and Bar-Yosef, 2011; Hsu and Wen, 2015) applies to explaining earnings manipulations around the zero-earnings threshold.
Hambrick, Werder and Zajac (2008) indicate that corporate governance should be investigated from broader and more dynamic perspectives such as stakeholders’ behaviors and the processes of these behaviors (Letza, Sun and Kirkbride, 2004; Hambrick, Werder and Zajac, 2008). Freeman’s stakeholder theory proposes that company stakeholders, including chairpersons, chief executive officers (CEOs), directors, institutional owners, and auditors, share the intrinsic value of the firm (Freeman 1984). Therefore, firm decisions and stakeholder decisions influence each other (Freeman, 1984; Jones and Wicks, 1999).
We examined earnings management from a perspective that focused on the relationship between stakeholders and firm decisions. First, chairpersons who also act as CEOs possess multiple identities and thereby hold the greatest authority and influence over the board of directors (Hambrick, Werder and Zajac, 2008). When facing losses, these chairpersons may not actively manage earnings to meet zero-earnings thresholds because they bear relatively less supervisory or profit pressure. Secondly, small, manipulated amounts around the zero-earnings threshold that involve the aforementioned real activities or accounting discretions are difficult or impossible to monitor. Therefore, even independent professional directors may fail to uncover specific evidence to confirm the earnings management attempts of executives. Also, corporate loss aversion may be consistent with the interest of independent directors, such as avoiding attention and a loss of reputation from being the director of a company with losses.9
9
For example, the Economic Daily News (August 1, 2015) reports that the directors of 128 listed firms, including Wei Chuan, LCY Group, Asia Pacific Telecom, First Steamship Group, Asia Optical, Chainqui, BH Global, and Kinko Optical, received high remuneration, even though the
Thirdly, short-term institutional investors frequently predict the near-term profits of the firms they invest10 in and to meet these predictions, executives exhibit a strong intention to manage earnings (Porter, 1992; Bushee 1998; Lin, 2001; Graham, Harvey and Rajgopal, 2005). Degeorge, Patel and Zeckhauser (1999) maintain that, if the preferences of executives and investors who trade company stocks are consistent with prospect theory predictions, then executives are likely to manage earnings to meet the thresholds they wish to attain. Finally, few studies explore whether behaviors involving earnings manipulations around the zero-earnings threshold differ between the audit clients of large audit firms and those of small audit firms. The empirical analysis of European listed firms by Van Caneghem (2004) addresses the tendency of the audit clients of the Big Five audit firms to round up the second digit of pretax incomes from nine to zero, revealing that a perspective based on audit quality does not explain behaviors involving earnings manipulations around the zero-earnings threshold.11 As discussed, zero-earnings thresholds are manipulated through real activities or discretionary accrual measures. Small, manipulated amounts around the zero-earnings threshold are difficult or impossible to monitor, and consequently, firms may be facing environments favorable for aggressive active financial reporting.12 Therefore,
firms faced massive financial losses in 2014. The Central News Agency (January 31, 2012) reports the actual remuneration of the directors of listed firms in 2010 as reported by Taiwan Stock Exchange, in which 41 firms (including reputed firms) faced losses after taxes; however, the total and average payouts received by their directors increased. NOWnews (2008) reveals that numerous investors lost vast amounts of money and their faith in businesses in 2008 but that the directors of numerous listed firms facing losses in 2007 (e.g., Taishin Holdings lost up to NT$3 per share) still received nearly NT$10 million in annual pay.
10 For example, Tseng (2011) reports in “No Profit This Year: Key Points in the Acer Investor Conference” that Acer’s semiannual report showed a loss of NT$6.79 billion after tax in the second-quarter, which was the greatest single-quarter loss in the history of Acer and exceeded the corporation’s predictions. According to “Avoiding the Pressure from Short-Term Stock Market Profit” in CommonWealth Magazine (No. 455, 2010), the supervisors of Burger King attempted to sell shares to private equity funds to avoid stock market pressure for short-term profits.
11
In an empirical study, Van Caneghem (2004) indicates that the audit clients of the Big Five audit firms tend to round up the second digit of pretax incomes from nine to zero and referred to the behavior as an earnings rounding-up behavior.
12
Using experimental research, Hackenbrack and Nelson (1996) report that auditors may have overlooked aggressive financial reporting, in which firms reported their earnings by adopting accounting methods they favored. Phillips (1999) maintains that this phenomenon may be
even large audit firms may not uncover substantive evidence to verify managers’ attempts to manipulate earnings,13 particularly for small amounts around the zero-earnings threshold.
Van Caneghem (2004) indicates that the relationship between audit quality and earnings management is an empirical issue. Similarly, we maintain that manipulating earnings around the zero-earnings threshold differs from general earnings management. In particular, the effects of chairpersons, CEOs, directors, institutional owners, and auditors on manipulating earnings around the zero-earnings threshold are fundamentally an empirical issue. Topics on corporate governance should be analyzed from perspectives that are broader and more dynamic. Therefore, two perspectives, one stressing that corporate governance and audit quality reinforce monitoring and reduce earnings management and one emphasizing the relationship between stakeholder and firm decisions, were employed to examine the relationship between earnings manipulations around the zero-earnings threshold on one hand, and CEO–chairperson duality, independent directors, institutional ownership, and big-4 accounting firms on the other.
The empirical results of our study indicate that the percentage of independent directors and the ratio of institutional shareholding are significantly positively correlated with manipulating earnings around the zero-earnings threshold; however, audit quality (using the Big-4 as a proxy) and CEO–chairperson duality are not associated with earnings manipulations around the threshold. These results differed from the assertion that conventional corporate governance mechanisms reduce earnings management effectively and supported the perspective that emphasized the relationship between stakeholder and firm decisions. Moreover, the results of additional tests based on the research design of Jacob and Jorgensen (2007) show discontinuities around zero in the fiscal year earnings histograms of Taiwanese listed as well as over-the-counter (OTC) firms, confirming that these firms managed their earnings to avoid reporting small losses. In addition, we caused by a corporate environment for aggressive financial reporting and the lack of experience by auditors.
13
Phillips (1999) reports that GAAP contains numerous ambiguous principles that require immense and careful judgements by auditors. Therefore, auditors are often unable to identify evidence to confirm GAAP violations by the clients.
estimate that the means of real activities management and abnormal discretionary accruals for these firms are not significantly different from zero, which is consistent with our argument that manipulating earnings around the zero-earnings threshold involves manipulating small amounts of profits or losses.
The main contributions of this paper are listed as follows: (a) We investigate earnings manipulation around the zero-earnings threshold from both the perspective that emphasizes involving conventional corporate governance and audit quality and the perspective that stresses the relationship between stakeholder and firm decisions, thereby providing a broader and more dynamic analysis of corporate governance. (b) Few studies examine the relationship between corporate governance and earnings manipulation around the zero-earnings threshold, with most of these studies applying loss aversion (zero-earnings threshold) to explain changes in discretionary accruals.14 Examining earnings manipulation around the threshold from the perspective of discretionary accruals has two disadvantages: The research design does not facilitate examining firms’ real activities manipulation, and investigating manipulations involving small amounts using a model based on discretionary accruals may not be effective. Comparing two sets of data for firms facing a zero-earnings threshold avoids these two disadvantages. (c) An additional test based on the research design of Jacob and Jorgensen (2007) was conducted on the data of Taiwanese listed and OTC companies. The empirical results are consistent with the argument by Jacob and Jorgensen (2007) that discontinuities around zero in annual earnings histograms are not caused by scaling. These results improved on flaws in the studies in Taiwan that employed the model of Burgstahler and Dichev (1997), as well as those of studies on the relationship between loss aversion and earnings management. In summary, manipulating earnings around the zero-earnings threshold is a subtopic of earnings management and differs from earnings management conducted under other conditions. Furthermore, if the threshold is truly the reference point for the
14
According to the findings of Healy (1985), Yang and Wu (2003) and Tsai and Yang (2006) adopt operating cash flow as the proxy variables for earnings amounts before manipulation, reporting that the aversion of reporting annual losses (negative operating cash flow) and discretionary accruals are positively correlated.
value functions of stakeholders (e.g., executives, boards of directors, investors, and auditors), then understanding the behaviors of these firms enables the users of financial statements to understand information relating to annual earnings of these firms and to accumulate multifaceted empirical evidence in accounting studies.
The remainder of this paper is organized as follows: section 2 reviews the research hypotheses and literature; section 3 describes the research framework, including samples, models, and definitions of the variables; section 4 presents the empirical analyses, additional tests, and sensitivity analysis; and the final section concludes the paper.
2. Literature Review and Hypothesis Development
Prospect theory, proposed by Kahneman and Tversky (1979), describes how people evaluate results according to a reference point on the utility function when facing risky choices. Certain factors could cause the reference point to shift and to affect people’s choices substantially, generating a kink at the reference point and transforming the entire curve into an S-shape curve. Accordingly, Scott (2011) attributed loss aversion behaviors to people’s dislike of even the smallest losses. Therefore, beginning at the point where the investment begins to have small losses, the rate of utility loss is greater than the rate of utility gain experienced by investors when the investment begins to make small profits. Addressing the importance of thresholds from a psychological perspective, Degeorge, Patel and Zeckhauser (1999) listed three types of earnings thresholds,15 with the most vital being the positive profits threshold. According to prospect theory, Degeorge, Patel and Zeckhauser (1999) maintain that, if a company executive intends to avert losses or if investors’ share trading strategies are consistent with prospect theory predictions, then the executive will have a reward schedule based on the threshold and will likely manage earnings to meet the desired threshold. On the basis of transaction cost theory, Burgstahler and Dichev (1997) report that earnings 15
Degeorge, Patel and Zeckhauser (1999) addressed three types of thresholds: reporting positive profits, sustaining recent performance (i.e., maintaining the earnings of the previous year), and meeting the expectations of analysts.
information affects the terms of transactions between firms and stakeholders. Because it is costly for stakeholders to process earnings information, terms of transactions are generally more favorable for firms with earnings that are higher, rather than lower, than zero.
Hayn (1995), Burgstahler and Dichev (1997), Degeorge, Patel and Zeckhauser (1999), and Jacob and Jorgensen (2007) identify discontinuity around zero in earnings histograms, confirming the behaviors of firms involving the management of small amount earnings to avert small losses. Studies have typically maintained that sound corporate governance and high audit quality effectively constrain earnings management practices (Becker et al., 1998; Klein, 2002; Peasnell, Pope and Young, 2005; Prencipe and Bar-Yosef, 2011; Hsu and Wen, 2015) by effectively reducing agency problems and preventing company managers from attempting to manage earnings.
Manipulating earnings around the zero-earnings threshold is a subtopic of earnings management and differs from other means of earnings management in that it may involve smaller amounts (Gunny, 2009; Graham, Harvey and Rajgopal, 2005). Monitoring small, manipulated amounts around the zero-earnings threshold is costly and difficult (Moeckel, 1990). Moreover, firms may manipulate small amount of earnings around the threshold through real activity manipulations (e.g., providing customers with price discounts and preferential credit conditions to increase sales) or discretionary accrual estimates (e.g., bad debt estimates of accounts receivables, allowances to reduce inventory, and useful life estimates for depreciation). Because real activity manipulations entail actual company transactions, managers may consider such transactions to be the result of managing business decisions for firms. In addition, the discretionary accrual estimates can be compliant with GAAP. Therefore, firms are prone to aggressive financial reporting when facing situations around the zero-earnings threshold. Based on prospect theory predictions, the consideration of transaction costs between firms and stakeholders, and the monitoring of such manipulation being costly or impossible, empirical verification is required to determine whether the argument that conventional corporate governance and audit quality can inhibit earnings management effectively applies to reducing earnings manipulations
around the zero-earnings threshold.
We attempt to explain behaviors involving the manipulation of earnings around the zero-earnings threshold from the perspective that emphasizes the relationship between stakeholder and firm decisions, in addition to analyzing the aforementioned studies according to conventional corporate governance. Letza, Sun and Kirkbride (2004) categorize current perspectives on corporate governance in two contrasting paradigms: the shareholding perspective, which regards the corporation as a legal instrument that enables shareholders to maximize their own interests (i.e., investment returns), and the stakeholding perspective, which views the corporation as the locus of wider, external stakeholder interests (O’Sullivan, 2000; Friedman and Miles, 2002). Hambrick, Werder and Zajac (2008) report that corporate scandals have caused increases of interest in corporate governance among researchers from many fields. Studies on corporate governance indicate that corporate governance should be examined from broader and more dynamic perspectives such as stakeholders’ behavior and behavioral processes (Hambrick, Werder and Zajac, 2008; Letza, Sun and Kirkbride, 2004). Proposed by Freeman (1984), stakeholder theory describes the relationship between the functions of firms and stakeholders, with stakeholders being defined as groups or individuals that affect or are affected by an organization, strategy, and project. Brenner and Cochran (1991) use stakeholder theory to explain organizations’ approaches to operation and to predicting their future behaviors. Freeman (1984) defines chairpersons, CEOs, directors, institutional owners, and accountants as the “stakeholders of firms.” Each stakeholder possesses an intrinsic value in the firm, and their decisions affect or are affected by the firm’s decisions (Freeman, 1984; Jones and Wicks, 1999). Organizations and stakeholders share dynamic relationships and influence each other through gains and losses, as well as rights and responsibilities (Evan and Freeman, 1988).
From the stakeholder perspective, we investigate the response of each company stakeholder to behaviors of managers involving the manipulation of earnings around the zero-earnings threshold to avert losses. When the cost effectiveness of the manipulation is considered (as described in the remainder of
this paper), stakeholders may not possess specific evidence that verifies the earnings management of firms to meet the threshold; in addition, such loss aversion may be in line with stakeholders’ interests.
Adopting both the perspective that stresses conventional corporate governance and the perspective that emphasizes the relationship between stakeholder and firm decisions, we examine and develop hypotheses regarding the relationship between behaviors involving earnings manipulations around the zero-earnings threshold and CEO–chairperson duality, independent directors, institutional ownership of shares, and large audit firms.
First, the effect of CEO–chairperson duality is analyzed. Williamson (1985) stresses that an executive is one of the most vital and influential members in a firm and may intentionally or unintentionally adopt opportunism and self-reinforcing behaviors. The board of directors, another group of stakeholders in a company, controls managerial behaviors by monitoring and influencing strategic decision making (Hillman, Nicholson and Shropshire, 2008; Johnson, Daily and Ellstrand, 1996).16 In examining the power and influence within the boardroom, Hambrick, Werder and Zajac (2008) explain that some directors are more influential than others and that the chairperson possesses the greatest power. If the chairperson is also the CEO, conflict may exist between the two identities regarding their functions. Hillman, Nicholson and Shropshire (2008) maintain that directors with multiple identities possess the flexibility to manage nonroutine problems but also encounter conflict among identities. If the identities of an organizational member are related and aligned, then multiple identities can benefit the organization. Conversely, if these identities compete with one another, identity multiplicity becomes costly and can be detrimental to an organization. On the basis of agency theory, Hillman, Nicholson and Shropshire (2008) suggest that directors who strongly identify with their role as chairperson hesitate to demonstrate monitoring behavior because they resent such behavior from their own board of directors. According to stewardship theory, Davis, Schoorman and 16
Directors have four functions: monitoring managerial behaviors of executives, advising and counseling organizations, safeguarding critical organization resources, and influencing decision making.
Donaldson (1997) indicate that such chairpersons 17 support monitoring reductions because they consider themselves to be their organization’s “steward” and confer such a function on their role as CEO.
Studies on CEO–chairperson duality typically indicate that chairpersons may use their power questionably for their own personal interests (Finkelstein and D’Aveni, 1994). Such CEO–chairperson duality weakens the monitoring function of boards of directors and thus encourages more earnings management behaviors (Dechow, Sloan and Sweeney, 1996; Chen and Yeh, 2002). Klein (2002) maintains that separating the roles of the board and the CEO facilitates improving corporate governance and constrains the intention of executives to manage earnings. Chen and Liu (2010) and Kumari and Pattanayak (2014) indicate that an absence of CEO–chairperson duality prevents executives from managing earnings. With CEO–chairperson dual identities, board independence and monitoring functions are weakened, and the CEO identity becomes responsible for firm performance (Wang and Dewhirst, 1992). To safeguard jobs, respond to profit pressure, and fulfill remuneration plans, such chairpersons may be prompted to manipulate earnings around zero-earnings thresholds to avoid losses. However, from another perspective, these chairpersons possess the greatest power and influence because of their multiple identities (Hambrick, Werder and Zajac, 2008). Therefore, when facing losses, a chairperson may choose not to actively manipulate earnings around the threshold because of the relatively low monitoring and profit pressure suspicions from the board of directors.
Facing zero-earnings thresholds, a firm’s earnings manipulation behavior by its chairperson–CEO may be complicated by conflict between the chairperson’s dual identities or by the chairperson’s power and influence over the board of directors. Without predicting the behavior’s orientation, we verify its influence through empirical tests involving the following hypothesis:
Hypothesis 1: CEO–chairperson duality is associated with earnings manipulation around the zero-earnings threshold.
17
According to Davis, Schoorman and Donaldson (1997), stewardship theory defines situations in which managers are not motivated by individual goals but rather situations in which they are stewards whose motives are aligned with the objectives of their principals.
Fama and Jensen (1983) maintain that outside directors enhance the board of directors’ effective monitoring over the company’s executives; rather than collude with the company’s executives to expropriate residual claimants, they protect their reputation as an independent expert in decision control. Studies typically report that outside directors are negatively correlated with earnings management. Klein (2002) and Xie, Davidson and DaDalt (2003) indicate that corporate board independence reduces earnings management. In exploring managers’ motivations for managing earnings, Peasnell, Pope and Young (2005) report that an increase of outsiders on the board reduces the likelihood of executives generating income-increasing abnormal accruals to avoid reporting both losses and earnings reductions. Uadial (2012) indicates that outside directors provide an operating firm with experience that is more multifaceted and greater monitoring power over executives, thereby reducing the likelihood of earnings management.
From another perspective, Hambrick, Werder and Zajac (2008) maintained that, although most studies on corporate governance facilitate a clearer understanding of executives’ motivations and behaviors to rise to a firm’s upper echelons (wealth, power, and prestige being most obvious) (Graffin et al., 2008),18 few studies explore outside directors’ motivations for serving on boards. Hambrick, Werder and Zajac (2008) further elaborate that board activities include numerous repetitive and nonprofessional routines. In times of corporate success, little credit is accrued to the directors; in times of difficulty, the directors are faced with the cumbersome task of replacing CEOs and an increased risk of lawsuits, attacks from the press, and stigma (Wiesenfeld, Wurthmann and Hambrick, 2008). From the perspective based on corporate governance, Hambrick, Werder and Zajac (2008) indicate that the responsibility of the board is to provide managers with professional advice on decision making and to ask critical questions about the risks of strategic plans. However, anecdotal evidence shows that such controversial and candid discussions rarely occur in boardrooms; instead, a class of group processes, including groupthink (Janis 1972), undiscussability (Argyris 1985), and pluralistic ignorance (Westphal and Bednar 2005) often prevail, 18
Graffin et al. (2008) show in their study how executives under specific circumstances benefit from the celebrity status of their CEOs.
preventing board members from asking tough questions.
When company managers inappropriately (e.g., making fictitious sales) or excessively (e.g., discretionary accrual estimates exceeding acceptable ranges) manipulate earnings to evade losses, independent directors oppose such manipulation to protect the benefits of shareholders and avoid lawsuits and loss of reputation. However, the amounts involved in manipulating earnings around the
zero-earnings threshold may be small (Gunny, 2009; Graham, Harvey and
Rajgopal, 2005) and difficult to detect (Moeckel, 1990). In addition, a manager may maintain that earnings manipulations through real activities result from business decisions, and earnings manipulations through discretionary accrual estimates that fall within the acceptable range of GAAP are difficult or impossible to detect. Consequently, even expert independent directors may not uncover specific evidence that confirms executives’ earnings management or manipula- tions of small amounts around the zero-earnings threshold. Furthermore, board decisions may not be implemented effectively. In difficult times, independent directors may endure both attacks from the press and damage to their reputations; avoiding the reporting of losses may satisfy the interests of these directors.
We maintain that manipulating earnings around the zero-earnings threshold differs from general earnings management. Although a high ratio of independent directors may restrain the occurrence of earnings management according to conventional corporate governance studies, they may not be as effective at preventing earnings manipulations around the zero-earnings threshold. Moreover, because detecting such manipulations is difficult or impossible and because avoiding the reporting of losses may fit the interests of these directors (to avoid press attacks and acquiring the reputation of being the director of a firm with losses), boards of directors may avoid reporting such manipulations. Consequently, the percentage of independent directors may not be negatively correlated with the likelihood of manipulating earnings around the zero-earnings threshold. Hence, the empirical models of this study examined the following hypothesis:
Hypothesis 2: The percentage of independent directors is associated with the manipulating earnings around the zero-earnings threshold.
Pfeffer and Salancik (1978) proposed resource dependence theory to explain that organizations rely on the resources owned by various stakeholders to operate (Clarkson, 1995; Rowley and Berman, 2000). Specifically, to safeguard their own interests, stakeholders use their resources to sanction—reward or punish—their own companies to change or reinforce their behaviors (Rowley and Berman, 2000, p. 409). Clarkson (1995) indicates that, without the continuing participation of primary stakeholders, who typically consist of shareholders and investors,19 enterprises cannot survive.
Institutional owners, those who are a company shareholder and a primary stakeholder, are often characterized as sophisticated investors who have advantages over individual investors in acquiring and processing value-relevant information (Hand, 1990; Jiambalvo, Rajgopal and Venkatachalam, 2002). Dechow, Sloan and Sweeney (1996) and Chung, Firth and Kim (2002) maintain that institutional investors can use their monitoring ability to effectively reduce agency problems and earnings management by executives. Cornett, McNutt and Tehranian (2009) find that the institutional ownership of shares reduces discretionary accrual-based earnings management. In addition, Jiang and Anandarajan (2009) and Jalil and Rahman (2010) indicate that institutional shareholding mitigates aggressive earnings management and improves the quality of accounting information. However, other studies maintain that institutional investors are transient owners20 who are overly focused on short-term earnings and thus may pressure executives to report consistently higher earnings, even by abusing accounting discretions (Bushee, 1998; Graham, Harvey and Rajgopal, 2005). Institutional owners typically predict the short-term earnings of companies, with company executives attempting to fulfill their stock market predictions.
19 Clarkson (1995) defines primary stakeholders as shareholder and investors, customers, employees, and suppliers and secondary stakeholders as communities and the corporate environment.
20 Hambrick, Werder and Zajac (2008) address heterogeneity among shareholders and maintain that conflicts of interest often occur between short-term orientated investors and long-term orientated investors. Typically, short-term oriented investors are more vocal than long-term oriented investors and exert their influence through the press and other social intermediaries.
Porter (1992) and Lin (2001) report that the institutional ownership of shares pressures executives to attain short-term profit goals, thus increasing their motivation to manage earnings. In an empirical study on electronics firms in Taiwan, Lin (2001) finds that firms with higher institutional ownership of shares generate higher discretionary accruals; similar findings are identified by Al-Fayoumi, Abuzayed and Alexander (2010).
The two aforementioned perspectives are used to analyze the effect of the institutional ownership of shares on manipulating earnings around the zero-earnings threshold. One of the perspectives indicates that aggressive monitoring by institutional owners can reduce agency problems and earnings management and is therefore negatively correlated with manipulating earnings around the zero-earnings threshold. The other perspective maintains that institutional owners are short-term investors who may pressure company executives to achieve profit goals. Degeorge, Patel and Zeckhauser (1999) report that the preferences of executives and investors who trade company shares are consistent with prospect theory predictions. Therefore, the institutional ownership of shares is positively correlated with earnings manipulation around the zero-earnings threshold. The effect of the institutional ownership of shares on earnings manipulation around the zero-earnings threshold is an empirical issue. We did not predict the orientation of such an effect. The third hypothesis in this study was formulated as follows:
Hypothesis 3: Institutional ownership is associated with the manipulating earnings around the zero-earnings threshold.
Previous studies consider the audit quality of the Big Four audit firms to be superior to that of small audit firms and maintain that large audit firms effectively reduce agency problems and earnings management (Becker et al., 1998; Bradshaw, Richardson and Sloan, 2001). Another perspective, which corresponds with the basis of Hypothesis 2, indicates that the amounts involved in manipulating earnings around the zero-earnings threshold may be small (Gunny, 2009; Graham, Harvey and Rajgopal, 2005) and difficult to detect (Moeckel, 1990). Executives may regard real activities earnings management to result from
business decisions, and earnings manipulations through discretionary accrual estimates that are compliant with the acceptable range of GAAP are difficult or impossible to monitor. Therefore, even large audit firms may find it difficult to uncover specific evidence to confirm executives’ earnings management and small, manipulated amounts around the zero-earnings threshold. Consequently, audit quality, indicative for constraining earnings management, may not be as effective in mitigating earnings manipulations around the zero-earnings threshold. Few studies investigate differences in the behavior of the audit clients of large audit firms and those of small audit firms regarding earnings manipulation around the zero-earnings threshold. An empirical study by Van Caneghem (2004) on listed firms in Europe shows that the audit clients of the Big Five audit firms tend to round up the second digit of pretax earnings from nine to zero, thereby indicating that higher audit quality is even associated with higher likelihood of earnings manipulation around the threshold.
This study aims to expand empirical evidence on differences in the behavior of the audit clients of large audit firms and those of small audit firms regarding earnings manipulation around the zero-earnings threshold. Similar to Van Caneghem (2004), we maintain that the relationship between large audit firms and earnings manipulations around the zero-earnings threshold is an empirical problem. Studies on conventional audit quality maintain that large audit firms effectively constrain earnings management. However, these firms may not be as effective in preventing earnings manipulation around the threshold; they may not uncover specific evidence verifying the earnings management behaviors of company executives aimed at avoiding small losses. Therefore, audit quality may not be negatively correlated with manipulating earnings around the zero-earnings threshold. Without predicting the orientation of such an effect by audit quality, we establish the fourth hypothesis in this study as follows:
Hypothesis 4: Audit quality is associated with manipulating earnings around
3. Research Design
3.1 Research Samples
We collected the data used in this study from the database (DB) of the Taiwan Economic Journal (TEJ). Particularly, we collected single-quarter and year-to-date financial statements and auditor information (from the TEJ Finance DB), equity market capitalization data (from the TEJ Equity DB), and corporate governance data (from the TEJ corporate governance DB). The sample period was constrained by the fact that the TEJ quarterly audit firm information DB is more complete starting from 1999. Using the research method of Jacob and Jorgensen (2007), we calculated the earnings for annual periods ending at various fiscal quarters. Thus, the first annual end date in the samples is the first quarter of 1999.21 Therefore, the samples range from the second quarter of 1998 to the fourth quarter of 2011 for a total of 55 quarters.22
We began with firm-year observations for all the firms listed on the Taiwan Stock Exchange and the Gre Tai Securities Exchange. From these, we excluded the following firm-year observations: (a) firms with fiscal year end different from December were excluded. (b) Firms belonging to specific industries such as finance, securities, and insurance industries were excluded. (c) Firms with discontinuities in quarterly data and missing values in the financial, audit firm, equity market capitalization, and corporate governance information were eliminated. According to the annual earnings measurement method of Jacob and Jorgensen (2007), the samples were further divided into the fiscal annual earnings group (i.e., total earnings from the first quarter to the fourth quarter) and the
21
The annual earnings period ending in the first quarter of 1999 begins from the second quarter of 1998.
22
The International Financial Reporting Standards (IFRS) became fully effective in Taiwan in 2013. To compare financial statements, the Taiwan Financial Supervisory Commission specifies that crucial differences between pre-IFRS accounting policies and the IFRS accounting policy and amounts significant affected on crucial items must be provided regarding financial statements from the year preceding the year that the IFRS became effective. Financial statements in 2012 were under a dual-track system, the ROC GAAP system and the IFRS system. Therefore, all of the samples in this study were obtained solely from the ROC GAAP period, which ended in the fourth quarter of 2011.
nonfiscal annual earnings group (i.e., total earnings from the second quarter to the first quarter of the following year, from the third quarter to the second quarter of the following year, or from the fourth quarter to the third quarter of the following year). Among the 3,603 firm-year data around the zero-earnings threshold,23 including those sample with small profits or small losses,24 962 data points belonged to the fiscal group, and 2,641 belonged to the nonfiscal group.25
3.2 Research Model
The behaviors of firms that involved the manipulation of annual (fiscal and nonfiscal) losses around the zero-earnings threshold were examined. The Probit model was used to analyze the effect of CEO–chairperson duality, independent directors, institutional owners, and audit quality on earnings manipulations around the zero-earnings threshold in the aforementioned samples to avert annual losses, as follows:
where EMit, which is a proxy variable that denotes manipulating earnings around the zero-earnings threshold, is a dummy variable that takes the value one for a firm-year observation with small annual positive earnings and zero for a firm-year observation with small annual negative earnings; DD1it is a dummy variable that takes the value one when company i is audited by the Big Four audit firms and the
23
Initially, the number of samples of firms around the zero-earnings threshold was 4,913 data points (discussed in defining the dependent variable EMit in the “Research Model” section).
However, the variable for measuring firm performance (PREROEit) is the average return on
equity in the previous 5 years; therefore, the number of samples was reduced to 3,726 data points. Eliminating the extreme PREROEit values (two samples outside the range of the standard
deviation) further reduced the number to the final 3,603 data points. 24
The research method of Jacob and Jorgensen (2007) is discussed in the “Additional Tests” section, part of which describes the annual earnings histograms.
25
The 2,641 data points in the nonfiscal annual earnings group included 866 data points on total annual earnings from the second quarter to the first quarter of the following year, 861 data points from the third quarter to the second quarter of the following year, and 914 data points from the fourth quarter to the third quarter of the following year.
* * * * * 3 2 1 14 13 12 11 10 9 8 7 6 5 4 3 2 1 0 it it it it it it it it it it it it it it it it it it it it it PREROE FY LEV LEV FY SIZE SIZE FY INS INS FY IND IND FY DUAL DUAL DD DD DD EM τ δ δ δ δ δ δ δ δ δ δ δ δ δ δ δ + + + + + + + + + + + + + + + = (1)
firm-year belongs to the fiscal group at period t, and zero otherwise; DD2it is a dummy variable that takes the value one when company i is not audited by the Big Four audit firms and the firm-year belongs to the nonfiscal annual earnings group at period t, and zero otherwise; DD3it is a dummy variable that takes the value one when company i is audited by the Big Four and the firm-year belongs to the nonfiscal group at period t, and zero otherwise; DUALit is a dummy variable taking the value one if CEO is the President, and zero otherwise; INDit is the proportion of independent directors on the board at period t; INSit is the shareholdings of institutional shareholders at the period t; SIZEit is the natural logarithm of market value of equity at the period t; LEVit is the ratio of total liability to total assets at the period t; FYit is a dummy variable taking the value one when company i does not belong to the nonfiscal group at period t, and zero otherwise; PREROEit is the mean of return of equity (net income/average equity) over the past five years.
The dependent variable EMit distinguishes the firms with small annual positive earnings from those with small annual negative earnings around the threshold. The firms with small losses did not meet the threshold, but those with small gains may have met it through earnings management. To select the firms around the threshold, an earnings histogram was plotted according to the research design of Jacob and Jorgensen (2007) (discussed in the “Additional Test” section, part of which describes the annual earnings histogram). On the basis of the differences between the annual earnings frequency ratios and the expected frequency ratios, z values were determined and used to select firms in the three partitions below the threshold (i.e., Partitions -2–0) as the firms with small annual negative earnings and firms in the three partitions above the threshold (i.e., Partitions 1–3) as the firms with small annual positive earnings. The group with small profits was designated as the proxy for earnings management. However, because the group may also include firms that did not manage earnings, errors may exist in the variable. Whether the error negatively affects the empirical results can be determined by examining whether it is biased against the conclusion or not. If it is biased against the conclusions, the error can be adjusted to turn it in favor of the conclusions; therefore, the empirical results are still valid
even if the bias is not adjusted.26 In this study, the potential error in the proxy variable for earnings management should not have affected the empirical results because the potential error would have been biased against the conclusions. In addition, most studies adopting discretionary accruals estimates as proxy variables for earnings management exhibit measurement errors (referenced in the discussion by Kothari, Leone and Wasley, 2005).
Das and Shroff (2002) and Gu, Lee and Rosett (2002) indicate that earnings management behaviors are concentrated in the fourth quarter of each year. Dichev and Skinner (2002) report that executives are unlikely to manage income for annual periods other than the fiscal year for capital markets and other contractual reasons. Jacob and Jorgensen (2007) maintain that nonfiscal annual earnings are less likely to be influenced by earnings management than fiscal annual earnings and support the argument by using nonfiscal annual earnings histograms. Therefore, we did not predict that our hypotheses can explain the patterns of nonfiscal annual earnings. Although the nonfiscal group was included for comparison, Model (1) was designed to verify the study’s hypotheses regarding the fiscal annual earnings group.
In Model (1), audit quality (Big Four or non-Big Four) and annual earnings measurements were employed to establish three dummy variables, namely DD1it (Big Four audit firms, fiscal group), DD2it (non-Big Four, nonfiscal group), and DD3it (Big Four, nonfiscal group), which were used to examine the relationship between audit quality and manipulating earnings around the zero-earnings threshold. The coefficient δ represents the incremental effect of Big Four on 1 earnings manipulated around the zero-earnings threshold in the fiscal group.27 If
1
δ is significantly different from zero, then the audit quality is associated with the large audit firms for the fiscal group, confirming Hypothesis 4.
In Model (1), if δ is significantly different from zero, then CEO–4 26
This argument is based on the testing of the effect of measurement errors on empirical results by Rajgopal, Shevlin and Venkatachalam (2003, p. 481, tenth line).
27
Similar tests (H0: δ =2 δ3) can be applied for comparing the effects of the Big Four audit with that of the non-Big Four audit on earnings manipulation around the threshold for the nonfiscal group. However, because nonfiscal annual earnings are not the target of earnings management, we do not anticipate that Hypotheses 1–4 apply to the nonfiscal group, thus conducting no further testing of that group.
chairperson duality is associated with earnings manipulation around the threshold for the fiscal group, confirming Hypothesis 1. If δ deviates significantly from 6 zero, then the percentage of independent directors is associated with earnings manipulation around the threshold for the fiscal group, confirming Hypothesis 2. If δ8 deviates significantly from zero, then the institutional shareholding ratio is associated with earnings manipulation around the threshold for the fiscal group, confirming Hypothesis 3. The coefficients δ5, δ , and 7 δ9 represent the incremental effects of CEO–chairperson duality, the percentage of independent directors, and the shareholding ratio of institutional owners in the firms for the nonfiscal group; if δ (i = 5, 7, 9) deviates significantly from zero, then the i incremental effects are confirmed.
Regarding the control variables in Model (1), studies indicate that firm sizes and financial leverages are associated with earnings management (DeFond and Park, 1997; Becker et al., 1998), with firm size being used as a proxy for some of the missing variables (Becker et al., 1998). Therefore, firm size (SIZEit) and financial leverage (LEVit) are included in this study as control variables. In addition, more satisfactory performance is exhibited by the firms to the right of the threshold than by those to the left. More satisfactory firm performance can be mis-attributed to favorable audit quality or corporate governance, causing selection bias in the empirical results. Therefore, the average return on equity in the preceding 5 years (PREROEit) was adopted in Model (1) as a control variable for firm performance.28
4. Empirical Analysis
4.1 Basic Statistical Analysis of the Variables
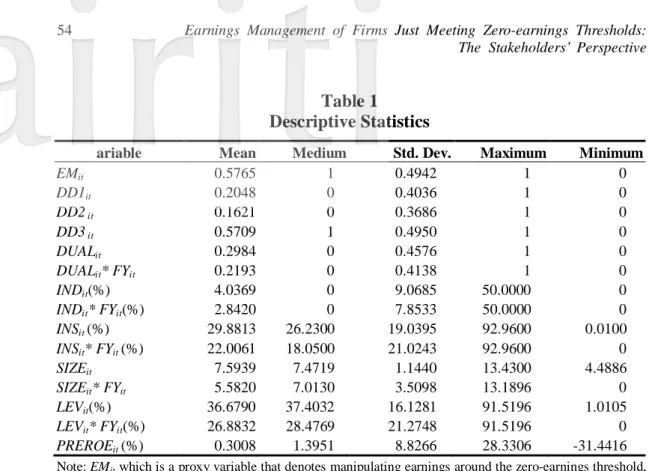
Table 1 lists the descriptive statistics of the model variables. The overall mean of EMit is 58%; however, it is 69% in the fiscal group and 54% in the nonfiscal group (information not listed). Regarding the fiscal group, 69% of the
28
PREROEit was also applied as a control variable for firm performance; the empirical results are
consistent with the conclusion of this paper.
Table 1 Descriptive Statistics
ariable Mean Medium Std. Dev. Maximum Minimum
EMit 0.5765 1 0.4942 1 0 DD1it 0.2048 0 0.4036 1 0 DD2 it 0.1621 0 0.3686 1 0 DD3 it 0.5709 1 0.4950 1 0 DUALit 0.2984 0 0.4576 1 0 DUALit* FYit 0.2193 0 0.4138 1 0 INDit(%) 4.0369 0 9.0685 50.0000 0 INDit* FYit(%) 2.8420 0 7.8533 50.0000 0 INSit (%) 29.8813 26.2300 19.0395 92.9600 0.0100 INSit* FYit (%) 22.0061 18.0500 21.0243 92.9600 0 SIZEit 7.5939 7.4719 1.1440 13.4300 4.4886 SIZEit* FYit 5.5820 7.0130 3.5098 13.1896 0 LEVit(%) 36.6790 37.4032 16.1281 91.5196 1.0105 LEVit* FYit(%) 26.8832 28.4769 21.2748 91.5196 0 PREROEit (%) 0.3008 1.3951 8.8266 28.3306 -31.4416
Note: EMit which is a proxy variable that denotes manipulating earnings around the zero-earnings threshold,
is a dummy variable that takes the value 1 for a firm-year observation with small annual positive earnings and 0 for a firm-year observation with small annual negative earnings; DD1it is a dummy
variable that takes the value 1 when the company i is audited by the Big Four audit firms and the firm-year belongs to the fiscal group during t, and 0 otherwise; DD2it is a dummy variable that takes
the value 1 when the company i is not audited by the Big Four audit firms and the firm-year belongs to the nonfiscal group during t, and 0 otherwise; DD3it is a dummy variable that takes the value 1 when
the company i is audited by the Big Four and the firm-year belongs to the nonfiscal group during t, and 0 otherwise; DUALit is a dummy variable taking the value 1 if CEO is the President and 0
otherwise at the period t; INDit is the proportion of independent directors on the board at period t; INSit
is the shareholdings of institutional shareholders at the period t; SIZEit is the natural logarithm of
market value of equity at period t; LEVit is the ratio of total liability to total assets at the period t; FYit
is a dummy variable taking the value 1 when company i does not belongs to the nonfiscal group at period t, 0 otherwise; PREROEit is the mean of return of equity (net income/average equity) over the
past five years. (3,603 firm-year observations)
firms show small gains, whereas 31% of them show small losses, indicating that the discontinuity around zero in the fiscal annual earning histogram was apparent. Conversely, in the nonfiscal group, the ratio of firms with small gains (54%) to those with small losses (46%) is nearly equal; thus, the discontinuity is not apparent. Nearly 80% of the samples are clients of the Big Four audit firms: 20% from the fiscal group (DD1it) and 57% from the nonfiscal group (DD3it); approximately 16% of the samples are clients of non-Big Four audit firms from
the nonfiscal group. The mean of DUALit is .2984, indicating that nearly 30% of the firms’ chairpersons are also the CEOs; the mean of INSit is 29.8813%; the percentage of independent directors shows a mean, maximum, and minimum of 4.0469%, 50%, and approximately 0%, respectively; LEVit shows a maximum, minimum, and mean of 91.5196%, 1.0105%, and 36.6790%, respectively; SIZEit shows a maximum, minimum, and mean of 13.4300, 4.4886, and 7.5939, respectively; and the mean, median, maximum, and minimum of PREROEit are .3008%, 1.3951%, 28.3306%, and -31.4416%, respectively.
Table 2 shows the correlation coefficient matrix of the model variables. Regarding the Big Four audit firms, DD1it is significantly positively correlated with EMit (0.1219), and DD3it is significantly negatively correlated with EMit (-0.1189); these results indicate that the Big four audit firms are positively correlated with earnings manipulation around the threshold in the fiscal group.29 DUALit and EMit are insignificantly negatively correlated in the fiscal group (however, the Spearman coefficient is a significant -.0219) and significantly negatively correlated in the nonfiscal group (-.0711; the Spearman coefficient = -.0712). INDit and EMit are insignificantly positively correlated; INDit*FYit and EMit are significantly negatively correlated in the nonfiscal group (-.0434; the Spearman coefficient = -0.0483); INSit and EMit are significantly positively correlated for the fiscal group (.0551; Spearman coefficient = .0520); INSit*FYit and EMit are significantly negatively correlated (-.0489; Spearman coefficient = -.0770); PREROEit and EMit are significantly positively correlated (.0482; Spearman coefficient = .0527); and PREROEit is significantly correlated with DUALit, INDit, and INSit, thus rendering it a required control variable in Model (1).
4.2 Empirical Results
Table 3 illustrates the empirical results of the relationship between manipulating earnings around the zero-earnings threshold and CEO-chairperson
29
The correlation coefficient between DD2it and EMit is insignificant and negative.
56 E ar n ings Ma nage m e nt of F ir m s J us t Me et ing Z e ro -e ar n ings T hr e sho lds : T h e S ta k e h o ld e rs ’ P e rs p e ct iv e T a b le 2 C or re lat ion M a tr ix EM it DD1 DD2 DD3 DUA Lit DUA Lit * IN Dit IN Dit * IN Sit IN Sit * S IZ Eit S IZ Eit * FY it LE Vit LE Vit * FY it P RER O Eit FY it FY it FY it EM it 1 0. 1219 ** * -0. 0040 -0. 1189 ** * -0. 0291* -0. 0712 ** * 0. 0003 -0. 0483 ** * 0. 0520 ** * -0. 0770 ** * 0. 0243 -0. 0984 ** * -0. 0397 ** -0. 1350 ** * 0. 0527 ** * DD1 0. 1219 ** * 1 -0. 2232 ** * -0. 5854 ** * -0. 0078 -0. 2690 ** * 0. 0451 ** * -0. 1967 ** * 0. 0016 -0. 6506 ** * -0. 0269 -0. 6506 ** * -0. 0071 -0. 6506 -0. 0079 DD2 -0. 0040 -0. 2232 ** * 1 -0. 5073 ** * 0. 0309 * 0. 1182 ** * -0. 0688 ** * -0. 0079 -0. 0298* 0. 1807 ** * 0. 0209 0. 2139 ** * -0. 0007 0. 2051 -0. 0153 DD3 -0. 1189 ** * -0. 5854 ** * -0. 5073 ** * 1 -0. 0205 0. 1979 ** * 0. 0224 0. 2149 ** * 0. 0343 ** 0. 5570 ** * 0. 0146 0. 5322 ** * 0. 0003 0. 5388 ** * 0. 0300* DUA Lit -0. 0291 -0. 0078 0. 0309 -0. 0205 1 0. 8127 ** * 0. 0478 ** * 0. 0535 ** * -0. 1412 ** * -0. 0668 ** * -0. 0897 ** * -0. 0479 ** * -0. 0423 ** -0. 0218 -0. 1092 ** * DUA Lit * FY it -0. 0711 ** * -0. 2689 ** * 0. 1182 ** * 0. 1978 ** * 0. 8127 ** * 1 0. 0400 ** 0. 1332 ** * -0. 0983 ** * 0. 1712 ** * -0. 0642 ** * 0. 1921 ** * -0. 0356 ** 0. 2210 ** * -0. 0911 ** * IN Dit 0. 003 8 0. 0405 ** * -0. 0639 ** * 0. 0215 0. 0406 ** 0. 0360 ** 1 0. 8183 ** * -0. 1213 ** * -0. 0895 ** * -0. 1004 ** * -0. 0508 ** * -0. 0915 ** * -0. 0713 ** * 0. 0579 ** * IN Dit * FY it -0. 0434 * -0. 1837 ** * -0. 0068 0. 2003 ** * 0. 0480 ** * 0. 1222 ** * 0. 8183 ** * 1 -0. 0931 ** * 0. 1096 ** * -0. 0906 ** * 0. 1079 ** * -0. 0935 ** * 0. 1116 ** * 0. 0794 ** * IN Sit 0. 055 1 ** * -0. 0046 -0. 0127 0. 0204 -0. 1423 ** * -0. 1009 ** * -0. 1213 ** * -0. 0879 ** * 1 0. 5523 ** * 0. 2092 ** * 0. 117 ** * -0. 0038 0. 0086 0. 0324* IN Sit * FY it -0. 0489 ** * -0. 5313 ** * 0. 1533 ** * 0. 4506 ** * -0. 0841 ** * 0. 1072 ** * -0. 0895 ** * 0. 0560 ** * 0. 6712 ** * 1 0. 1322 ** * 0. 6775 ** * -0. 0022 0. 5971 ** * 0. 0365 ** S IZ Eit 0. 02 43 -0. 0201 0. 0011 0. 0268 -0. 1050 ** * -0. 0801 ** * -0. 1004 ** * -0. 0740 ** * 0. 2510 ** * 0. 1806 ** * 1 0. 5681 ** * 0. 0479 ** * 0. 0509 ** * 0. 3196 ** * S IZ Eit * FY it -0. 1274 ** * -0. 8073 ** * 0. 2525 ** * 0. 6700 ** * -0. 0239 0. 2777 ** * -0. 0508 ** 0. 1834 ** * 0. 0697 ** * 0. 6590 ** * 0. 2702 ** * 1 0. 0246 0. 6170 ** * 0. 1973 ** * LE Vit -0. 03 46 ** * -0. 0094 0. 0048 -0. 0039 -0. 04158 -0. 0338 -0. 0915 ** * -0. 0748 ** * -0. 0198 -0. 0132 0. 0204 0. 0035 1 0. 5412 ** * -0. 1550 ** * LE Vit * FY it -0. 1302 ** * -0. 6414 ** * 0. 2062 ** * 0. 5282 ** * -0. 0210 0. 2184 ** * 0. 0360 ** * 0. 1222 ** * -0. 0015 ** * 0. 4721 ** * 0. 0324 * 0. 7351 ** * 0. 5514 ** * 1 -0. 0668 ** * P RER O Eit 0. 0482 ** * -0. 0011 -0. 0165 0. 0277 ** * -0. 1002 ** * -0. 0841 ** * 0. 0579 ** * 0. 0437 ** * 0. 0297 ** * 0. 0320 ** * 0. 3250 ** * 0. 0979 ** * -0. 1893 ** * -0. 0885 ** * 1 N ot e s: 1 . P ea rs o n ( S p ea rma n ) co rr e la ti o n co e ff ici en ts a re b el o w ( a b o v e) th e di a g o na l. ** *, * *, * i n d ic a te t h e st at is ti ca l si g n if ic a n ce at 1 % , 5 % a n d 1 0 % l ev el r e sp ec ti v el y. ( 3 ,6 0 3 fi rm -ye a r o bs er v a ti ons ) 2 . EM it w hi ch i s a pr o x y va ri a bl e t ha t d e not e s m a ni pu la ti n g e a rni ng s a roun d t he z er o -e a rni ng s t hr e sh ol d , i s a d u m m y v ar ia b le t h a t t ak es t h e v a lu e 1 fo r a fi rm -y ea r ob se rva ti on w it h sm a ll a n nu a l p o si ti ve e a rni n gs a n d 0 fo r a f ir m -ye a r obs er v a ti o n w it h s m al l a n n u al n e g a ti v e ear n in g s; DD1 it i s a d u m m y v ar ia b le t h at t a k es t h e v a lu e 1 w he n t h e c om pa ny i i s a u d it ed b y t h e B ig F ou r a u di t fi rm s a n d t h e fi rm -y ea r be lon gs t o t he f is ca l g ro up d ur ing t , a n d 0 ot he rw is e ; DD2 it i s a du m m y va ri a bl e tha t ta ke s t he v a lue 1 w he n t he c om p a n y i i s no t a udi te d by t he B ig F o ur a udi t fi rm s a nd t he f ir m -y ea r be lon gs t o t he n onf is ca l gr ou p du ri n g t , a nd 0 o th er w ise ; DD3 it i s a d u m m y v a ri a b le t h at t a k es t h e v a lu e 1 w h en t he c om p a n y i i s a ud it e d b y t he B ig F o ur a n d the fi rm -y ea r be lo ngs t o t he nonf is ca l g ro up d ur in g t , a nd 0 o th er w is e; DUAL it i s a d u m m y v ar iab le t ak in g t h e v a lu e 1 i f C E O i s t h e P res id e n t an d 0 o th er w is e a t th e p er io d t ; IN D it i s t h e p ro po rt ion of i nde pe n de n t di re c to rs on th e bo a rd a t p e rio d t; I N S it i s t he s h a re ho ld ings of i ns ti tut ion a l sh a re ho ld e rs a t t h e pe ri od t ; S IZEit i s th e n a tu ra l lo g a rit h m o f m a rk et v a lu e o f e q u it y a t p er io d t; L E Vi t is th e r a ti o o f to ta l lia b ili ty t o t o ta l a ss et s a t the pe ri od t ; F Yi t is a du m m y va ri a bl e t a k in g the va lu e 1 w h e n c o m pa ny i d oe s not be lo n g s to t h e n on fi sc a l gr ou p a t p er io d t, 0 ot h er w is e ; P RE RO E it i s t he m ea n of r et ur n of e q ui ty ( ne t i n c om e/ a ve ra ge e q ui ty ) ove r t he p a st f ive ye a rs .
Table 3
The Empirical Results of the Relationship Between the Stakeholders and Earnings Manipulation Around the Zero-Earnings Threshold
Variables Coefficient Estimate Std. Err. p-value
Intercept -0.1924 0.3233 0.5518 DD1it 0.0631 0.0998 0.5273 DD2it 0.5535 0.3706 0.1354 DD3it 0.4278 0.3682 0.2454 DUALit 0.0093 0.0944 0.9213 DUALit* FYit -0.0819 0.1088 0.4516 INDit 0.8122* 0.4748 0.0871 INDit* FYit -1.0017* 0.5497 0.0684 INSit 0.0040* 0.0024 0.0957 INSit* FYit -0.0004 0.0027 0.8819 SIZEit 0.0588 0.0402 0.1435 SIZEit* FYit -0.0769* 0.0455 0.0910 LEVit 0.1086 0.2635 0.6802 LEVit* FYit -0.4250 0.3034 0.1613 PREROEit 0.0062** 0.0026 0.0189
Notes: 1. ***, **, * indicate the statistical significance at 1%, 5% and 10% level respectively. It is two-tailed
p-value and the Wald value ofχ2 is 102.9186. (3,603 firm-year observations)
2. EMit which is a proxy variable that denotes manipulating earnings around the zero-earnings threshold, is a dummy variable that takes the value 1 for a firm-year observation with small annual positive earnings and 0 for a firm-year observation with small annual negative earnings; DD1it is a dummy variable that takes the value 1 when the company i is audited by the Big Four audit firms and the firm-year belongs to the fiscal group during t, and 0 otherwise; DD2it is a dummy variable that takes the value 1 when the company i is not audited by the Big Four audit firms and the firm-year belongs to the nonfiscal group during t, and 0 otherwise; DD3it is a dummy variable that takes the value 1 when the company i is audited by the Big Four and the firm-year belongs to the nonfiscal group during t, and 0 otherwise; DUALit is a dummy variable taking the value 1 if CEO is the President and 0 otherwise at the period t; INDit is the proportion of independent directors on the board at period t; INSit is the shareholdings of institutional shareholders at the period t; SIZEit is the natural logarithm of market value of equity at period t; LEVit is the ratio of total liability to total assets at the period t; FYit is a dummy variable taking the value 1 when company i does not belongs to the nonfiscal group at period t, 0 otherwise; PREROEit is the mean of return of equity (net income/average equity) over the past five years.
(4) * * * * * 3 2 1 14 13 12 11 10 9 8 7 6 5 4 3 2 1 0 it it it it it it it it it it it it it it it it it it it it it PREROE FY LEV LEV FY SIZE SIZE FY INS INS FY IND IND FY DUAL DUAL DD DD DD EM τ δ δ δ δ δ δ δ δ δ δ δ δ δ δ δ + + + + + + + + + + + + + + + =