Cancer is a major public health issue, due to both the suffering it causes and the financial bur-den that it places on patients and their families. In England, currently about one person in three
develops a cancer in their lifetime, and cancer
causes about one in four deaths.1 In Taiwan,
claims for the reimbursement of medical ex-penses for the diagnosis and treatment of cancer
Estimation of the Financial Burden to the
National Health Insurance for Patients
with Major Cancers in Taiwan
Po-Ching Chu,1Jing-Shiang Hwang,2Jung-Der Wang,1,3* Yu-Yin Chang1
Background/Purpose: Almost all countries that have national health insurance schemes face financial challenges. A better understanding of the financial burden that cancer places on Taiwan’s National Health Insurance (NHI) is important for helping policy makers to plan under scarce healthcare resources. This study attempts to estimate lifetime health expenditure for patients with 17 types of major cancers. Methods: A total of 425,294 patients, each of whom was registered in Taiwan during 1990 to 2001 as having one of 17 major types of cancers, were included. All of them were followed until the end of 2004. Monte Carlo simulation was used to extrapolate survival for up to 600 months to derive the life expectancy or lifetime survival function after diagnosis for different cancers. The average annual health expenditure per case for each cancer type was calculated by using data from the NHI’s reimbursement database. The lifetime health expenditure per case was estimated by multiplying the monthly survival probability by the average monthly health expenditure, adjusting for the annual discount rate and the medical care inflation rate. By incorporating the number of annual incidence cases, the total lifetime health expenditure can also be estimated.
Results: Of the 17 cancers studied, it was found that leukemia had the highest average annual health expenditure per case (207,000 TWD) as well as the highest lifetime health expenditure per case (2,404,000 TWD, without discounting adjustment). Breast cancer had the highest total lifetime health expenditure (5046 million TWD) because of the longer life expectancy and chronic morbidity. Furthermore, colorectal cancer had the second highest total lifetime health expenditure (4995 million TWD) due to its high incidence. Conclusion: The proposed method is a feasible way of estimating lifetime health expenditure for cancer patients even under high censoring rates. This would be helpful for cost-effectiveness assessment of cancer prevention programs and for policy planning. [J Formos Med Assoc 2008;107(1):54–63]
Key Words: cancer, health expenditure, health insurance, Monte Carlo method
©2008 Elsevier & Formosan Medical Association . . . .
1Institute of Occupational Medicine and Industrial Hygiene, College of Public Health, National Taiwan University,
2Institute of Statistical Science, Academia Sinica, and 3Departments of Internal Medicine and Environmental and
Occupational Medicine, National Taiwan University Hospital, Taipei, Taiwan. Received: March 22, 2007
Revised: June 21, 2007 Accepted: September 4, 2007
*Correspondence to: Professor Jung-Der Wang, Institute of Occupational Medicine and Industrial Hygiene, College of Public Health, National Taiwan University, 17 Xu-Zhou Road, Taipei 100, Taiwan.
on the National Health Insurance (NHI) scheme were the second highest among major illnesses
and injuries.2 The amount of reimbursement
represents a cause for concern regarding the main-tenance of the NHI, given the scarce resources and increase in medical expenses for diagnosing and treating cancers. Measuring the financial burdens on patients with cancers could be helpful for
financial planning,3–5 as well as for the
long-term maintenance of the NHI. However, previous studies have focused mostly on cross-sectional analysis of the financial burdens of cancer for a short period of time. The results of these studies may be useful for policymaking regarding cancer
patients with short-term life expectancy.6
How-ever, there remains a need to estimate lifetime
financial burdens,7which could be useful for the
evaluation of the cost-effectiveness of prevention
programs or new medical treatments.8The need
for such evaluation is urgent in Taiwan, where all medical costs related to the diagnosis and manage-ment of cancer are reimbursed comprehensively by the NHI.
To estimate the lifetime health expenditure for cancer patients, the lifetime survival function must be calculated first. The Monte Carlo method can be used to estimate the lifetime survival function beyond the follow-up limit with a certain degree
of accuracy.9It has been applied to patients who
have serious diseases or conditions that lead to pre-mature mortality, such as permanent occupational
disabilities,10transfusion-dependent thalassemia,11
and human immunodeficiency virus infection.12
In addition, the Taiwan NHI reimbursement
database, which covers 97% of the population,13
was used to estimate lifetime health expenditure for cancer patients. To the best of our knowledge, no previously published study has estimated life-time health expenditure for cancer patients in Taiwan. Therefore, the main objective of the study reported herein was to estimate the lifetime health expenditure for cancer patients paid by the NHI. The estimate was made by analyzing data from national databases: the National Cancer Registry database, the National Mortality database, and the NHI’s reimbursement database.
Methods
Subjects
A total of 425,294 cancer patients were recruited. The patients were grouped into 17 cancer co-horts according to the cancer sites, which were determined based on the code of the International Classification of Diseases taken from the National Cancer Registry database for the period from 1990 to 2001. Patients were followed up to the end of 2004 and the survival status for each can-cer patient was obtained by linking the patients’ identification (ID) and demographic informa-tion between the Nainforma-tional Cancer Registry data-base and the National Mortality datadata-base. The 17 major cancer sites were as follows: oral cavity, nasopharynx, esophagus, stomach, colorectum, liver, gallbladder and extrahepatic bile duct, pan-creas, lung, leukemia, skin, breast, cervix uteri, ovary, prostate, bladder, and kidney and other urinary organs.
Method for extrapolation of life expectancy
After 15 years of follow-up, the lifetime survival can be obtained for patients with cancers that yield a short life expectancy, such as liver, lung and pancreas cancers. However, there are several cancers that needed projection estimations. For these cases, we used the method proposed by
Hwang and Wang9to extrapolate the long-term
or lifetime survival curve beyond the follow-up period. The approach was to borrow the infor-mation from the age- and gender-matched refer-ence population, of which the survival function can be obtained from the life table of the general population in Taiwan. The extrapolation process comprised three phases. First, we chose a reference person of the same age and gender with a known hazard function in the life table of the general population from the National Vital Statistics. The survival function of the reference person was then generated according to the Monte Carlo method. Thus, for the cohorts of each type of cancer, we were able to produce an age- and gender-matched reference population and their survival
curves on the basis of the hazard function for the general population. Second, the survival func-tion for the cancer cohorts was divided by that of the reference population at each time t to pro-duce a new function, W(t), which was defined as follows:
W(t)= S (t | patient population) S (t | reference population) Because the cancer cohort has, overall, a lower survival time than the reference population, the value of W(t) initially equals 1 at time point
t= 0, then gradually decreases, due to the
cancer-associated excess mortality. Because the value of W(t) is limited to the range from 0 to 1, linear regression for the temporal trend is not applica-ble. We therefore used the logit transformation of W(t). The range of values was transformed
from 0 to 1 to that of −∞ to +∞. Furthermore,
if the cancer-associated excess hazard remains constant over time, the curve of the logit of W(t) will converge to a straight line. Then, the logit transformation of the ratio of survival curves for both the cancer and the reference populations was fitted by simple linear regression up to the end of follow-up. Finally, the estimated regres-sion line and the survival curve of the reference population were used to extrapolate the long-term survival function beyond the follow-up limit. Hence, life expectancy or the lifetime sur-vival function (up to 600 months) after diagno-sis could be estimated. In addition, the monthly survival probability could also be obtained. The above approach was demonstrated by computer
simulation in 1999,9 and was proven
mathe-matically, provided that W(t) is a fixed ratio after
a certain period of time.12 The standard error
of survival estimates was obtained by using a bootstrap method. The extrapolation process was implemented by using data that were simulated by repeated sampling techniques with replace-ment from a real data set 300 times. In order to facilitate the above computation, the statistical package MC-QAS, written in R and S-Plus software,
was used.14
Estimation of lifetime health expenditure paid by the NHI
The NHI’s reimbursement database for 2001, which contained data for all outpatients and in-patients with diagnoses involving the 17 major cancer sites, was obtained. In general, the NHI comprehensively reimburses all medical services for each cancer patient, including various diag-nostic work-ups and established treatments (e.g. surgery, radiation therapy, chemotherapy, or man-agement for various complications). When a can-cer patient visits a physician, it is the physician’s responsibility to judge whether the patient’s spe-cific complaint, and hence the medical services provided, are related to the diagnosis of his or her underlying cancer. If so, then the physician can claim for reimbursement on the category of cancer diagnosed, using the International Classification
of Diseases (9th revision, clinical modification
[ICD9-CM]), which is automatically registered into the database. The average annual health ex-penditure was estimated by using records from the database, which contained data on 200,000 insured persons, by implementing the procedure of simple random sampling established by the Bureau of NHI. The calculation process was as follows. First, the annual incidence and prevalence for each cancer site for 2001 were calculated from the National Cancer Registry and the NHI’s reimbursement database, respectively. Second, for each cancer site, we summed up the total med-ical expenses for each cancer type from the NHI database in 2001, which was then divided by the number of prevalence cases to obtain the average annual health expenditure per case. The average annual health expenditure per case was divided by 12 to obtain the average monthly health ex-penditure per case. This value was then multiplied by the monthly survival probability, calculated by using the Monte Carlo method, to obtain the lifetime health expenditure per case. Furthermore, the total lifetime health expenditure was esti-mated by multiplying the lifetime health expen-diture per case by the number of new cases in 2001. To discount costs in future years, we also adjusted the lifetime health expenditure, using two
annual discount rates (3% and 5%) and a medical care inflation rate (3%). The discount rates of 3% and 5% were recommended by researchers while conducting the cost-effectiveness
analy-sis15and 3.625% was the coupon rate of Central
Government Bonds with a maturity period of
30 years in 2001 in Taiwan.16Therefore, both 3%
and 5% were chosen to discount. In addition, the mean of annual change rates from 1995 to 2001 was 3.07 (standard deviation, 1.98), calculated from the data of the Consumer Price Indices (CPI)
for medical care services.17 Thus, an inflation
rate of 3% on the CPI for medical care services, as well as 3% and 5% for discount rates, were chosen for discounting to present values in 2001 or adjusting to the 2001 New Taiwan Dollar (TWD).
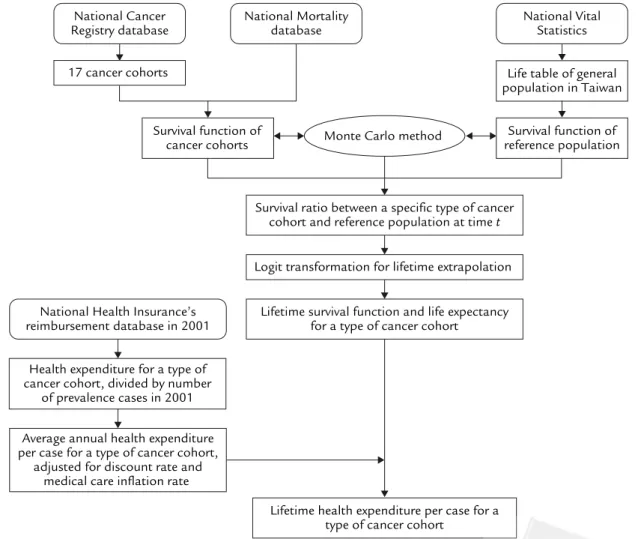
The major process of the method is summarized as a flowchart in Figure 1.
For comparison, we also estimated the average annual health expenditure for the general popu-lation without major illnesses in Taiwan. We ex-tended the estimation period from a single year (2001) to 5 years (1999–2003) to reduce a possi-ble random effect generated by healthy people who did not use the NHI reimbursement scheme during the short period of time (i.e. 2001). The database we used contained data on 200,000 insured persons, selected by using the procedure of simple random sampling established by the Bureau of NHI. Using the criteria for major ill-nesses that were provided by the NHI, we identi-fied 8651 patients with the codes of major illness
National Vital Statistics
Survival function of cancer cohorts
Life table of general population in Taiwan
Monte Carlo method
Lifetime health expenditure per case for a type of cancer cohort
Survival function of reference population
Survival ratio between a specific type of cancer cohort and reference population at time t
Lifetime survival function and life expectancy for a type of cancer cohort National Health Insurance’s
reimbursement database in 2001
Health expenditure for a type of cancer cohort, divided by number
of prevalence cases in 2001 Average annual health expenditure per case for a type of cancer cohort,
adjusted for discount rate and medical care inflation rate
Logit transformation for lifetime extrapolation National Cancer
Registry database
National Mortality database 17 cancer cohorts
Figure 1. Flowchart of estimation method for lifetime health expenditure per case of a specific type of cancer. Data were obtained from the National Cancer Registry and National Mortality Registry to calculate the survival function and extrapolate to lifetime by the Monte Carlo method, which were integrated with the annual (or monthly) average health expenditure obtained from the reimbursement file of the National Health Insurance to estimate lifetime health expenditure.
T
able.
Estimations of the health expenditur
e paid by the National Health Insur
ance for 17 cancer sites, adjusted for two discount r
ate
s and a medical car
e inflation r ate Lifetime health Total lifetime expenditur e per case health expenditur e Censoring Life expectancy , Annual number of Annual number of A ver
age annual health
(× 10 3 TWD) ( × 10 6 TWD) Cancer site expenditur e per case Medical car e Medical car e rate (%) yr (SE) incidence cases pr evalence cases (× 10 3TWD) inflation r ate (3%) inflation r ate (3%) Discount r ates Discount r ates 3% 5% 3% 5% Or al cavity 35.94 9.58 (0.61) 3549 15,677 95 910 725 3230 2574 Nasopharynx 43.06 12.59 (0. 74) 1371 13,908 53 632 496 867 680 Esophagus 11 .28 3.54 (0.20) 1229 6055 93 330 273 405 335 Stomach 26.80 7.51 (0. 14) 3501 13,310 81 609 487 2133 1704 Color ectum 41 .94 10.86 (0. 11) 7215 40,902 64 692 555 4995 4002 Liver 13.28 3.45 (0.08) 8541 31 ,368 69 238 203 2030 1731 Gallbladder & 17 .72 4.98 (0.20) 609 2359 90 446 365 272 223 extr ahepatic
bile duct Pancr
eas 8.28 2.81 (0. 17) 992 3231 94 263 211 261 209 Lung 9.97 3.09 (0.07) 6752 22,304 111 342 286 2313 1932 Leukemia 28.49 11 .61 (0.94) 962 5236 207 2404 1706 2312 1641 Skin 62. 18 16. 16 (0.22) 1806 4368 22 354 276 640 499 Br east 66.94 20.01 (0.80) 4667 35,082 54 1081 817 5046 3812 Cervix uteri 63.92 19. 77 (0.30) 2423 22,225 41 808 608 1958 1474 Ovary 52.59 17 .71 (0.80) 737 5366 72 1277 939 941 692 Pr ostate 44.65 8. 17 (0. 13) 1991 10,348 65 527 463 1050 922 Bladder 46.93 10.99 (0.20) 1756 9748 47 519 426 911 748
Kidney & other
43.68 10.97 (0.85) 1502 7353 48 528 423 794 635 urinary or gans SE = standar d err or .
who had visited a healthcare facility during the period 1999–2003. We removed the 8651 patients from the 200,000-person database, and totaled the health expenditure for that portion of the general population that was free from major illness for the period 1999–2003. The total remaining health expenditure was 9,819,674,747 TWD, which was
divided by 5 (years) and 191,349 (= 200,000 –
8651 persons) to obtain the average annual health expenditure per case, or 10,264 TWD.
Results
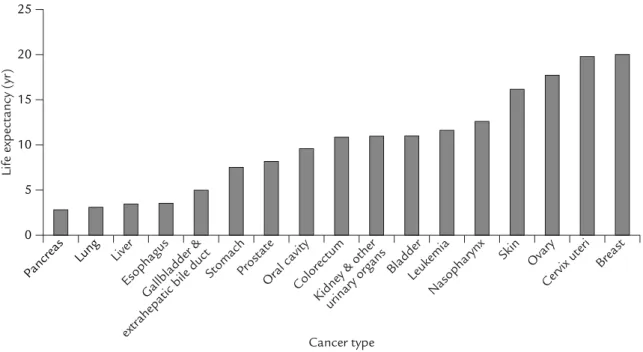
The percentage of patients who survived to the end of the 15-year follow-up (the censoring rate), i.e. to the end of 2004, according to cancer type, ranged from 8% to 67% (mean, 36%). The life expectancy after diagnosis for the 17 major can-cer sites is summarized in the Table and Figure 2. The Table also shows the average annual health expenditure and the lifetime health expenditure for the 17 major cancer sites, which were adjusted by two annual discount rates and one medical care inflation rate, and expressed in TWD. Cancers of the liver and the gallbladder and extrahepatic
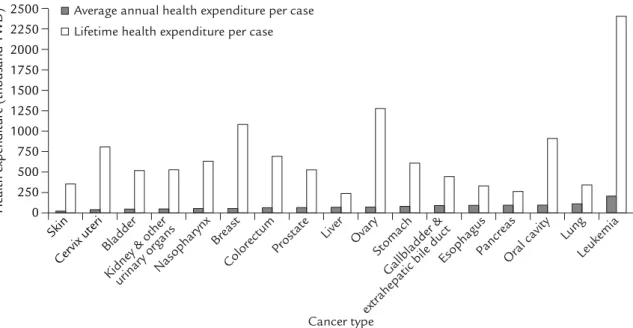
bile duct had, respectively, the largest (8541) and smallest (609) number of new or incidence cases in 2001. Cases of cancers of the breast and co-lorectum were more prevalent in the year than cases of liver cancer, because patients with these cancers generally survive longer. Figure 3 shows that cancers with a longer survival time place a higher lifetime financial burden per case on the NHI. For example, although the average annual health expenditure per case for cancer of the ovary, breast, and cervix uteri were lower than that for many other types of cancer, the lifetime health expenditure per case for these cancers was generally higher than for others. Leukemia had the highest average annual health expenditure per case (207,000 TWD) as well as the highest lifetime health expenditure per case (2,404,000 TWD). Breast cancer had the highest total lifetime health expenditure (5046 million TWD) because of the long life expectancy. Furthermore, colorec-tal cancer had the second highest tocolorec-tal lifetime health expenditure (4995 million TWD) due to its high incidence. In addition, when the chosen discount rate and medical care inflation rate were the same (3%), the estimated costs were the same as those without adjustment for both rates.
0 5 10 15 20 25 Pancreas Lung Liver Esophagus Gallbladder & extrahepatic bile duct
StomachProstate
Colorectum Oral cavity
Kidney & otherurinary organs
Leukemia Bladder Nasopharynx Skin Ovary Cervix uteri Breast Cancer type
Life expectancy (yr)
Discussion
Although we have estimated the lifetime health expenditure to the NHI for major cancers, the validity and limitation of the estimations must be addressed before conclusions can be drawn. Extrapolation using the Monte Carlo method
re-quires assumptions about premature mortality9
and a stable survival ratio between the cancer
cohort and the reference population.12 Should
these assumptions be unwarranted, the validity of the study would be threatened. However, the Monte Carlo method has been confirmed, in pre-viously published studies with validity tests, to possess good validity for extrapolating the life-time survival of patients with serious conditions and diseases, such as permanent occupational
disabilities,10serious occupational injuries,18and
acute myelogenous leukemia.19Moreover, because
the lifetime extrapolation is based on previous and current clinical experiences, such as the life table of the general population, the actual survival (and hence, the health expenditure) is usually underestimated. This is because the active devel-opment and adoption of newer technology for cancer treatments extends the survival time. For
example, currently, integrated cancer screening is being implemented more extensively in Taiwan; hence, more patients with early cancers can be
detected and may survive longer as a result.20Thus,
our estimate of the financial burdens of cancer patients on the NHI may even be conservative. Given the use of new technologies that may pro-long survival, the estimates should be revised periodically to obtain figures on life expectancy and health expenditure that are more accurate. In order to improve the accuracy of estimates of life expectancy and health expenditure, future work should focus on the following two factors. First, some prognostic factors, such as tumor
stag-ing and performance status21,22 of the cancer
cohort, could be considered. The cancer cohort could then be stratified to a sub-cohort accord-ing to these factors. Second, although for com-parison we calculated the average annual health expenditure per case (10,264 TWD) for people of the general population who did not have major illnesses, our estimates based on the NHI reim-bursement data could not be considered as purely cancer-attributable medical costs. In order to over-come the challenge, details of some potential con-founders (for example, underlying or concomitant Average annual health expenditure per case
Lifetime health expenditure per case
0 250 500 750 1000 1250 1500 1750 2000 2250 2500
Health expenditure (thousand TWD)
Skin
Cervix uteriBladder
Kidney & otherurinary organsNasopharynx Breast
Colorectum
Liver Prostate Ovary
Gallbladder & extrahepatic bile duct
Stomach
EsophagusPancreasOral cavity Lung
Leukemia
Cancer type
diseases) could be considered to facilitate better comparability of the cancer cohort and the
ref-erence population23 as well as to improve the
accuracy of the estimates.
The method employed in our study used the average annual costs for the estimation, which counts the total number of prevalence cases in a particular year as the denominator and assumed that a patient suffering from a major cancer gen-erally comes back to a clinic or hospital at least once a year for cancer management or follow-up checks, even after treatment has been completed. There is probably no need to worry about this assumption for cancers with a short life expectancy (say, less than 5 years) such as cancers of the liver, lung and pancreas. However, the assumption may not be valid for cancers with long life expectancy. Nonetheless, since all types of cancer are consid-ered to fall into the category of catastrophic illnesses and all clinic or hospital visits related to cancer are covered comprehensively by the NHI, the potential overestimation of annual medical costs from under-counting the number of prevalence cases might be low.
Because the financial burden on the NHI de-pends not only on the survival function, but also on the chosen discount and medical care inflation rates, the estimation of the health expenditure for cancers that have longer survivals, e.g. breast, cervix uteri and ovary, is affected more sensitively by the chosen rates than the estimation of the health ex-penditure for other cancers. Technologic advance-ments regarding the diagnosis and treatment of cancer develop more quickly than for other prod-ucts; hence, there are uncertainties associated with the use of the annual change rate of the CPI,
which is based on average costs.17Thus, the
poli-cymaker could conduct a sensitivity analysis to determine how various discount rates and medical care inflation rates may affect financial planning. In accordance with welfare economics, the ideal approach for estimating the value of health improvements, such as the prevention of a specific type of cancer, may be to consider how much
people are willing to pay.24,25Although quantifying
the value of willingness to pay (WTP) is more acceptable for resource allocation, it is difficult to measure, especially if one is asked to respond
to a state behind a veil of ignorance.26An
alter-native approach is to measure the cost of illness by counting the combination of indirect costs (loss of earnings) and direct costs (medical ex-penses), which is considered to be the lower bound
of WTP.24 This study only estimated the health
expenditure paid by the NHI. This underestimates even the direct costs, because at least out-of-pocket expenses, such as those for transportation to and from the hospital and the hiring of addi-tional persons for supportive care, are not included. Nonetheless, our estimations of the health expen-diture paid by the NHI could be helpful for the NHI’s policy planning, especially for prevention
programs for different types of cancer.27
The total cost of cancer includes not only the suffering of patients from premature mortality and morbidity, but also the financial burdens on the NHI of diagnosing and treating cancer. In the study reported herein, we successfully estimated the lifetime costs for 17 different types of cancer. Our estimates will be useful for the future assess-ment of cost-effectiveness for the comparison of different policies on cancer control. For example, hepatitis B virus (HBV) is a causal factor for he-patocellular carcinoma. The costs of immuniza-tion (say, HBV vaccine) and/or treatment of HBV infection could therefore be compared with the periodic sonographic and/or serum tumor maker
(say, α-fetoprotein) for hepatocellular carcinoma.
In addition, since effective prevention measures may eliminate completely both the patient’s pre-mature mortality and morbidity and the finan-cial burdens on the NHI, future research should also focus on preventive medicine, rather than only on the development and adoption of new technology for diagnosis and treatment. Cancers with chronic morbidity should have higher pri-ority with respect to the development of pre-ventive medicine. For example, cancers of the oral cavity and breast, which have longer periods of morbidity and larger average annual health
expenditure per case, should have a higher prior-ity for prevention research and action than other types of cancer. Furthermore, our estimates can also be used by the NHI directly, as an overview of the potential financial benefit if a specific type of cancer (e.g. hepatocellular carcinoma) can be prevented by implementing a prevention measure such as immunization (say, HBV vaccine).
In conclusion, we have proposed and imple-mented a feasible method of measuring the life-time health expenditure or the financial burden for cancer on the NHI, even with high censoring rates (for example, the mean of 36% that we found in our study). The results may be helpful to public health researchers and policymakers. The estimation of the financial burdens of cancer patients, as well as other traditional measures of the burden of cancer, e.g. incidence, prevalence, mortality, and years of life lost, could be used to establish public health goals, to assess the alloca-tion of healthcare resources across disease cate-gories, and to evaluate the potential costs and
benefits of public health interventions.3
Acknowledgments
This study was supported by the following two grants: Bureau of Health Promotion, Department of Health (DOH94-HP-1801), and National Health Research Institute (NHRI-EX95-9204PP).
References
1. Office for National Statistics, UK. Cancer Statistics Registrations Series MB1 No. 34. London: Office for National Statistics, UK, 2005.
2. Bureau of National Health Insurance, Taiwan, R.O.C. 2003 National Health Insurance Annual Statistics Report. Taipei: Bureau of National Health Insurance, Taiwan, R.O.C., 2004. [In Chinese]
3. Brown ML, Lipscomb J, Snyder C. The burden of illness of cancer: economic cost and quality of life. Annu Rev Public Health 2001;22:91–113.
4. Lee JM, Turini M, Botteman MF, et al. Economic burden of head and neck cancer. A literature review. Eur J Health Econ 2004;5:70–80.
5. Avritscher EB, Cooksley CD, Grossman HB, et al. Clinical model of lifetime cost of treating bladder cancer and asso-ciated complications. Urology 2006;68:549–53. 6. Kutikova L, Bowman L, Chang S, et al. The economic
bur-den of lung cancer and the associated costs of treatment failure in the United States. Lung Cancer 2005;50:143–54.
7. Mullins CD, Wang J, Cooke JL, et al. Longitudinal versus
cross-sectional methodology for estimating the economic burden of breast cancer: a pilot study. Pharmacoeconomics 2004;22:285–91.
8. Maroun J, Ng E, Berthelot JM, et al. Lifetime costs of colon and rectal cancer management in Canada. Chronic Dis Can 2003;24:91–101.
9. Hwang JS, Wang JD. Monte Carlo estimation of extrap-olation of quality-adjusted survival for follow-up studies. Stat Med 1999;18:1627–40.
10. Ho JJ, Hwang JS, Wang JD. Life-expectancy estimations and the determinants of survival after 15 years of follow-up for 81,249 workers with permanent occfollow-upational dis-abilities. Scand J Work Environ Health 2006;32:91–9. 11. Ho WL, Lin KH, Wang JD, et al. Financial burden of national
health insurance for treating patients with transfusion-dependent thalassemia in Taiwan. Bone Marrow Transplant 2006;37:569–74.
12. Fang CT, Chang YY, Hsu HM, et al. Life expectancy of patients with newly-diagnosed HIV infection in the era of highly active antiretroviral therapy QJM-INT J MED 2007; 100:97–105.
13. Lu JF, Hsiao WC. Does universal health insurance make health care unaffordable? Lessons from Taiwan. Health Aff (Millwood) 2003;22:77–88.
14. MC-QAS software for estimating expected quality-ad-justed survival time. Available from http://www.stat. sinica.edu.tw/jshwang/qas.htm [Date accessed: January 2, 2006]
15. Lipscomb J, Weinstein MC, Torrance GW. Time prefer-ence. In: Gold MR, Siegel JE, Russell LB, Weinstein MC. Cost-effectiveness in Health and Medicine. New York: Oxford University Press, 1996:214–46.
16. National Treasury Agency, Ministry of Finance, Taiwan. Business Annals of National Treasury Agency: Issuance Information of Central Government Bonds. 2003;Jun: 90–2.
17. Directorate-General of Budget, Accounting and Statistics Executive Yuan, Taiwan. Commodity-Price Statistics Monthly in Taiwan: Consumer Price Indices by Basic Group in Taiwan Area. 2004;Oct:21.
18. Ho JJ, Hwang JS, Wang JD. Estimation of reduced life expectancy from serious occupational injuries in Taiwan. Accid Anal Prev 2006;38:961–8.
19. Hsu C, Wang JD, Hwang JS. Survival-weighted health profile for long-term survivors of acute myelogenous leukaemia. Qual Life Res 2003;12:503–17.
20. Chen THH, Chiu YC, Luh DL, et al. Taiwan Community-based Integrated Screening Group. Community-Community-based
multiple screening model: design, implementation, and analysis of 42,387 participants. Cancer 2004;100:1734–43. 21. Pasini G, Polselli A, Tonelli U, et al. Evaluation of the cost of home care for terminally ill cancer patients. Support Care Cancer 1997;5:396–401.
22. Fireman BH, Quesenberry CP, Somkin CP, et al. Cost of care for cancer in a health maintenance organization. Health Care Financ Rev 1997;18:51–76.
23. Wang JD. Study design. In: Wang JD. Basic Principles and Practical Applications in Epidemiological Research. Singapore: World Scientific, 2002:161–96.
24. Kenkal D. Cost of illness approach. In: Tolley G, Kenkal D, Fabian R. Valuing Health for Policy: An Economic
Approach. Chicago: The University of Chicago Press, 1994: 42–71.
25. Cunningham K. Cost of illness handbook. U.S. EPA. Available from http://www.epa.gov/oppt/coi/ [Date accessed: November 9, 2005]
26. Garber AM, Weinstein MC, Torrance GW, et al. Theoretical foundations of cost-effectiveness analysis. In: Gold MR, Siegel JE, Russell LB, Weinstein MC. Cost-effectiveness in Health and Medicine. New York: Oxford University Press, 1996:25–53.
27. Rice DP, Hodgson TA, Kopstein AN. The economic costs of illness: a replication and update. Health Care Financ Rev 1985;7:61–80.