Reprints available directly from the publisher Photocopying permitted by license only
the Gordonand Breach Science Publishersimprint.
A
Transient
Method
Using
Liquid
Crystal
for
Film
Cooling
Over
a
Convex
Surface
PING-HEI CHEN*, MIN-SHENG HUNGandPEI-PEIDING
DepartmentofMechanical Engineering, National Taiwan University, Taipei 10617, Taiwan
(Received23May2000;Infinalform27May 2000)
Inordertoexplorethe effect of blowingratio on filmcoolingover a convexsurface,the present study adopts the transient liquid crystal thermography for the film cooling
measurement on astraight circular hole configuration. Thetestpiece hasastrengthof curvature (2r/D) of92.5, pitch to diameter ratio (P/D) of 3 and streamwise injection
angle (7) of 35 All measurements were conducted under themainstream Reynolds
number (Red) of 1700 with turbulence intensity (Tu) of3.8%, and the density ratio between coolant andmainstream(P/Pm)is0.98. Incurrentstudy,theeffect of blowing ratio(M)onfilm coolingperformanceisinvestigatedbyvarying therangeof blowing
ratiofrom 0.5 to 2.0. Twotransient tests of differentinjection flow temperaturewere
conductedtoobtainbothdetailedheat transfer coefficientand film cooling effectiveness distributions of measured region. The present measured results show that both the spanwiseaveragedheat transfer coefficient and film cooling effectivenessincreasewith decreased blowingratio.
Keywords: Convexsurface;Filmcooling; Liquidcrystal thermography
INTRODUCTION
Film coolingis a technique of cooling gasturbine
blades to protect them from high temperature
gases. The technique could be used by injection of
afilmof coolingair ontotheblade surfacethrough
discrete holes. These holes are typically inclined
at approximately 30 to 40 with respect to the
surface. Past film cooling studies have
concen-trated on film cooling effectiveness and heat
transfer coefficient of flat surfaces.
However,
theflow through turbine passages will experience
strong curvature effect, which is not observable
inflow overflat surfaces.
Itoetal.
(1978)
conducted coolingfilmmeasure-ments on curved surfaces for a wide range of
blowingratesbymasstransferanalogy. Theyused
a foreign gas injection technique to measure
impermeable wall concentrations downstream of
a row of injection holes and to obtain the
impermeable-wall effectiveness. Their research
showed thatfilm coolingeffectivenessofa convex
*Corresponding author.Tel.: 886-2-23621522 ext11(0), Fax:886-2-23644871,e-mail:[email protected]
surface is higher than both flat and concave surfaces when the tangential component of
injec-tion flow momentum flux ratio
(I
cos2"y)
is lessthan unity at injection angle between 0 to 90
.
Ko et al.
(1986)
measured the static pressure andthe film cooling effectiveness of both convex and
concave surfacesat different blowingratios. Their
experimental results suggested that the distance
between cooling holes on the convex surface
should be smaller than those on concave surface.
A
smaller blowing ratio should also be used onconvex surface, because the recirculationis
stron-gerontheconvex surface thanonconcavesurface
even atlow blowing ratio of0.5.
Schwarzetal.
(1991)
usedaforeign gas injectiontechniquetostudytheeffects ofstrengthofconvex
surfacecurvature onthefilmcoolingperformance.
They considered three different strengths of
curvature (ratio of radius of curvature to radius
of injection hole), density ratios of 0.95 and 2.0,
and blowing ratios of 0.3 to 2.7. Their
experi-mental results showed that cross-stream pressure
gradient tends to shift film cooling jets onto the
convex surface and away from the concave
surface.
At
low blowing ratio, where bothtangen-tial and normal momenta are weak, the film
cooling on a convexsurface is moreeffective than
a flat surface that has better performance than a
concave surface. Goldstein et al.
(1997)
measuredfilm cooling effectiveness on both convex and
concave surfaces at different injection angles and
blowingratiosby usingmasstransferanalogy.The
flow field was visualized by an ammonia vapor
injection system. They found that at very low
blowing ratios, the injection flows were ejected
gentlyintothe boundary layer of mainstream, and
the film cooling effectiveness would increase with
blowingratio independently of injectionangle.
As
the blowing ratio is increased beyond the lift-off
blowing ratio
(the
blowing ratio at which thecooling jets lift away from the surface and
effectiveness begins to drop), the shallower
injec-tion angles perform better. The trajectory of
shallower injection flows being somewhat closer
to thesurfaces than that of steeper injection flows.
Recently, some researchers have predicted the
film cooling effectiveness by numerical method.
Berheetal.
(1999a)
used algebraicrelations fortheturbulent viscosity and the turbulent Prandtl
number in a modified k-e turbulence model to
study the effects of surface curvature on film
cooling performance. Computations were
per-formed at blowing ratios of 0.5, 1.0 and 1.5 with
a density ratio of 2.0 along convex, concave and
flat surfaces. Berhe etal.
(1999b)
also investigatedthe effect of several film cooling parameters
including blowing ratio, injection angle, hole
length, hole spacing and hole staggering. Lin
et al.
(1998)
used a low-Reynolds numberturbu-lence model to investigate film cooling of flat and
convex surfaces. They showed that the injection
flow lift-offphenomenon depends notjust on the
momentum flux ratio but also on the profile of
boundary layer and the ratio of boundary layer
thickness tohole diameter.
According to published studies, the
environ-mental conditions must be well-controlled during
measurements using the liquid crystal
thermogra-phy. Camci etal.
(1992)
investigated the effects ofthe strength of the light source illuminating the
heat transfer surface, the orientation of the light
source with respect to the surface, the uniformity
ofcoated liquidcrystal layer,and the repeatability
of the measured results. They suggested that the
image capturing process should beperformedwith
the same illumination angle and the illumination
source should be fixed at a specific location for
both the calibration process and measurement.
Behleet al.
(1996)
showed that the calibration ofcamera and light source as the calibration step is
very important to avoid an unreliable hue versus
temperature relation. Besides the hue versus
temperature relations that depend strongly on
the coating thickness, the signal noise versus
temperature relation was compared. They used
both the TLC spray (34gin) and sheets to
investigate the dependence of the hue values on
variation of illumination and viewing angle foran
off-axis and an on-axis camera and light source
Since the film cooling phenomena on curved
surfaces are more complex than on flat surfaces,
the detailed studies on local film cooling
perfor-mance over the whole area of the curved surface
areneeded for theturbineblade design purpose.In
this study, detailed heat transfer coefficient and
film coolingeffectiveness distributions are
demon-strated over a convex surface by employing
transient liquid crystal thermography
(Vedula
and
Metzger,
1991; Ekked et al., 1997a, b and Chen et al.,1998).
For the present experimentalmeasurement, thestreamwise injectionangle
(3’)
is35 and the spanwise injection angle is 0
.
Theblowing ratio
(M)
wasvariedfrom 0.5 to 2.0 at amainstream Reynolds number
(Red)
of 1700 withturbulence intensity of 3.8%, and the curvature
strength
(2r/D)
ofconvex testpiece is 92.5.THEORY
The present experiment used the thermochromic
liquidcrystalforthesurface temperature
measure-ment. Liquid crystal is very suitable to show the
transientsurface temperature, since theirresponse
is repeatable and their colors can be easily
recorded with a video system. The local heat
transfer coefficient over the liquid crystal coated
surface without cooling film can be obtained by
one-dimensional semi-infinite. The
one-dimen-sional transient heat conduction equation, the
convection boundary conditions, and the initial
condition on the liquid crystal coated surface are:
02T
OT k-O-z
2 p Cps O(1)
OT h(Vw-T Ti(2)
att=O,
T=Ti(3)
where k, Cp and p are respectively the thermal
conductivity, the specific heat and the density of
testpiece. The analytic solution of
Eq. (1)
on thesurface
(z
0)
becomes:Tw-Ti_l_exp(h2ct)
(hV/-)
Tm-
Ti-
erfc k(4)
The film cooling over a surface involves three
temperatures, including the mainstream
tempera-ture, coolant flow temperature and wall surface
temperature. The mainstreamtemperature
(Tm)
inEq.
(4)
will bereplaced by afilm temperature(T
f)
during the data analysis. To find the unknown
TU
(in terms of known quantities
Tm
andTc),
anondimensionaltemperature is defined asthe film
cooling effectiveness:
rm
(5)
r-_
Tm
Substituting
Eq. (5)
intoEq. (4)
givesexp
(
h2ct
-5--)
erfc(
hx/
[ rc
+
)rm
(6)
The two unknown parameters are h and r/. In
the present study, two film cooling tests with
different
Tc
have been completed. Duringmea-surements, the temperature rises of both
main-stream and injection flow are functions of time,
insteadof step temperature change.Therefore, the
Duhamel’s Super-position should be used to
modify thetimevarying temperaturerises at inlets
of both mainstreamand injection flows.
Besides the heat transfer coefficient and film
cooling effectiveness, heat flux ratio is another
important parameter used to quantify the film
coolingperformance.The present study adopts the
expression of heat flux ratio as defined by Ekkad
etal.
(1997b)
given byq_h(Tw-Taw)
h(1
qo
ho(Tw
Tm)
ho
(7)
where q5 is the overall cooling effectiveness. In
EXPERIMENTAL APPARATUS
AND PROCEDURES
Thetest sectionused for the experimental analysis
ofthe film cooling effectiveness and heat transfer
characteristics is shown in Figure 1. The
experi-mental investigation was conducted in a wind
tunnel with rectangular cross-section of 10cm x
5cm and a bend of 135 The wind tunnel
consisted ofamixsection,auniformdevelopment
section, and a curved test section as shown in
Figure 1. The radii of curvature of the curved
surfaces in the test section was 16.6cm. The
mainstream velocity
(Um)
was kept at a constantvalue of9.1
m/s.
The velocity of mainstream wasmeasured by a hot-film anemometer
(Dantec,
Flow Master
54N60).
The free stream turbulenceintensitywascontrolled by turbulence grid formed
by cylindrical bars located upstream of the test
section. The free stream turbulence wasmeasured
using a hot-wire anemometer, which was
cali-brated byTSI intelligent flow Analyzer
(IFA-100)
withconstant temperature anemometer operation
method.
Theboundarylayerwastrippedat adistance of
10cm upstream of the leading edge of injection
Heater&Fan TemperatureControl Compressor bypass PC+FrameGrabber+LCIA Flow Flow
Development!
section HotFilm Thermocouple TurbulanceGridValve Flang-tyleOrifice Step
SonyHi-8
RecoverySection
Flow
Straightener
holesbya 1.5-mm-diatripwire.The injection flow
wasinjectedthroughasinglerowof injection holes
with hole spacing of 3D along the spanwise
direction. The hole diameter
(D)
was 3.6mm andtheratioof hole lengthtoholediameter
(L/D)
was3.5. The strength of curvature
(2r/D)
and thestreamwise injection angle
(/)
were 92.5 and 35respectively, as shown in Figure 2. The plexiglas
testsurfacewascoatedwithblack paint andathin
layer of thermochromic liquid crystal. The
emis-sivityofthe black paintis0.94. The injectionflow
was supplied by a reciprocating-type compressor
that hasacapacityofproducinganairflowrateof
0.0018m3/s
at pressure of 7atm.A
calibratedflange-type orifice was used to measure the mass
flow rate of injection flow. The injection flow
was heated by heating wires fixed at the inlet of
the injection holes. The distance between heating
wiresand the injection holes is205 mm. The
heat-ing wire diameter is 1.2mm and the ratio of the
distancebetween the wires and the injection holes
to the wire diameter is 170.8. The mainstream
temperature and the initial temperature on test
surface were measured by
T-type
thermocouples,and a temperature recorder (Rustrak-Ranger
II)
records the time-varying temperatures during
measurements.
The injection flow andmainstream were heated
before the onset of measurement. When the
temperature of injection flow and mainstream
attained the desired experimental temperature,
both injection flow and mainstream were diverted
instantaneously into injection holes and test
section. Meanwhile, the temperature recorder
and Hi-8 video recorded thetemperature histories
of both injection flow and mainstream, and the
color-changing image of liquid crystal.
Color-changing images recordedonvideotapeswerethen
transmitted to a personal computer by a frame
grabber and analyzed using image processing
software. The transient time was taken through
LCIA V3.0 (Liquid Crystal
Image
AnalyzerVersion
3.0).
The operating conditions are listed in Table I.
The mainstream velocity measured by hot-film
anemometer was
9.1m/s
at 25cm upstream ofinjection holes. The mainstreamReynoldsnumber
was 1700 based on the inlet diameter of injection
lO.8nnn r’----I r" 7
0-O-
T
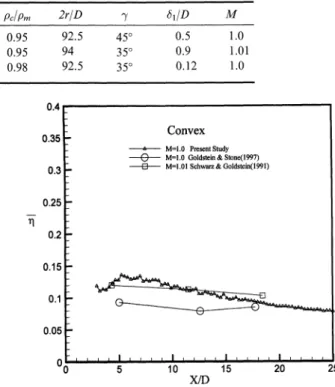
J’ X L JTABLE Testconditions forthe measured resultsshown inFigure3
Authors P/D
LID
Pc/Pro 2riD 7 I/D MGoldsteinetal. (1997) 2.96 10 0.95 92.5 45 0.5 1.0
Schwarzetal. (1991) 3 10 0.95 94 35 0.9 1.01
Thepresentstudy 3 3.5 0.98 92.5 35 0.12 1.0
hole.Themeasured turbulence intensitywas3.8%.
Measurements were conducted at five different
blowing ratios of 0.5, 0.75, 1.0, 1.5 and 2.0.
The estimated uncertainty in the effective data
was
+
5 percentestimatedby theroot meansquaremethod by Moffat
(1988).
There are afew factorsthat affect the uncertainties ofh and r/, including
mainstream temperature, injection temperature,
initialtemperature, wall temperature., and thetime
of liquid crystalcolorchange. Forthe experiments
done in this study, the total uncertainties of h
and r] were respectively around 7.2% and 10.4%
of their nominal values
(h=29.038W/m2K
andr/=
0.3232).
Furthermore,theestimateduncertain-ties for the Reynolds number, blowing ratio,
mainstream turbulence intensity, and boundary
layer displacement thickness were respectively
3.4%, 2.8%, 4.3% and 5.6%. 0.4 0.35 0.3 0.25 0.2 0.15 0.1y 0.05 Coflvex
M=I.0 PrsentStudy Q M=I.0 Goldstein& Stone(1997)
---E]---M=I.01 Schwarz&Goldstein(1991)
o0
5 10 15 20 25FIGURE3 Comparisonwithprior measured resultsof span-wise averaged film cooling effectiveness over convex surface withsimpleholeconfiguration.
RESULTS AND DISCUSSION
In Figure 3, the spanwise averaged film cooling
effectiveness result is compared with the
experi-mental results of Goldstein et al.
(1997)
andSchwarz et al.
(1991).
The present result isclose to the result of Schwarz et al. The lower
values in the result of Goldstein et al. might be
due to the larger injection angle of45
.
Goldsteinet al. stated that shallower injection angles have
the better effectiveness near injection holes on a
convex surface, as show in the comparison result
ofFigure 3.
Detailed distributions of local heat transfer
coefficient ratio
(h/ho)
at four different blowingratioof 0.5, 1.0, 1.5 and 2.0are shown in Figure 4
to demonstrate the influence of cooling film on a
convex surface. At blowing ratio
(M)
of 0.5, it isobvious that
h/ho
increases just downstream ofConvexSimple Hole M=0.5
47;,,,
.,
2Y/Yo!
(a) xm 4Y/Yo
o -2 (b)Convex Simple Hole M=I.0
0 10 15 20 25 X/D h/h ;1.68571 i’i;"::il i.62857 i.51429 1.45714 i.4 1.28571 1.22857 1.17143 1429 1,05714 h/h 1.8 1.74286 1.68571 1.62857 1.57143 1,51429 1.45714 1.4 1,34286 1.2857 1.22857 1.17143 1.11429 1,05714
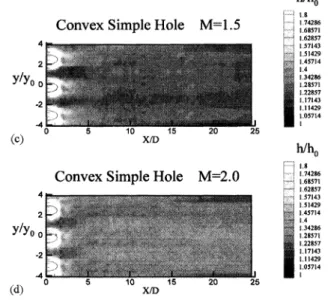
FIGURE4 Localheat transfer coefficient ratio distributions at(a)M=0.5;(b)M= 1.0;(c)M= 1.5;(d)M=2.0.
ConvexSimple Hole M=l.5
Y/Yo
o -2 -4 10 15 20 25 (c) x/DConvex SimpleHole M=2.0
Y/Yo
-2 -4 5 10 15 20 25 (d) X/D FIGURE4 (Continued). lffh 1.74286 1.68571 1,628s7 1.51429 1.45714 1.4 !,34286 1,28571 1.22857 1.17143 1.11429 1,05714 h/h 1.74286 1.68571 1,62857iiiii
57143 1.51429 1,45714 1.4 1,34286 1.28571 1.22857 1.17143 11429 1.05714injection holes.
Moreover,
high heat transferregions around bothsidesof injectionholes,which
may be caused bycounter-rotating vortexpairsat
theexit ofholesisclear too.Therefore,the
h/ho
onthe centerline regions downstream
(3
<
X/D < 8)
ofinjection holes becomes lower than the regions
adjacent toit because the counter-rotating vortex
pairs has brought the hot gas away from the
surface.
The centerline region with
h/ho>
1.8down-stream of injection hole for M=1.0 is smaller
than at M--0.5,as shownin Figure
4(b).
Becauseofhigher
h/ho
at a low blowing ratio of 0.5, it isexpected that the spanwise averaged value of
h/ho
atM 1.0willbe lower than the valueatM 0.5.
In Figure
4(c),
when blowing ratioincreases to 1.5,the increased mass of injection flow will increase
the mainstream boundary layer thickness and
decrease
h/ho
at downstream regions ofX/D >
7.When the blowing ratio is increased to 2.0 as
shownin Figure
4(d),
theh/ho
atregions betweentwo injection flows become higher than the
centerline downstream regions of injection holes
due tothe strong interaction of formed horseshoe
vortices between neighboring holes. This
phenom-enon indicates the instantaneous disturbance of
mainstream caused by the injection flows ejected
through film cooling holes.
At
low blowing ratio, the injection flows stayclose to the convex surface because of the lower
momentum ratio. Therefore, the injection flows
increase the surface heat transfer effect onconvex
surface.
As
the blowingratioincreases, the ejectedjets will lift-off the surface immediately after
leaving the injection holes, and form the lower
heat transfer value than M=0.5 even at low
X/D
region.
At
high blowing ratio, the counter-rotatingvortex pairs formed within the ejected jet are
strong. The interactions among the vortices of
neighboring injection flows provide high
h/ho
onthe regions between injection flows. Fric et al.
(1994)
observed that the injection flows will lift away from the wall immediately after the injectionflowsexitthe injection holes because both injection
flowmassflux andmomentumratio are increased
when blowing ratio increases. The horseshoe
vortex will be formed when the mainstream
encounters the ejected jets, and wake vortices will
appear at downstream regions along centerline of
injection holes.
A
reproduction of Figure in thework of Fric et al. is given as Figure 5. Both
the horseshoe vortex and wake vortices increase
the surface heat transfer. It is shown that
h/ho
atmost regions of M--2.0 is higher than M--1.5
in Figure4 of the present study.
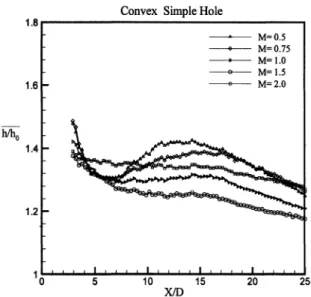
Figure 6 illustrates the effect of blowing ratioon
the spanwise averaged heat transfer ratio
(h/ho)
for 2.9
<
X/D
<
25. The spanwise averaged resultsfor regions of
X/D
<
2.9 are not providedin thiswork since the one-dimensional heat conduction
model used in data analysis might not be
applic-able to the three-dimensional thermal-fluid
be-havior around these injection holes.
For
X/D >
8,itisobvious that the value ofh/ho
rises at blowing ratios of 0.5 and 0.75, because
injection flows of lowermassandmomentum ratio
will be constrained against the wall by
main-stream. Therefore,
h/ho
is higheratlower blowingratio at most measured regions as shown in
Figure 6. The injection flows ejected into the
Counter-rotating
vortexpair
Jet shear-layer
vortices Horseshoe vortices Wake vorticesWall
FIGURE5 Cartoon depictingfour typesofvortical structure associated with thetransverse-jetnearfield.(reproductionof Fig. in Fricetal.,1994.) l’l/h 1.8 1.6 1.4 1.2
Convex Simple Hole
M=0.5 M 0.75 M 1.0 M=l.5 M=2.0 0 5 10 15 20 25
FIGURE6 Effect ofblowingratioonthespanwise averaged
heat transfer coefficient.
mainstream boundary layer thickness. This effect
of increasingboundary layerthickness willbecome
more obvious as the blowing ratio increases, and
therebydecreases the
h/ho
atX/D >
8.As
blowingratio is increased to 2.0, the injection flows of
relatively high momentum tend to lift-off the
convex surface after injection. Each injection flow
becomes an inclined cylinder for the mainstream.
Hence,
a horseshoevortex will be formed aroundthe injection flow and also wake vortices will be
induced (Fricetal.,
1994).
The interactions of thehorseshoe vortices among the injection flows are
strong and willincreasethe surfaceheattransferat
regions between holes.
Moreover,
the wakevor-tices will increase the surface heat transfer at
regions downstream of holes. Therefore, the
h/ho
at mostmeasured regionsincrease asblowingratio
is increased to2.0.
At
low blowing ratio, Goldstein and Stonevisualization results. In curved flows, a
cross-stream pressure gradient that holds low
momen-tum fluid particles against the convex surface
exists. The effect on the mainstream boundary
layer is to suppress mixing and entrainment in
the convex surface boundary layer. Therefore,
on the convex surface, injection flow ejected at
low blowing ratio stays close to the surface and
remains in-line with the injection hole.
Figure 7 shows the detailed distributions of local
filmcoolingeffectiveness
(r/)
atM 0.5 toM--2.0.At blowing ratio of 0.5, the injection flows stay
close to the convex surface and block the
main-stream from the surface, thereby increasing the
film cooling effectiveness gradually as shown in
Figure
7(a).
The protection of the injection flowson the convex surface against the hot gas is
decreasing with increased blowing ratio. When
blowing ratio increases to 1.0, the film cooling
effectivenessof regions between holes becomes less
than 0.05 for 3
<X/D<
10. The regions withr/<0.05 extends to
X/D’
14 at blowing ratio of2.0, as demonstrated in Figure
7(d).
Themomen-tum flux ratio demonstrates the cause of the
injection flows leaving theconvexsurfaceathigher
blowing ratio. The large normal component of
Convex
Simple Hole M=0.5Y/Yoo
(a) x
Convex
Simple Hole M=I.0Y/Y
i
(b) X/D 0,6 0.557143 0.514286 0.471429 0.428571 0.385714 0.342857 0.3 0.257143 0,214286 0.128571 0.0857143 0.0428571 0,557143 0.51428 0,471429 0,428571 0,385714 0,342857 0.3 0.257143 0,214286 O, 171429 O, 12857 0,0857143 0,0428571FIGURE 7 Local film cooling effectiveness distributions at
(a)M=0.5;(b)M--1.0;(c)M= 1.5;(d)M=2.0. 4 2
Y/Yoo
-2 (c) 4 2Y/Yoo
-2 0ConvexSimple Hole M=1.5
10 15 20 25
ConvexSimpleHole M=2.0
10 15 20 25 0.471429 0.385714 0.342857 0.257143 0.214286 128571 0o0857143 0.0428571 0.557143 0.471429 0.428571 0.385714
i
0.342857 0.257143 0.214286 0.171429 O. 128571 0.0857143 0.0428571 FIGURE 7 (Continued).momentum of injection flows
(I
sin27)
pulls theinjection flows away from theconvex surfaceand
degrades the film cooling effectiveness on the
surface. Although the increase in mass per unit
area at higher blowing ratio tends to increase r/,
theeffectof decreasing
r/caused
by strongvorticeswillbe more severe.
The results of spanwise averaged film cooling
effectiveness
(/)
at various blowing ratios areshownin Figure 8. Itis shown that decreasesas
blowing ratio increases.
At
blowing ratio of 0.5,the spanwise averaged effectiveness is the best
among all tested blowing ratios.
At
downstreamregions, mixing with the mainstream dilutes the
injectionflows,thereby lower
/obtained.
Also, thelower injection flowmassflux of injectionflow for
M=0.5 causes the steep descent in /at
X/D >
8.In general, higher blowing ratios produce
in-creased massper unit area, largermomentum but
greater jet penetration. Increase of mass can
increase the spanwiseaveraged film cooling
effec-tiveness at downstream regions and provide an
even film coverage along
X/D. As
shown inFigure
7(d),
at blowing ratio of2.0, the increaseof r/ for
X/D >
15 at regions between injectionflows shows that the reattachments of injection
flows have occurred, so increasing the / far
0.5 0.4 0.3 0.2 0.1
00
Convex Simple Hole
M=0.5 M 0.75 M--1.0 M=l.5 I, 10 15 20 25
FIGURE8 Effect ofblowingratioonthespanwise averaged
filmcoolingeffectiveness.
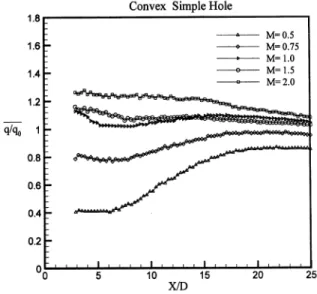
q/qo 1.8 1.6 1.4 1.2 0.4 0.2
Convex Simple Hole
M=0.5
M=0.75
M 1.0 M=l.5
O0
5 10 15 20 25FIGURE9 Effect ofblowing ratio on the overall heat flux ratio.
Forthe filmcooling effectiveness, Schwarzetal.
(1991)
noted that the effect of cross-streampressure gradient greatly overshadow the effects
of the normal and tangentialmomentumof the jet
atlow blowing ratio, therebypushing the injection
flows onto the convex surface. Farther
down-stream, at low blowing ratios, mixing with the
mainstream dilutes the coolant gas and then /
degrades. Berhe and Patankar
(1999b)
mentionedthat thepairs ofcounter-rotatingvortexwould be
stronger athigh blowingratios. Thisphenomenon
causes the decrease in / because the pairs of
counter-rotatingvortexliftthe injection flow away
from the surface and entrain the hot gases from
the surroundings to the surface. For the present
study,apair ofcounterrotatingvorticesobviously
decreases when M
>
1.0.The film coolingperformance oftest surface is
best indicated by the result of spanwise averaged
heat flux ratio shown in Figure 9. The
q/qo
ofvalues lower than 1.0 at low blowing ratio
indicates better film cooling performance.
At
M-0.5 and 0.75, the injection flows reduce the
heat flux ratio effectively over most measured
regions because the low normal momentum of
ejected injection flows tendtoleadthe flows tostay
close to the surface. But the low mass flux of
injection flowsisunable toprovidefilmprotection
atfurtherdownstream, and thereforeincreasesthe
magnitude of
q/qo
atX/D >
9. WhenMis furtherincreased to 1.0, 1.5 and 2.0, both the increased
normal momentum and counter-rotating vortex
pairs will promote lift-off and therefore perform
poor protection just after injection. Furthermore,
at downstream of
X/D-12,
the value ofq/qo
atM=1.0 is larger than the value at M--1.5. This
phenomenon reveals the effect of higher mass
flux on surface protectionat downstream regions.
As
a summary, at high blowing ratio, the highnormal momentum of ejected injection flow
promotes lift-off phenomenon and degrades the
protection on the convex surface. For the tested
convex surface in the present study, the low
blowing ratio of 0.5 shows the best film cooling
performance.
CONCLUSIONS
The present study demonstrates the influence of
blowing ratio on convex surface film cooling
thermography, the film cooling performance ofa
convex surface(2riD
92.5)
with a rowof straightcircular holes
(7=
35 was investigated.Experi-mental results show that high blowing ratio has
adverse effect on film cooling performance.
At
high blowing ratio, the injection flows will lift
away from the surfaceand willalso reducethe film
cooling effectiveness on the convex surface.
How-ever, the largermass of injection flow ejected into
the mainstream at higher blowing ratio causes
adjacent injection flows to merge far downstream
of injection holes and increases the film cooling
effectiveness. In the present study, injection flows
are not able to offer better protection on the
convex surface when M> 1.0. For the tested
convex surface in the present study, the optimum
blowingratio isfoundto be 0.5 among the present
tested blowing ratios.
Acknowledgment
The authors deeply appreciate the financial
sup-port by NSC under the grant number
86-2212-E-002-080. The work in this study could not be
achieved without their support.
NOMENCLATURE I L M P q qo
D injection holediameter ontheinletplane
[m]
h heat transfer coefficient with film injection
[W/mZK]
ho
baselineheat transfercoefficient without filminjection
[W/mZK]
momentumflux ratio
.
2OcUc
/
OmUm
length of injection hole
[m]
blowing ratio DcUc/pmUm
pitch ofinjection holes Ira]
heat flux per unit area
[W/m
]
baseline heat flux perunit area without film
injection
[W/m
2]
r radius ofcurvature ofconvex surface
[m]
Red
mainstream Reynolds number based on theinlet dia-meter ofinjection hole pmumD/ll,
Y
time
[s]
temperature
[K]
mainstreamturbulence intensity
[%]
velocity
[m/s]
axial distance from the center of injection
hole
[m]
spanwise coordinate from the center of
injection hole
Ira]
coordinate axis perpendicular to the test
surface
[m]
Greek Symbols
thermal diffusivity of testsurface
[m2/s]
displacement thickness
[m]
overallfilmcoolingeffectiveness
(Tw- Tm)/
injection hole angle with respect to the test
surface as projected into the
streamwise/
normal plane (inclinationangle) [deg.]
filmcooling effectiveness
spanwise averaged film cooling effectiveness
dynamic viscosity of mainstream [kg/ms]
density [kg/m
3]
Subscripts
c coolant flow ejected from the injection hole
rn mainstream
s testpiece
w surface oftestpiece
initial condition
References
Behle,M.,Schulz,K.,Leiner, W.andFiebig, M.(1996) Color-based Image Processing to Measure Local Temperature
DistributionsbyWide-BandLiquid CrystalThermography, AppliedScientificResearch, 56, 113-143.
Berhe, M. K. andPatankar, S. V. (1999a) Curvature Effects
on Discrete-Hole Film Cooling, ASMEJournal of
Turbo-machinery, 121,781 791.
Berhe, M. K. and Patankar, S. V. (1999b) Investigation
of Discrete-Hole Film Cooling Parameters using Curved-Plate Models, ASME Journal of Turbomachinery, 121,
792-803.
Camci,C.,Kim, K.andHippensteele, S.A. (1992) ANew Hue Capturing Techniquefor the Quantitative Interpretation of
Liquid Crystal Images used in Convective Heat Transfer
Studies,ASME J.ofTurbomachinery, 114,765-775.
Chen, P.H.,Ai,D.andLee,S.H. (1998)Effects ofCompound Angle InjectiononFlat-PlateFilmCoolingThroughaRow
of ConicalHoles, ASMEPaperNo.98-GT-459.
Ekkad, S.V., Zapata,D. andHan,J. C.(1997a) HeatTransfer Coefficients overaFlat Surfacewith AirandCO2Injection through Compound Angle Holesusing a Transient Liquid Crystal Image Method, ASME J. Turbomachinery, 119,
580-586.
Ekkad, S. V., Zapata, D. and Han, J. C. (1997b) Film Effectivenessover aFlat Surfacewith Air andCO2Injection through Compound AngleHolesusing a Transient Liquid Crystal Image Method, ASME J. Turbomachinery, 119,
587-593.
Fric, T. F. and Roshko, A. (1994) Vortical Structure in the wake ofaTransverseJet,J.ofFluidMech., 279, 1-47. Goldstein, R. J. andStone, L. D. (1997) Row-of-Holes Film
Cooling ofCurvedWalls atLow Injection Angles, ASME J. ofTurbomachinery, 119,574-579.
Ito, S., Goldstein, R. J. and Eckert, E. R. G. (1978) Film
Cooling ofaGasTurbineBlade, ASME J.ofEngineeringfor
Power,100,476-481.
Ko, S.-Y., Yao, Y.-Q., Xis, B. and Tsou, F.-K. (1986)
Discrete-Hole Film Cooling Characteristics over Concave and Convex Surfaces, Heat Transfer 1986, Proceeding of 8th InternationalHeat Transfer Conference, San Francisco,
3, Hemisphere PublishingCorp., NewYork, 1297-301.
Lin,Y.-L.and Shih,T. I.-P. (1998)Computationsof
Discrete-Hole FilmCoolingover Flatand Convex Surfaces, ASME
Paper,No.98-GT-436.
Moffat, R. J.(1988)Describingthe Uncertainties in
Experimen-talResults, ExperimentalThermal and Fluid Science,1,3 17.
Schwarz, S. G., Goldstein, R. J. and Eckert, E. R. G. (1991)
The Influence ofCurvatureonFilm Cooling Performance, ASME J.ofTurbomachinery,113,472-478.
Vedula, R. J. and Metzger, D. E. (1991) A Method for the SimultaneousDeterminationofLocal EffectivenessandHeat
Transfer Distributions in Three-Temperature Convection