www.elsevier.com/locate/medengphy
The influence of mean heart rate on measures of heart rate
variability as markers of autonomic function: a model study
Hung-Wen Chiu
a, Ti-Ho Wang
b, Lu-Chou Huang
b, Han-Wen Tso
b, Tsair Kao
b,∗aGraduate Institute of Medical Informatics, Taipei Medical University, Taipei 110, Taiwan, ROC bInstitute of Biomedical Engineering, National Yang-Ming University, Taipei 112, Taiwan, ROC Received 30 January 2002; received in revised form 18 November 2002; accepted 3 January 2003
Abstract
Some studies have demonstrated that the assessments of autonomic activities from the alterations of heart rate variations (HRVs) after autonomic blockade and during exercise of high intensity by the spectral analysis of HRV seemed inconsistent with actual situation. The inconsistency is probably caused by the contributions of fluctuating magnitudes and mean levels of autonomic activi-ties on HRV having not been clarified. The alterations of HRV after autonomic blockade and during exercise of high intensity using a mathematical model were simulated. The autonomic activity in normal condition was assumed first according to some experimental evidence. Then autonomic activities after sympathetic blockade, vagal blockade and during exercise of high intensity were appropriately adjusted accordingly. The HRVs in response to these given autonomic activities were simulated. We found that the effect on HRV influenced by the mean level of autonomic activity is helpful to explain alterations of HRV in these conditions. After vagal blockade, a largely reduced low frequency (LF) power could be caused by the reduced mean heartbeat interval induced by a decreased mean level of vagal activity. Increased low and high frequency powers after sympathetic blockade could be caused by the increased mean heartbeat interval induced by a decreased mean level of sympathetic activity. A decreased LF power during exercise of high intensity, in addition to the withdrawal of vagal activity, could also be caused by the decreased mean heartbeat interval induced by an increased mean level of sympathetic activity.
2003 IPEM. Published by Elsevier Science Ltd. All rights reserved.
Keywords: Heart rate variability; Spectral analysis; Simulation; Autonomic nervous system; Mathematical model
1. Introduction
Power spectral analysis of heart rate variation (HRV) has been widely used for assessing the autonomic ner-vous system (ANS) function [1–3]. Generally, the power spectra of HRV can be divided into low frequency (LF, 0.04–0.15 Hz) and high frequency (HF, 0.15–0.4 Hz) components. The LF power is modulated by both sym-pathetic and vagal controls [4,5], while the HF power mainly reflects the vagal influence [2,5,6]. A physiologi-cal basis for such assessment is that cardiac response to vagal activity is more rapid than to sympathetic activity [7,8]. However, measures of HRV for assessment of ANS after autonomic blockade and during exercise of
∗ Corresponding author. Tel.: +886-2-2826-7018; fax: + 886-2-2821-0847.
E-mail address: tkao@bme.ym.edu.tw (T. Kao).
1350-4533/03/$30.002003 IPEM. Published by Elsevier Science Ltd. All rights reserved. doi:10.1016/S1350-4533(03)00019-5
high intensity have generated inconsistent results. Both LF and HF powers were slightly increased after sym-pathetic blockade [9]. After vagal blockade, the LF power was largely reduced in supine posture [5,9] and also in standing posture [5]. Previous studies have shown that during low and medium exercise intensities heart rate was increased primarily by the withdrawal of vagal activity, the increase in sympathetic tone was minimal. However, with high exercise intensity the increase in heart rate was due to increased sympathetic tone. Although the sympathetic activity was enhanced during exercise of high intensity, the LF power was dramati-cally decreased [10–13]. Some investigators have pointed out that the spectral powers of HRV reflect per-iodic fluctuations in autonomic activity rather than auto-nomic tones [14,15]. On the other hand, the transfer function behavior of atrial rate response to autonomic regulation depended on the mean level of vagal or sym-pathetic tone [16]. Hence, the mean autonomic tone also
476 H.-W. Chiu et al. / Medical Engineering & Physics 25 (2003) 475–481
makes a contribution to HRV. The spectral powers of HRV may simultaneously reflect the contributions of the fluctuating magnitude and the mean level of autonomic activity. Recently, a mathematical model has been developed to examine the relationship between auto-nomic activity and beat-to-beat heartbeat interval vari-ation [17]. The contributions of the fluctuating magni-tude and the mean level of autonomic activity to the spectral powers of HRV were studied. In this study, the influences of the fluctuations and mean tones of auto-nomic activities on alterations of HRV after autoauto-nomic blockade and during high intensity exercise were explored by using the same model.
2. Methods
2.1. Characteristics of autonomic activity
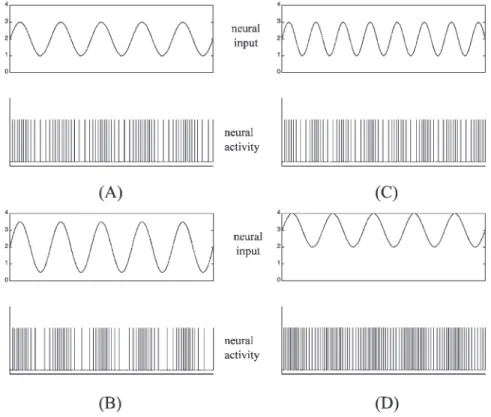
Generally, autonomic nervous activity is a spike-type signal. The firing rate of spikes is called the ‘tone.’ Many studies have used the number of spikes over a time inter-val to represent an instantaneous neural activity for analysis [7,14,18–20] and thus neural activities have the unit of spikes/s. A sinusoidal oscillation form is the widely used expression for a periodic fluctuating signal. Considering the instantaneous neural activity as a sinus-oidal form, the amplitude of oscillation and the DC value can be quantitative representations for the fluctuating magnitude and the mean level of autonomic activity, respectively. Fig. 1 shows some sinusoidal forms of neu-ral signals and the spike-type neuneu-ral activities that they represented. In every part figure, the spike train of neural activity is plotted below the corresponding sinusoidal signal. Comparing with the sinusoidal oscillation in the left top of Fig. 1(A), the signal has larger oscillation amplitude in the left bottom of Fig. 1(B), higher oscil-lation frequency in the right top of Fig. 1(C) and larger mean level in the right bottom of Fig. 1(D).
2.2. Model
The mathematical model, as shown in Fig. 2, is described in detail in Ref. [17] and will be briefly sum-marized. The model consists of a set of equations that describe the kinetics of concentration of neurotransmit-ters proposed by Warner and Cox [21] (Warner model) and an integral pulse frequency modulation (IPFM) model [22] that determines the timings of heartbeats. The inputs of this model are the sympathetic and vagal activities. The concentrations of neurotransmitters, ace-tylcoline (Ach) and norepinephrine (NE), in response to the corresponding vagal and sympathetic inputs, respect-ively, are obtained from the Warner model. By a linear transformation, G(t), the concentrations of Ach and NE are combined to be the modulating input, m(t), of the
IPFM model. A constant, m0, determines the intrinsic
pulse rate of IPFM model. The output of the IPFM model is the heartbeat intervals generated by the input,
m0 + m(t). The model can simulate HRV response to
combined sympathetic and vagal regulations.
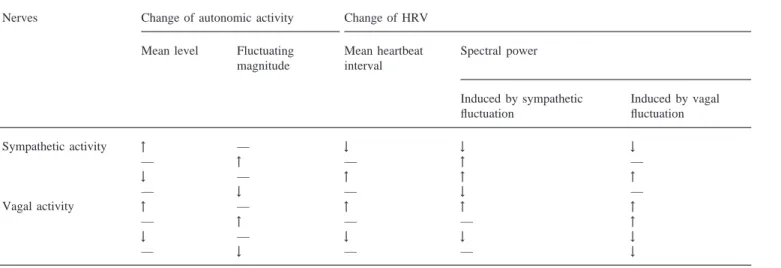
The dynamic characteristics, cardiac response to vagal control being more rapid than to sympathetic control [7,8], were performed by the Warner model. The mean level of autonomic activity determined the mean heart-beat interval. HRV was induced by the fluctuations in autonomic activities. The spectral power of HRV was directly proportional to the fluctuating magnitude of autonomic activities, either sympathetic activity or vagal activity. With regard to the influence of mean level of autonomic activity on HRV [16], the IPFM model dem-onstrated that the fluctuation in heartbeat interval decreased as the mean heartbeat interval decreased under the same fluctuating magnitude of autonomic activity, and vice versa. Thus, an increased mean sympathetic (vagal) tone decreased (increased) the mean heartbeat interval and concurrently decreased (increased) the fluc-tuating magnitude of heartbeat interval. The character-istics of the model are summarized in Table 1.
2.3. Autonomic activities after autonomic blockade and during exercise of high intensity
In order to demonstrate changes of HRVs after auto-nomic blockade and during exercise of high intensity compared with normal condition, the autonomic activi-ties in these conditions and normal condition must be determined. Some findings on autonomic activities in normal condition were considered as the reference for assuming an appropriate autonomic input for simulation. Malliani et al. [6] recorded the preganglionic sympath-etic neural discharge from third left thoracic sympathsympath-etic ramus communicans, and recorded the efferent vagal neural discharge in an artificially ventilated decerebrate cat. They found that both LF and HF fluctuations were present in instantaneous sympathetic and vagal activities. An inverse relationship exists between vagal and sym-pathetic activities modulated by respiration [19,23,24] and baroreflex [20,25].
According to the above characteristics, we assumed that vagal activity in normal condition oscillates at the respiration frequency and at the LF. Sympathetic activity in normal condition was assumed to have a pattern simi-lar to that of vagal activity but out of phase at all times. Therefore, the instantaneous sympathetic activity (s(t)) and the instantaneous vagal activity (v(t)) for the simul-ation of a normal HRV were set as follows:
s(t)⫽ [Aslfsin(2πflft)]⫹ [Ashfsin(2πfhft)]⫹ Ms, (1) v(t)⫽ [Avlfsin(2πflft⫺π)]⫹ [Avhfsin(2πfhft⫺π)] (2)
Fig. 1. Four sinusoidal signals and the neural activities that they represent. In every part figure, a sinusoidal oscillation (top) and the corresponding spike train of the neural activity (bottom) are plotted. Compared with the signal in (A), the signal in (B) has the larger oscillation amplitude, the signal in (C) has higher oscillation frequency and the signal in (D) has larger mean value.
Fig. 2. Block diagram of the mathematical model. The concentrations of NE and Ach in response to sympathetic and vagal activities, respect-ively, are generated by the Warner model. They are linearly combined to form a modulating signal m(t) for the IPFM model. Then the IPFM model generates a heartbeat interval series accordingly.
where flfand fhfare the main frequencies at LF and HF
bands, respectively. Aslf and Avlf are the oscillating
amplitudes of sympathetic and vagal activities at fre-quency flf, respectively. Ashf and Avhf are the oscillating
amplitudes of sympathetic and vagal activities at fre-quency fhf, respectively. Msand Mvare the mean levels
of sympathetic and vagal activities, respectively. For a normal subject at rest with a controlled respir-ation of 15 breath/min, the flfwas chosen as 0.09 Hz and fhfwas 0.25 Hz. The intrinsic heartbeat interval is 600–
750 ms for 20–40 years healthy humans [26,27]. m0was
chosen as 1.4 in the IPFM model to let the intrinsic heartbeat interval be about 700 ms in our model. By trial and error and referring to a previous investigation [6], we assumed that Aslf = 0.3 spikes / s, Ashf =0.2 spikes /
s, Avlf =0.6 spikes / s, Avhf= 0.7 spikes / s keep HRV in
a normal range [3]. Moreover, Ms = 1.5 spikes / s and Mv =1.8 spikes / s were assumed to keep the autonomic
activities positive at all times, and to keep the mean heartbeat interval in a normal range [26,27].
Once autonomic activities in normal condition were determined, the autonomic activities after vagal block-ade, sympathetic blockade and during exercise of high intensity could be determined accordingly. After com-plete vagal blockade, the cardiac response to vagal activity is reduced to zero. We assumed vagal activity to be zero to simulate such a situation. It is reasonable that blockade in one branch of nervous system would not affect the activity of the other branch of the nervous system. Hence, the sympathetic activity after vagal blockade could be the same as that in normal condition. Similarly, we assumed that sympathetic input was zero and vagal input was the same as that in normal condition to mimic the complete sympathetic blockade condition. During high exercise intensity, Ms in Eq. (1) was
assumed to become 7.7 spikes/s in order to simulate an increased mean sympathetic activity [27,28]. The high frequency (fhf) was shifted to 0.35 Hz due to the
increased respiration rate [12,13]. Other parameters were kept unchanged from those in normal condition. Although vagal activity should be withdrawn during exercise of high intensity [28,29], we did not make such an assumption in this study in order to reveal the contri-bution of the increased sympathetic tone to HRV. The
478 H.-W. Chiu et al. / Medical Engineering & Physics 25 (2003) 475–481 Table 1
Summary of the influences of autonomic activities on HRV in our mathematical model
Nerves Change of autonomic activity Change of HRV
Mean level Fluctuating Mean heartbeat Spectral power magnitude interval
Induced by sympathetic Induced by vagal fluctuation fluctuation Sympathetic activity ↑ — ↓ ↓ ↓ — ↑ — ↑ — ↓ — ↑ ↑ ↑ — ↓ — ↓ — Vagal activity ↑ — ↑ ↑ ↑ — ↑ — — ↑ ↓ — ↓ ↓ ↓ — ↓ — — ↓
↑: increased; ↓: decreased; —: remained unchanged.
chosen parameters in different conditions are summar-ized in Table 2.
2.4. Power spectrum of heartbeat intervals
In each simulation, 256 consecutive heartbeat inter-vals were generated by our model. The fast Fourier transform (FFT) method was used to compute their power spectra. Because the generated heartbeat interval series is a function of heartbeat number rather than time, we used averaged heartbeat interval as the sampling interval of this series in order to obtain spectra with the correct frequency [22]. The LF and HF powers were esti-mated by integrating the spectral power in the LF band (0.04–0.15 Hz) and in the HF band (0.15–0.4 Hz) respectively.
3. Results
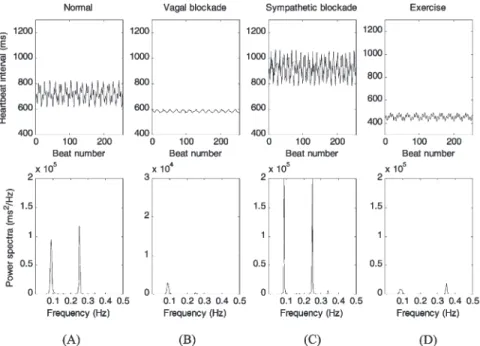
Fig. 3 shows the simulated heartbeat interval tachog-rams and their power spectra in normal condition, after
Table 2
Parameters of autonomic activities in Eqs. (1) and (2) to simulate HRV in normal condition, after vagal blockade, after sympathetic blockade and during exercise of high intensity
Parameters Normal condition Vagal blockade Sympathetic blockade High intensity exercise
flf 0.09 0.09 0.09 0.09 fhf 0.25 0.25 0.25 0.35 Aslf 0.3 0.3 0 0.3 Ashf 0.2 0.2 0 0.2 Avlf 0.6 0 0.6 0.6 Avhf 0.7 0 0.7 0.7 Ms 1.5 1.5 0 7.5 Mv 1.8 0 1.8 1.8
vagal blockade, after sympathetic blockade and during high exercise intensity. Mean heartbeat interval, LF power and HF power, were computed and are listed in Table 3. The power spectrum in normal condition (Fig. 3(A)) illustrates that two significant frequency compo-nents appeared at 0.09 and 0.25 Hz, respectively. The mean heartbeat interval, LF and HF powers were 714 ms, 2243 and 1675 ms2, respectively. This result was
compatible with measurements in humans [3,27]. The simulation result for vagal blockade is shown in Fig. 3(B). It is apparent that the mean heartbeat interval was shorter and both LF and HF powers were largely reduced compared with those in normal condition. In contrast, sympathetic blockade (Fig. 3(C)) showed a marked increase in the mean heartbeat interval and an increase in both LF and HF powers of the HRV spectrum com-pared with normal condition. Fig. 3(D) shows the simu-lated HRV during exercise of high intensity. The location of HF power was shifted to 0.35 Hz due to the HF fluctuations of sympathetic and vagal activity signals that were set to 0.35 Hz to simulate an increased breath-ing rate as shown in Table 2. In addition to the
shorten-Fig. 3. Simulations for normal condition, vagal blockade, sympathetic blockade and exercise of high intensity. Top panels are the tachograms of 256 heartbeat intervals. Bottom panels show the power spectra of these heartbeat interval series obtained by the FFT method. Note the different scale in the y-axis of (B), indicating the decreased power compared with normal. See text for comparisons between different conditions with normal condition.
Table 3
Estimated mean values, LF and HF powers of the heartbeat intervals shown in Fig. 3
Heartbeat intervals
Mean LF power HF power (ms) (ms2) (ms2)
Normal 714 2243 1675
Vagal blockade 585 89 12
Sympathetic blockade 918 2822 2936 High intensity exercise 455 374 357
ing of the mean heartbeat interval, both LF and HF pow-ers also decreased compared with normal condition.
4. Discussion
4.1. Autonomic blockade
Several authors have investigated the effect of auto-nomic blockade on HRV. They revealed that both LF and HF powers were largely reduced after vagal block-ade [1,5,9] and were slightly raised after sympathetic blockade [5,9] comparing with normal condition. Our simulations for vagal blockade and sympathetic block-ade, as shown in Fig. 3(B) and (C), respectively, demon-strated similar results. Moreover, the mean heartbeat interval was reduced to 585 ms after vagal blockade and increased to 918 ms after sympathetic blockade. These
results are similar to the findings of several studies [26,27].
Most investigators have tended to seek physiological explanations for the alterations of HRV after autonomic blockade [5,9]. Pomeranz et al. [5] explained that an 84% reduction of LF power after vagal blockade in supine posture was due to the predominance of vagal control in this posture. However, they did not explain the 72% reduction of LF power after vagal blockade in standing posture in which heart rate control should be dominated by sympathetic control. Moreover, it was sug-gested that the slight increase of LF power after sym-pathetic blockade was likely a result of vagal nerve acti-vation [9].
In this study, we attempted to mathematically explain the alterations of HRV. Our assumptions for the auto-nomic activities were that autoauto-nomic activities contain two parts, the mean level and the fluctuating magnitude. Recalling the characteristics of the model in Table 1, the mean level of autonomic activity determines the mean heartbeat interval. Moreover, HRV is caused by the fluctuation of autonomic activity and its quantity could be influenced by both the fluctuating magnitude and the mean level. After autonomic blockade, the mean level and the fluctuating magnitude of autonomic activities were reduced to zero. With regard to vagal blockade, a decreased vagal fluctuating magnitude caused a decrease of HRV. A decreased mean level of vagal activity caused a decrease of mean heartbeat interval that further decreased the HRV induced by sympathetic modulation. Hence, the LF and HF powers of HRV were largely
480 H.-W. Chiu et al. / Medical Engineering & Physics 25 (2003) 475–481
reduced. Thus, the 72% reduction of LF power in stand-ing posture after vagal blockade [5] could be explained reasonably.
With regard to sympathetic blockade, similarly according to Table 1, a decreased sympathetic fluctuat-ing magnitude caused a decrease of HRV. But a decreased mean level of sympathetic activity increased the mean heartbeat interval that increased the HRV induced by vagal modulation. When the reduction of HRV due to the reduction of fluctuation in sympathetic activity is smaller than the increase of HRV due to the increase of mean heartbeat interval, the LF and HF pow-ers will be raised after sympathetic blockade conse-quently. The results from Jokkel et al. [9] and our simul-ation showed this case. Alternatively, if the effect of the reduced fluctuation in sympathetic activity is greater than that of the reduced mean sympathetic activity, the result will be reversed. Such a possibility cannot be neg-lected in actual experiment. Therefore, the increase of LF and HF powers after sympathetic blockade could not be statistically significant [5].
4.2. High intensity exercise
Although the increase in sympathetic tone was mini-mal during exercise of low to medium intensities, the reduction of both LF and HF powers has been demon-strated in several studies [10–13]. It is suggested that the decreased spectral powers might result from a with-drawal of the vagal activity or some non-neural mech-anisms [10,13]. However, it is difficult to explain the decrease of LF power during exercise of high intensity with increased sympathetic tone. Some investigators have suggested that high-level saturation of sympathetic activity during exercise of high intensity might be a main cause [6,12]. In the present study, we increased the mean level of sympathetic activity to simulate HRV during exercise of high intensity. The result, shown in Fig. 3(D), is similar to those of previous studies, even though we did not assume a withdrawal of vagal activity. The main cause for the reduction of LF and HF powers was the decrease of the mean heartbeat interval (455 ms). This might suggest that if the increase of sympathetic activity during high exercise intensity is mainly contributed by the mean level rather than the fluctuating magnitude, the LF power will be reduced rather than increased. Thus, the decrease of LF power can be explained. However, the proportion of the decrease of spectral powers in this simulation was smaller than that in actual experiments. Hence, the withdrawal of vagal activity still plays another important role in the changes of HRV during exercise of high intensity [10,13,28].
5. Conclusion
In this study, we successfully simulated and inter-preted changes of HRV after autonomic blockade and during exercise of high intensity based on the individual contribution of the fluctuating magnitude and the mean level of autonomic activity. In currently used HRV analysis, the contributions of the fluctuation and mean level of autonomic activity have been mixed and resulted in some controversial assessments of autonomic activity. To obtain a more precise assessment, the spectral power of HRV has been normalized in different ways [3,6,12]. Our results show that the mean heartbeat interval may play an important role on HRV analysis. How to inter-pret the HRV by taking mean heart rate into account could be an important issue.
Acknowledgements
This study was supported by Grants NSC89-2213-E-010-001 and NSC90-2213- E010-007 from the National Science Council, Taiwan, ROC. The authors would like to thank the anonymous reviewers for their helpful com-ments.
References
[1] Akselrod S, Gordon D, Ubel FA, Shannon DC, Barger AC, Cohen RJ. Power spectrum analysis of heart rate fluctuation: a quantitative probe of beat-to-beat cardiovascular control. Science 1981;213:220–2.
[2] Hedman AE, Hartikainen JEK, Tahvanainen KUO, Hakumaki MOK. Power spectral analysis of heart rate and blood pressure variability in anaesthetized dogs. Acta Physiol Scand 1992;146:155–64.
[3] Task Force of the European Society of Cardiology and the North American Society of Pacing and Electrophysiology. Heart rate variability: standards of measurement, physiological interpret-ation, and clinical use. Circulation 1996;93:1043–65.
[4] Pagani M, Lombardi F, Guzzetti S, Rimoldi O, Furlan R, Pizzi-nelli P et al. Power spectral analysis of heart rate and arterial pressure variabilities as a marker of sympatho-vagal interaction in man and conscious dog. Circ Res 1986;59:178–93.
[5] Pomeranz B, Macaulay RJB, Caudill MA, Kutz I, Adam D, Gor-don D et al. Assessment of autonomic function in humans by heart rate spectral analysis. Am J Physiol 1985;248:H151–H3 (Heart Circ Physiol, 17).
[6] Malliani A, Pagani M, Lombardi F, Cerutti S. Cardiovascular neural regulation explored in the frequency domain. Circulation 1991;84:482–91.
[7] Saul JP, Berger RD, Chen MH, Cohen RJ. Transfer function analysis of autonomic regulation: II. Respiratory sinus arrhyth-mia. Am J Physiol 1989;256:H153–H61 (Heart Circ Physiol, 25). [8] Spear JF, Kronhaus KD, Moore EN, Kline RP. The effect of brief vagal stimulation on the isolated rabbit sinus node. Circ Res 1979;44:75–88.
[9] Jokkel G, Bonyhay I, Kollai M. Heart rate variability after com-plete autonomic blockade in man. J Auton Nerv Syst 1995;51:85–9.
[10] Arai Y, Saul JP, Albrecht P, Hartley LH, Lilly LS, Cohen RJ et al. Modulation of cardiac autonomic activity during and immedi-ately after exercise. Am J Physiol 1989;256:H132–H41 (Heart Circ Physiol, 25).
[11] Perini R, Orizio C, Baselli G, Cerutti S, Veicsteinas S. The influ-ence of exercise intensity on the power spectrum of heart rate variability. Eur J Appl Physiol 1990;61:143–8.
[12] Casadei B, Cochrane S, Johnston J, Conway J, Sleight P. Pitfalls in the interpretation of spectral analysis of the heart rate varia-bility during exercise in humans. Acta Physiol Scand 1995;153:125–31.
[13] Yamamoto Y, Hughson RL, Peterson JC. Autonomic control of heart rate during exercise studied by heart rate variability spectral analysis. J Appl Physiol 1991;71:1136–42.
[14] Hedman AE, Hartikainen JEK, Tahvanainen KUO, Hakumaki MOK. The high frequency component of heart rate variability reflects cardiac parasympathetic modulation rather than parasym-pathetic ‘tone’. Acta Physiol Scand 1995;155:267–73.
[15] Malik M, Camm AJ. Components of heart rate variability—what they really mean and what we really measure. Am J Cardiol 1993;72:821–2.
[16] Berger RD, Saul JP, Cohen RJ. Transfer function analysis of autonomic regulation: I. Canine atrial rate response. Am J Physiol 1989;256:H142–H52 (Heart Circ Physiol, 25).
[17] Chiu HW, Kao T. A mathematical model for autonomic control of heart rate variation. IEEE Eng Med Biol 2001;20:69–76. [18] Katona PG, Poitras JW, Barnett GO, Terry BS. Cardiac vagal
efferent activity and heart period in the carotid sinus reflex. Am J Physiol 1970;218:1030–7.
[19] Koizumi K, Terui N, Kollai M. Effect of cardiac vagal and sym-pathetic nerve activity on heart rate in rhythmic fluctuations. J Auton Nerv Syst 1985;12:251–9.
[20] Saul JP, Rea RF, Eckberg DL, Berger RD, Cohen RJ. Heart rate and muscle sympathetic nerve variability during reflex changes of autonomic activity. Am J Physiol 1990;258:H713–H21 (Heart Circ Physiol, 27).
[21] Warner HR, Cox A. A mathematical model of heart rate control by sympathetic and vagus efferent information. J Appl Physiol 1962;17:349–55.
[22] de Boer RW, Karemaker JM, Strackee J. Comparing spectra of a series of point events particularly for heart rate variability data. IEEE Trans Biomed Eng 1984;31:384–7.
[23] Eckberg DL, Nerhed C, Wallin BG. Respiratory modulation of muscle sympathetic and vagal cardiac outflow in man. J Physiol 1985;365:181–96.
[24] Kollai M, Koizumi K. Reciprocal and non-reciprocal action of the vagal and sympathetic nerves innervating the heart. J Auton Nerv Syst 1979;1:33–52.
[25] Preiss G, Polosa C. Patterns of sympathetic neuron activity asso-ciated with Mayer waves. Am J Physiol 1974;226:724–30. [26] Craft N, Schwartz JB. Effects of age on intrinsic heart rate, heart
rate variability and AV conduction in healthy humans. Am J Phy-siol 1995;268:H1441–H52 (Heart Circ PhyPhy-siol, 37).
[27] Kollai M, Jokkel G, Bonyhay I, Tomcsanyi J, Naszlady A. Relation between tonic sympathetic and vagal control of human sinus node function. J Auton Nerv Syst 1994;46:273–80. [28] Brenner IKM, Thomas S, Shephard RJ. Autonomic regulation of
the circulation during exercise and heat exposure. Sports Med 1998;26:85–99.
[29] Robinson BF, Epstein SE, Beiser GD, Braunwald E. Control of heart rate by the autonomic nervous system. Circ Res 1966;19:400–11.