Pergamon
PII: S1359-6454(97)00298-X
ACM mater. Vol. 46, No. 4. pp. 1283-1295, 1998 ‘KS 1998 Acta Metallurgica Inc. Published bv Elsevier Science Ltd P&ted in Great Britain 1359-6454:9X $19.00 + 0.00
INFRARED
JOINING
OF TiAl INTERMETALLICS
USING
Ti-15Cw15Ni
FOIL-I.
THE MICROSTRUCTURE
MORPHOLOGIES
OF JOINT INTERFACES
S. J. LEE’, S. K. WU’ and R. Y. LIN’
‘Institute of Materials Science and Engineering. National Taiwan University, Taipei, Taiwan 106. Republic of China and ‘Department of Materials Science and Engineering, University of Cincinnati,
Cincinnati, OH 45221, U.S.A.
iReceived 4 April 1997; accepted 25 July 1997)
Abstract-Infrared joining of TiAl using Ti&lSCu-ISNi(wt%) foil as brazing filler metal was investigated at the temperature range of 1100°C - 1200°C for 30 - 60 s in a flowing argon environment. All the cross- sectioned microstructures at joint interfaces show distinct multilayered structures which were mainly formed by isothermal solidification and following solid-state interdiffusion during joining. The inward dif- fusion of Al atoms from the TiAl base metal is found to be the main controlling factor pertaining to the microstructural evolution of the joint interface. Seven characteristic zones can be distinguished in the joint. The locus of each specific zone shows a continuously or smoothly varying interval in the diffusion-path diagram and corresponds to one of the stable phases existing at the joining temperature. Experimental results show that the diffusion path of the joint interface at 115O’C are: (a) y-TiAl/?-Ti/cc + P//&Ti/Re- sidual liquid-phase for holding 30 s and (b) y-TiAl,I?-Ti,‘rz-Ti?AliB-TiiRes idual liquid-phase for holding 60 s. The observed joint microstructures are obtained from the phase transformation of these well-estab- lished high-temperature phases through rapid cooling to room temperature.
1. INTRODUCTION
Titanium-aluminides have low densities, high melt- ing temperatures, good elevated-temperature strength and modulus retention, and excellent creep properties [ld]. However, they suffer from low ductility and toughness at ambient temperatures which, along with poor formability, appears to be the single most serious obstacle to their full utilization [ 11. By directly joining titanium-alumi- nide components into an integral structure, some problems in formation could be eliminated effec- tively. Thus, appropriate joining techniques are indispensable for the practical utilization of this ma- terial in elevated-temperature structural appli- cations.
Welding, diffusion-bonding and brazing are three joining techniques which have been commonly
applied in industry. Electron beam welding in TiAl was studied by Patterson et al. [5] who reported that welding cracks cannot easily be avoided. Baeslack et al. have done weldability studies on different titanium aluminide alloys [6,7]. Optimum weld structure and properties can be obtained by properly controlling the weld cooling rates. Concerning diffusion-bonding, Nakao et al. [8] investigated the diffusion bonding of Ti-52Al. Yan and Wallach [9] studied the solid-state diffusion bonding and transient-liquid-phase bonding of Tik 48Al. Very recently, Cam et al. [lo] investigated the solid-state diffusion bonding of TiAl carried out
under different bonding temperatures within the superplastic temperature range of 925 - 1100°C. Although solid-bonds with rather good joint prop- erties can be acquired by diffusion bonding, the long processing time and the high corresponding operation/installation costs may render this joining method useless for practical applications, especially for joining large-sized workpieces.
On the other hand, brazing, as an effective join- ing process, can offer many advantages over other joining processes such as a relatively low joining temperature, the possibility of making many joints at one pass, dissimilar-material joining, complex structure joining, high precision and better joint properties [ 111. For joining titanium-aluminides, conventional furnace brazing with slow heating and cooling rates does not easily provide desirable joint properties due to its long elevated-temperature heat-history. This may be the reason why only a few studies on brazing of titanium-aluminides have been reported [12,13].
During the past few years, a rapid isothermal process (RIP) technique has apparently been devel- oped and widely applied in the electronic industry [14]. Infrared joining, one of the RIPS, can offer a very quick and cost-effective method for joining advanced materials [12]. The infrared join- ings of TiAl have been studied by Lin et al. using Ti-15Cup15Ni[13] and Al-Si[l2] foils as brazing fil- ler-metals. The multilayered microstructures of joint interfaces and the compressive-shear joint strength 1283
1284 LEE et al.: INFRARED JOINING OF TiAl INTERMETALLICS. PART I of about 170-220 MPa were reported, but the
reasons why or how those multilayered structures formed have still not been clarified.
Since joint properties are strongly dependent on microstructures, it is important that the microstruc- tural evolution in the joint interface can be eluci- dated. The aim of this study was to investigate the microstructural evolution of brazed interfaces during infrared joining by using Ti-15Cu15Ni as the filler metal. In Part I of this study, using the Ti-Al-Ni(Cu) pseudo-ternary diffusion-path dia- grams, the high-temperature phases of the charac- teristic zones shown in the observed multilayered structures of joint interfaces can be identified. Their phase transformations during rapid cooling from the infrared joining temperature will also be dis- cussed. In Part II of this study, the time-dependent microstructural evolution at a specific joining tem- perature and the effects of the joining temperature on the microstructural evolution will be discussed in detail. The multiphase diffusion theories [15-171 in binary and ternary solid-state systems are used to discuss the microstructural evolution and its re- lationships to the phase diagrams used in this study. 1400 lw=6Osec 1200 8 1000 E 3 800 2 3 600 3 2 400 200
OI
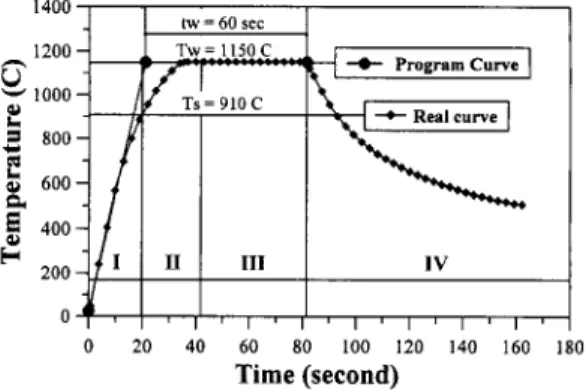
60 80 100 120 140 160 180 Time (second)Fig. 1. The real temperature vs. real time chart of sample #2. The entire joining process can be divided into four main stages: (I)heating, (II)dissolution, (1II)isothermal soli- dification and (1V)cooling stages. T,, T, and t, is the join- ing temperature, the solidus of Ticuni filler-metal and the
programmer setting holding time, respectively.
2. EXPERIMENTAL PROCEDURES
A conventional tungsten vacuum arc melting technique was employed to prepare the Ti5eA1s0 (at.%) alloy. The as-melted button was homogen- ized at 1200°C in a 7 x lo-’ torr vacuum furnace for 50 h and then followed by furnace cooling. The homogenized button was cut into 10 x 8 x 3 mm and 5 x 8 x 3 mm specimens by wire-cutting for sub- sequent infrared joining. These specimens were
Fig. 2. (a) N (d) are the back-scattering electron images (BEIs) of joint interfaces for specimens (a) #l: 1150°C x 3Os, (b) #2: 1150°C x 60s (c) #3: 1100°C x 30s and (d) #4: 1200°C x 30s respectively.
LEE et nl.: INFRARED JOINING OF TiAl INTERMETALLICS. PART I
Ti
Al
CU
Ni
Ti
Al
Ni
1285Ti
Al
Ni
Ti
Al
Ni
Fig. 3. (a) 5 (d) are the secondary electron images (SEIs) with Ti, Al, Cu and Ni LSPs of joint inter- faces for specimens (a) #l: 1150°C x 3Os, (b) #2: 1150°C x 6Os, (c) #3: 1100°C x 30s and (d) #4:1200°C x 3Os, respectively.
polished to a 1200 grit finish and then cleaned ultrasonically in acetone prior to joining.
A TiplSCu-lSNi(wt%) foil with 50 pm thickness (WESGO commercial product, with commercial name Ticuni foil) was used as the brazing filler metal. Ticuni is a clad-laminated brazing filler metal (LBFM) foil[l8], whose solidus and liquidus tem- peratures are 910 and 96O”C, respectively. The spe- cimens, with Ticuni foil, were then carefully assembled into a sandwich type fixed by two graph- ite clamps and placed in the infrared furnace. A slight pressure was applied to keep all the parts in place by graphite screws during heating. Prior to the heating cycle, the infrared chamber was pre- vacuumized and then argon was purged for ap- proximately 60 s. During heating, argon was con- tinuously blown through the heating chamber at 200 ml/min. to minimize oxidation. The processing temperature was monitored with an R type Pt/Ir thermocouple fixed on the specimen’s upper surface by graphite clamps.
The equipment for infrared joining used in this study was ULVAC SINKO-RIKO RHL-P610C type infrared gold image furnace. The maximum operating temperature was 1300°C. Four infrared heating conditions, (l)#l: 1150°C x 30 s, (2)#2: 1150°C x 60 s, (3)#3: 1100°C x 30 s and (4)#4: 1200°C x 30 s, were set and controlled by the EUROTHERM 8 18 type temperature controller. The heating rate of 3000”C/min. was adopted for
all conditions. Figure 1 is the real temperature vs real time profile of sample #2 during the whole joining process which can be divided into four main stages: (I)heating, (II)dissolution, (1II)isothermal solidification and (1V)cooling stages[l9]. In Fig. 1, T,, T, and t, are defined as the joining tempera- ture, the solidus of Ticuni filler-metal and the pro- grammer setting holding-time, respectively. Typically, 12 - 18 s is required for the specimen temperature to be raised to the set T, temperature.
Therefore, the real holding time for samples #l - #4 was 16, 46. 48 and 12 s, respectively. Upon terminating the power, the specimen temperature dropped instantly since the furnace wall was not heated up by the infrared processing. Normally, the specimen cooled to below 500°C in about 90 s. From the T, cooling to the T,, the approximate
cooling rate is about lOOO”C/min estimated from Fig. 1. After joining, samples were cut, mounted and polished, and then etched with Kroll’s reagent, which contained 2 ml HF, 4 ml HN03 and 100 ml H20, for SEM and EPMA examinations. Fractured surfaces of compressive shear-strength test were observed by SEM and EPMA and analyzed by X- ray diffraction (XRD).
Microstructures were observed by Nikon 104 OM and Philips 515 SEM. The JEOL JXA-8600SX EPMA was utilized to take the images, line-scan- ning profile (LSP) and quantitative composition of joined interface. The EPMA was operated at 15 KV
1286 LEE et al.: INFRARED JOINING OF TiAl INTERMETALLICS. PART I
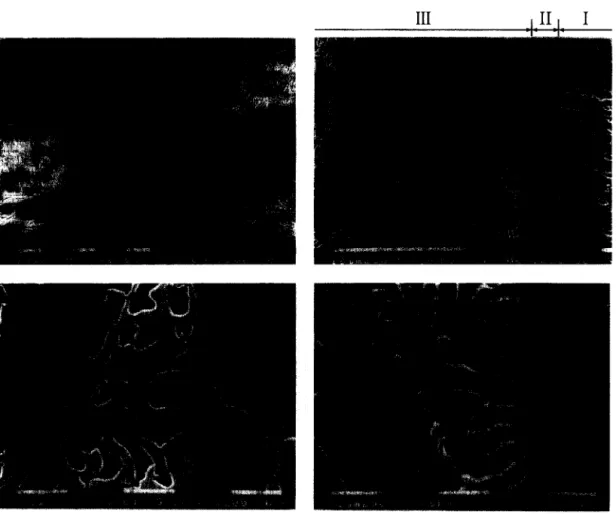
Fig. 4. The detailed SEM cross-section microstructures: (a) the entire joint interface, (b) the near-base metal side (Zones I & II), (c) the near-filler metal side of Zone III and (d) the near-base metal side of
Zone III, of the joint interface of sample #I which was joined at 1150°C x 30 s.
with a probe current 100 nA. XRD analysis with Cu Ka X-ray was conducted by using a Philips 1710 X-ray diffraction equipment carried out at 30 KV and 20 mA. The compressive shear-strength test was conducted at room temperature by Sintech 20/D instrument with the strain rate 0.25 mm/min.
3. EXPERIMENTAL RESULTS
3.1. Multilayered structures of joint zone
Figures 2(aHd) show the back-scattering electron images (BEIs) of joint interfaces for specimens #l N #4, respectively. All the interfaces show differ- ent multilayered structures. These photos demon- strate that both T, and t, greatly affect the microstructural evolution. The brighter areas in Fig. 2 are Cu- and Ni-rich regions and the darker ones are Al-rich regions.
Figures 3(at(d) are the secondary electron images (SE&) with Ti, Al, Cu and Ni EPMA line- scan profiles (LSPs) for samples #l _ #4, respect- ively. Obviously, Cu and Ni atoms are mainly con- centrated in the central region and their concentrations decrease from inside to outside. On the contrary, Al concentration decreases from out-
side to inside. The variation of Ti concentration is rather minute and irregular.
The total thickness of joint interfaces increases from the original 50 pm to about 80 pm after infra- red joining, indicating that some base-metal dis- solved into the liquid filler-metal during joining processes. The thickness of the central zone (re- sidual filler metal) is reduced as T, and t, increase. From Fig. 3, the LSPs curves vary continuously and smoothly in each layer, but there is a sharp and distinct compositional change at the interface between any two adjacent layers. This feature indi- cates that the microstructural evolution of joint interfaces is closely related to the isothermal solidifi- cation and subsequent solid-state interdiffusion between base-metal and liquid filler-metal at the T, temperature.
3.2. Characteristic zones
Figures 4, 6 and 7 are the cross-sectioned micro- structures of joints for samples #l N #4, respect- ively. It is to be noted that small variations in T, and t, can cause significant changes in microstruc- tural morphologies. Combined with the LSP results shown in Fig. 3, the overall cross-sectioned micro-
LEE et al.: INFRARED JOINING OF TiAl INTERMETALLICS. PART I 1287
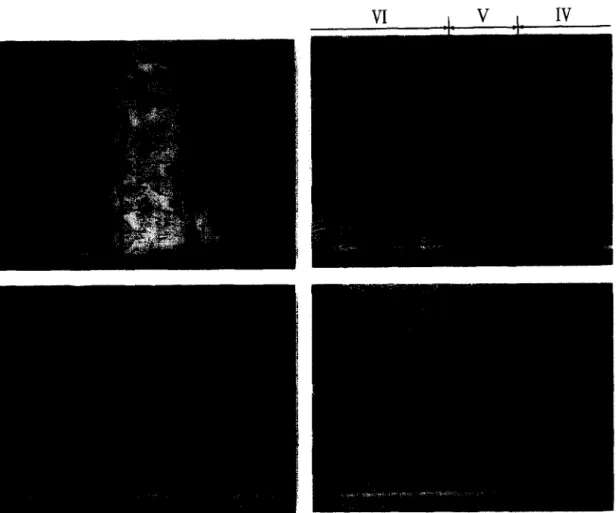
Fig. 5. The detailed SEM cross-section microstructures: (a) the entire joint interface, (b) the x2-layer (Zone V) and its two sides, (c) the netted precipitation zone (Zone VI) and (d) the uniform but discon- tinuous precipitation zone (Zone IV), of the joint interface of sample #2 which was joined at
115O”Cx6Os.
structures of Figs 4-7 can be generalized into seven characteristic zones, as indicated in Fig. 8. They are named and described from outside to inside as fol- lows:
(I) Zone I: The base-metal zone. This zone shows a pure y-TiAl phase. Cracks shown in the photos are believed to be from the stress-induced corrosion cracking by reagent etching [20].
(II) Zone II: The base-metal interface. Its compo- sition is similar to Zone I. Being a slender black layer near the base-metal, this zone is also a ?;-TiAl area and no cracks can be revealed.
(III) Zone III: The columnar two-phase zone. This zone is the characteristic morphology of samples #l and #4, and is composed of the black columnar strips and the white precipitation areas. The black strips show relatively rich Ti and Al con- tent, but the white areas are Cu- and Ni-rich regions.
(IV) Zone IV: The discontinuous precipitation zone. This is one of the characteristic morphologies of samples #2 and #3, located between the CQ layer (Zone V) and the base-metal (Zones I&II). In Zone IV, discontinuous white precipitations are of uni-
form distribution in sample #2, but are non-uni- form in sample #3.
(V) Zone V: a2 layer. This is also one of the characteristic morphologies of samples #2 and #3. It has been proven by EPMA that Zone V is the CQ- Ti3A1 phase with very little Cu and Ni content.
(VI) Zone VI: The netted precipitation zone. With high Cu and Ni content, the white precipi- tations in this zone have developed into an integral netted morphology.
(VII) Zone VII: The residual filler-metal zone. This is the central region of the joint interface with the highest Cu & Ni contents. This zone is a liquid phase before the cooling.
The insert table of Fig. 8 indicates that the above seven characteristic zones are not all coexisting in the same sample because the microstructure evolves as r, and I, vary. As shown qualitatively in Fig. 8, Zone III would change into Zones IV and V as the t, is prolonged or T, is decreased.
1288 LEE et al.: INFRARED JOINING OF TiAl INTERMETALLICS. PART I
Fig. 6. The detailed SEM cross-section microstructures: (a) the entire joint interface, (b) the cc2-layer (Zone V) and its two sides, (c) the netted precipitation zone (Zone VI) and (d) the locally discontinuous
precipitation zone (Zone IV), of the joint interface of sample #3 which was joined at 1100°C x 30 s.
4. DISCUSSIONS
4.1. The dz$iision path and its corresponding high- temperature phases at 1150°C
The multilayered interfacial structures shown in Figs 4-7 are the consequence of atomic interdiffu- sion between base-metal and filler-metal [15-171. The locus of the average composition of planes par- allel to the original interfacial plane throughout the diffusion zone can be plotted on a ternary isotherm of Ti-Al-Ni (Cu is treated as Ni in this study) to establish the diffusion-path diagram [16,17] of the joint. At high joining temperatures, as in this study, the volume diffusion will be the rate-limiting step with local equilibria existing at the interfaces [16]. Thus, the variations of constitutional phases in a joint interface can be displayed by comparing the diffusion-path diagram with the relevant ternary equilibrium phase diagram.
The diffusion path in the joint at T, temperature can be estimated by the joint microstructures observed at room temperature if the cooling rate after joining occurs rapidly enough. This is because rapid cooling minimizes the interfacial concen- tration variation, which could be significant upon slow cooling [17]. In this study, due to rapid cooling
(~lOOO°C/min) from T, to t,, the joint interface does not have enough time to produce new compo- sitional layers during cooling. Therefore, the observed room-temperature microstructures of Figs 4-7 are obtained from the cooling phase trans- formation of the high temperature phases formed
at T,. Under these circumstances, the diffusion path
of the joint interface at T, can be estimated by the room temperature microstructure and composition of each layer.
Figures 9(a) and (b) are the Ti-Al-Ni(Cu) pseudo-ternary diffusion paths for specimens #l and #2 (T..,,= 1 lSOC), respectively. In Fig. 9, it is assumed that Cu atoms behave similarly to Ni ones in the joint since both of them are p-Ti stabilizers and have similar atomic sizes and structures. In ad- dition, Cu and Ni form an isomorphologic solid solution and show the complementary phenomena of their LSPs curves in Fig. 3. The Ni(Cu) values in Fig. 9 are obtained by adding the Ni and Cu con- tents together. By this Ti-Al-Ni(Cu) pseudo-tern- ary analysis, the diffusion paths of joint interfaces can be plotted, and the results can be further com- pared to the reported Ti-Al-Ni ternary phase diagram [21].
LEE et al.: INFRARED JOINING OF TiAl INTERMETALLICS. PART I 1289
Fig. 7. The detailed SEM cross-section microstructures: (a) the entire joint interface, (b) the near-base metal side (Zone I and II). (c) the near-filler metal side of Zone III and (d) the near-base metal side of
Zone III, of the joint interface of sample #4 which was joined at 1200°C x 30 s.
In Fig. 9, A and B are locus of the original base- metal and filler-metal compositions, respectively. I - VII express the composition regions of the seven characteristic interfacial zones described in Fig. 8. The composition locus of each zone is found to focus and vary smoothly in its own domain, but for each adjoining domain, the compositional diffu- sion path shows a large gap. According to the prin- ciple of multiphase diffusion in binary [ 151 or ternary [lb. 171 solid-state systems, it is reasonable to suggest that each domain corresponds to one of the stable phases formed at the joining temperature T,.
As mentioned above, the residual filler-metal zone (Zone VII) is the only liquid phase remaining in the joint before cooling. This feature can be easily proven by comparing the results of Fig. 9 with that of 115OC TipAllNi isothermal phase dia- gram of Lee and Nash [21]. This comparison also implies that, at r,, = 115O’C, Zones I&II are both a y-TiAl. Zone III is a two-phase mixed region, Zone IV is an x-Ti phase, Zone V is an a?-TisAl phase and Zone VI is a J-Ti phase.
It must be pointed out that the compositions of domains I, II, VI and VII are very close to the marked phases shown in the Lee and Nash
diagram [21]. Thus, the phases of these zones at 1150°C can be directly identified by compositions they proposed. But concerning the other domains (III, IV and V), Fig. 9 shows that they deviate dra- matically from those of the Lee and Nash diagram due to the absence of the a-Ti region in that dia- gram. Because the Lee and Nash diagram was eval- uated from Liang’s TiPAl binary diagram [22], it was noted by the authors that there were consider- able uncertainties in the referred to TiPAl diagram. According to the more recent published TiPAl binary diagram [2,23], as shown in Fig. 10. there are indeed two xc-Ti regions separated by an ordered ~(1 phase at the 1150°C isotherm. Thus, the Lee and Nash diagram can not be directly used in the analy- sis of Zones III - V before it is appropriately modi- fied. Drawings in Figs 9(a) and (b) were proposed following corrected phases suggested in Fig. 10.
From Fig. 9, it is clear that the atomic interdiffu- sion at r, = 115O’C occurred through several inter- mediate phases. The diffusion paths are y-TiAIQx-Til z + P//GTi/residual liquid for sample #l and ;‘- TiAl/x-Ti/a2-TisAl/B_Ti/residual liquid for sample #2. According to the multiphase diffusion theories, the diffusion path of an infinite couple on the tern- ary isotherm is defined uniquely only by its terminal
Zone
III
(higher
joining
temp.)
;“““---“”
I I :Zone
VII(filler
metal)
Zone
IV
I
Remark: 0: with and X: without that specific characteristic zone. IZone
I
(base
metal)
Fig. 8. The characteristic microstructures of seven zones of the overall cross-sectioned joint interfaces of the four joining conditions. The names and its characteristics for each zone are discussed in the text.LEE et al.: INFRARED JOINING OF TiAl INTERMETALLICS. PART I 1291
composition [17]. Thus, under thermodynamic con- sideration, the diffusion paths of infinite couples formed at the same T, at all times should be time- invariant and behave as stationary lines. However, some kinetic factors may change the interfacial dif- fusion paths and produce different results, such as the finite couple [ 161, the moving terminus [17] and the delayed nucleation of some species [17]. etc. These factors may cause the joint interfaces under different holding times to show non-consistent diffu- sion paths, as will be discussed below and in Part II of this study. For example, from Fig. 9, it is clear that the composition of residual liquid filler metal (one of the couple termini) changes with holding time from the original Ti75(Ni,Cu)25 (in at.%) to Ti60Allt,(Ni.Cu)30 at t,=30 s and then to Ti45A125(Ni,Cu)30 at t, = 60 s. This continuous com- position change of one terminus, called the moving terminus, is produced due to the finite couple effect of the filler metal and will change the driving forces of atomic interdiffusion and phase nucleation at T,. Thus, the acquired diffusion paths and microstruc- tures of samples joined at the same T, change for different t,.
Furthermore, as the holding time increases, the overall diffusion path obviously shifted to the Al- rich side while the Ni(Cu) content of the residual liquid phase increases from the original 25at.% to about 30at.%. According to the general qualitative trend proposed by Van Loo [16], these character- istics strongly point out that the inward diffusion of Al atom is the main control factor pertaining to the microstructural evolution of joint interfaces. One of the main purposes of Cu and Ni addition in the fil- ler metal is to lower the melting point of the filler- metal [24]. However, these added Cu and Ni atoms change the interdiffusion system from a binary to a quaternary system, and therefore, cause more com- plex microstructures to evolve at the joining inter- face, as those shown in Figs 47.
By the same analytic procedures, the diffusion- path diagrams of samples #3 and #4 can be acquired. They are y-TiAl/ccz + X/cr2-TisAl//?-Ti/re- sidual liquid for sample #3 joined at 1100°C and y- TiAl/x-Ti/r + PI/?-Tilresidual liquid for sample #4 joined at 1200°C. Here, the X may be the i-phase estimated by the detected composition locus of the corresponding area and reported on the 900°C Ti- Al-Ni isotherm [21]. The detailed time-dependent interfacial microstructural evolution at T, and the effects of the joining temperature on the microstruc- tural evolution at the joining interfaces will be further discussed in the part II of this study. 4.2. The phase-transfbrmation during cooling jiorn T,, = 1150°C
Upon terminating the power, the well-established high-temperature phases described in Section 4.1 will phase-transform to the room-temperature phases. Based on information presented in Figs 8
and 9, the correlation between the seven character- istic zones and their respective high-temperature phases can be obtained, as shown in Table 1. Because the acquired diffusion paths do not pass through any Ni(Cu)-base solid phase on the 1150°C Ti-Al-Ni(Cu) ternary isotherm, as will be discussed in Section 4.3. we suggest that all the white precipi- tates in the joint interfaces are merely formed by the cooling phase transformation. The proposed phase-transformation of each zone during the fast cooling are discussed as follows.
4.3. (1~ Zones I & II: The base-metal zone and base-metal interface zone
After cooling, Zone I is a single Y-TisoAlSa phase. From Fig. 10, the 11OO”C/12OO”C isotherm crosses the transus of y-TiAl in Ti-rich side and this cross- over is close to the composition of Ti52A148. Thus, the composition of Zone II is suggested as Tis2A14a, as shown in Fig. 9(a) and (b). No cracks can be seen on Zone II because the stress relief may occur in this layer at T,, as shown in Figs 4(b) and 7(b).
4.4. (21 Zone III: Columnar two-phase zone Zone III, a typical two-phase mixed region shown in sample #l, is the cooling structure of the high-temperature columnar CI + B two-phased zone. During rapid cooling, the columnar a-Ti directly transforms to the x2-phase with no precipitation due to the similar composition of x-Ti and M~ phases. At the same time, during cooling, the /j’- phase (the white precipitation area at T,,,,) also transforms to an a2 phase with a considerable num- ber of Ni(Cu)-rich precipitates due to its high Ni(Cu) content.
These white precipitations have been identified to be Tic+ and Ti(Ni,Cu) intermetallics by XRD analysis on the fractured surface of the compressive tested specimen, as will be discussed in Section 4.3. As shown in Figs 4(c) and 7(c), Zone 111 nearby the filler-metal side has a netted precipitation mor- phology due to this area containing higher Ni and Cu atoms and causing more precipitations after cooling. On the contrary, Zone III nearby the base metal side shows a discontinuous precipitation mor- phology due to its lower Ni and Cu contents. as shown in Figs 4(d) and 7(d).
4.5. 13) Zones IV and V: The discontinuous precipi- tation zone and x2 layer
Zones IV and V simultaneously appear in the joint interface of sample #2 when Zone III vanishes due to the longer t,, as shown in Figs 4 and 5. They are individually transformed from the c(*- TisAl and the high Al% x-phase at Tw. Here, the high Al% x-phase is the a-phase located in between az-TisAl and I’-TiAl phases at T, (1150°C) iso- therm, as shown in Fig. 10. Because c(~ is a stable phase at both T, and T,,,,, it forms Zone V with- out any composition change during cooling. At the
Al(at%) Al(at%) Ti 10 20 B 30 40 50 60 Ni(Cu) (at%) Ti 10 20 B 30 40 50 60 Ni(Cuz (at%) E fi -Ti L+fl-Ti L (liquid) BI +L Bl 81 +L fi -Ti L-l- p -Ti L (liquid) Pl +L Bl k I- I- I- I- I- I- I- I- I‘ I‘ Pl +L 3 c (a) #l : 1150°C X 30sec. (b) #2: 1150°C X 60sec. z @ 2? A 1 Original base metal I I III Columnar two-phased zone I I I 1 VI Netted ppt. zone I Base metal zone II Base metal interface IV Discontinuous ppt. zone VII Residual filler metal V Continuous az-layer B Original filler metal Fig. 9. The TikAl-Ni(Cu) pseudo-ternary diffusion path diagrams of joint interfaces, (a) for sample #l joined at 1150°C x 30 s and (b) for sample #2 joined at 1150°C x 60 s, respectively. A, I N VII and B indicate the compositional loci of corresponding zone as shown in the table.
LEE et nl.: INFRARED JOINING OF TiAl INTERMETALLICS. PART I 1293
at.% Al Ti-Al Phase Diagram
Fig. 10. The partial Ti-AI binary high temperature phase diagram [2,23]. There are two types of /%Ti + cc-Ti phase transformation produced by (I) cooling and (2) isothermal interdiffusion, respectively. A T is the x2-phase supercool-
ing of the specific joining temperature.
same time, the high Al% a-phase transforms to Zone IV. Jones et al. [25] reported that a Ti-Al alloy with Al 2 45 at.% can form a full ccz-phase structure under a rapid cooling rate. In this study, we suggest that the disordered high Al% cc-phase can transform to x2 because its Al content is below 45%, as shown in Fig. 10. Besides, the high Al% c(- phase can dissolve more Ni(Cu) atoms than its transformed ordered cc2-phase. Therefore, during the high Al% x transforms to ~2 phase in Zone IV, the excess dissolved Ni(Cu) atoms should be expelled from the fully ordered z2 matrix and Ni(Cu)-rich precipitations will uniformly disperse in Zone IV. as shown in Fig. 5 of sample #2.
The microstructural evolution of Zone IV of sample #3 will be further discussed in the Part II. Because its joining temperature is at 1100°C. instead of 115O”C, the evolved phases and mor-
+ : %,A1 ??: Ti Cw ??:TiNi 0 ) , / , , , , , ( , , , , I I / I I I I I I 30 25 30 35 40 4s 50 5s 60 65 70 75 80 Diffraction angle 12131
Fig. 11. The X-ray diffraction spectra for the fractured surface of the specimen joined at 1150°C x 60 s as sample #2. The X-ray diffraction pattern was interpreted accord-
ing to the JCPDS cards [27].
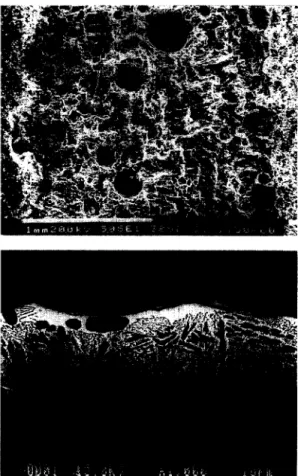
Fig. 12. (a) _ (b) are the images of the fractured surface of Fig. 11 and the cross section of the same specimen. re-
spectively.
phologies are different from those of Zone IV of sample #2.
4.6. (4) Zone VI: The netted precipitation zone Zone VI corresponds to the region of the high- temperature P-Ti phase for both samples #l and #2. Its room-temperature microstructure shows a unique morphology with a fully precipitated net- work due to its high Ni(Cu) content. This resulted from a ternary eutectoid reaction during cooling [26]. In our case, this reaction is identified to be b-Ti + ~(2 +TiCu,+Ti(Ni,Cu) by the XRD analyses on the fractured surfaces of the specimen joined with the same condition as sample #2, as will be discussed in Section 4.3.
4.7. (51 Zone VII: The residual~filler-metal zone Zone VII is the region of the residual liquid filler metal at a high temperature. With low Al content. this region is the only area that still keeps the liquid state before cooling, and then solidifies as an eutec- tic morphology during the cooling. Due to the seg- regation during the isothermal solidification, this region contains higher Ni(Cu) content than the original filler metal.
1294 LEE et al.: INFRARED JOINING OF TiAl INTERMETALLICS. PART I
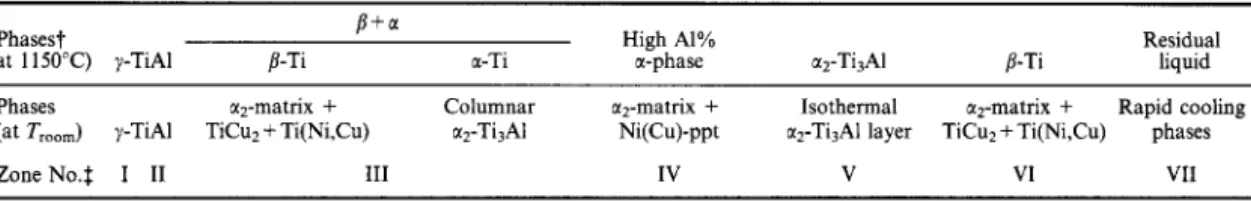
Table 1. The phases and phase transformations of seven characteristic zones during fast cooling from T, = 1150°C Phases?
at 1150°C) y-TiAl /LTi P+,
a-Ti
High Al%
a-phase m2-Ti3Al P-Ti
Residual liquid Phases scz-matrix + Columnar c+matrix + Isothermal a2-matrix + Rapid cooling (at T,,,,) y-TiAl TiCua + Ti(Ni,Cu) c(2-Ti3A1 Ni(Cu)-ppt cr2-Ti3Al layer TiCuz + Ti(Ni,Cu) phases
Zone No.$ I II III IV V VI VII
Remark: tThese high-temperature phases are obtained from the diffusion diagrams of Fig. 9. $These zones are consistent with the observed room-temperature microstructures of Fig. 8.
4.8. The fractured surface of the joined interface
Compressive shear strength tests were carried out on specimens with the same joining conditions as samples #l N #4. For specimens failing at the join- ing region, fractured surfaces were analyzed by XRD in order to identify the phases formed in the joint interface. Figure 11 shows the XRD spectra for the fractured surface of the specimen joined at 1150°C x 60 s (as sample #2). The TisAl, TiCuz and Ti(Ni,Cu) are the major phases near the fractured surface, in which TiCuz and Ti(Ni,Cu) peaks have higher peak intensity than T&Al one.
Figure 12(a) and (b) shows the images of the fractured surface and cross section of Fig. 11 speci- men, respectively. From Fig. 12(b), the fracture has mainly taken place along Zone VII of joint inter- face. An EPMA test indicates that the spheres exist- ing in Fig. 12(a) are TisAl(a2) phase. Combining the results of Figs 11 and 12, TiCu2 and Ti(Ni,Cu) are the two major phases of those white precipi- tations existing in Zones III and VI. These obser- vations agree well with the microstructural evolutions discussed in the previous sections.
5. CONCLUSIONS
Infrared joining of TiAl using Ti-15Cu- lSNi(wt%) foil as brazing filler metal was investi- gated at the temperature range of 1100°C N 1200°C for 30 N 60 s in a flowing argon environment. All the cross-sectioned microstructures at joint inter- faces show distinct multilayered structures which were mainly formed by isothermal solidification and thereafter isothermal solid-state atomic interdiffu- sion. The diffusion of Al atoms from the TiAl base- metal into the joint zones at the joining temperature is the main controlling factor pertaining to the microstructural evolution of the joint interface. Seven characteristic zones can be distinguished in the joint. The corresponding high-temperature phases of these seven zones are y-TiAl (I + II), c( + /I two-phase mixed (III), high Al% a-phase (IV), cr2-TisAl(V), /3-N (VI) and the residual liquid filler metal (VII), respectively. The locus of each specific zone shows a continuously or smoothly varying interval in the diffusion-path diagram and corresponds to one of the stable phases existing at the joining temperature. Experimental results show
that the diffusion path of the joint interface at 1150°C for different holding times is: (a) held 30 s : y-TiAl/cc-Ti/cc + /?//I-Tilresidual liquid-phase and (b) held 60 s : y-TiAl/high Al% cc-phase/a*-T&Al//?-Ti/ residual liquid-phase. On the Ti-Al-Ni(Cu) pseudo- ternary diffusion-path isotherm, the cc-Ti, a*-TisAl and high Al% c( phases are three distinguishable phases with their own compositional domains. The ordered a2-TisAl phase is surrounded by the entire a-base phase, just as it behaves in the binary Ti-Al phase diagram. The observed joint microstructures are obtained from the phase transformation of these well-established high-temperature phases through rapid cooling to room temperature.
Acknowledgemenrs-The authors sincerely acknowledge the financial support of this research by the National Science Council (NSC), Republic of China, by the Grant NSC82-0405-E002-402.
REFERENCES 1. Kim, Y-W., JOM, 1989,41,24.
2. Kim, Y-W. and Dimiduk, D. M., JOM, 1991,43,40. 3. Yamaguchi, M. and Inui, H., in Proc. Structural
Intermetallics, ed. R. Darolia, J. J. Lewandowski, C. T. Liu, P. L. Martin, D. B. Martin and M. V. Nathal. TMS, Warrendale, PA, 1993, p. 127.
4. Kim, Y-W., JOM, 1994, 46, 30.
5. Patterson, R. A., Martin, P. L., Damkroger, B. K. and Christodoulou, L., Welding J., 1990, 69, 39s. 6. Baeslack III. W. A.. Mascorella, T. J. and Kelly, T. J.,
Welding J., i989, 68, 483s.
7. Mallory, L. C., Baeslack III, W. A. and Phillips, D., J. Muter. Sci. Lett., 1994, 13, 1061.
8. Nakao. Y.. Shinozaki. K. and Hamada, M., ZSIJ
9. 10. 11. 12. 13. 14. 15. 16. 17. Internation& 1991, 31, ‘1260.
Yan, P. and Wallach, E. R., Intermetallics, 1993,1, 83. Cam, G., Bohm, K-H., Mullauer, J. and Kocak, M., JOM, 1996, 48, 68.
Schwartz, M., in Brazing, 1st edn. Chapman & Hall, London, 1995, p. 1.
Annaji, S., Lin, R. Y. and Wu, S. K., in Proc. Design Fundamentals High Temperature Composites, Intermetallics, and Metal-Ceramics Systems, ed. R. Y. Lin. Y. A. Chana. R. G. Reddy and C. T. Liu. TMS, Warrendale, PA,-1995, p. 125. .
Blue, C. A., Blue, R. A. and Lin, R. Y., Scripta metall. mater., 1988, 32, 127.
Singh, R., J. appl. Phys., 1988, 63, R59.
Reed-Hill, R. E., in Physical Metallurgy Principles, 2nd edn. Van Nostrand, New York, 1973, p. 559. van Loo, F. J. J., Prog. Solid St. Chem., 1990, 20, 47. Kirkaldy, J. S., in Diffusion in the Condensed State. London: Institute of Metals, 1987, p. 361.
LEE et a/.: INFRARED JOINING OF TiAl INTERMETALLICS. PART I 1295 18. Hoffman, K. F., Bird, R. K. and Dicus, D. L., 24. Rabinkin, A., Liebermann, H., Pounds, S. and Taylor.
Welding J., 1995, 74, 378s.
19. Zhou, Y., Gale, W. F. and North, T. H., Int. Mat.
T., Scripta metall. mater., 1991, 25, 399.
Rev., 1995, 40, 181. 25. Jones, S. A. and Kaufman, M. J., Acta metall. metal., 20. Baeslack III, W. A., Mcquay, P. A., Lee, D. S. and 1993, 41, 387.
Fletcher, E. D., Mater. Char., 1993, 31, 197. 26. Den, L. C., Kao, P. W., Hsieh, K. C., Chang, S. F. 21. Lee, K. J. and Nash, P.. J. of Phase Equilibria, 1991, 12,
551. and Lee, J. S., Prakt. Metallogr., 1993, 30. 567.
22. Liang, W. W., Calphad, 1983, 7, 13. 27. Cards, J. C. P. D. S., in Joint Committee on Powder 23. McCullough, C., Valencia, J. J., Levi, C. G. and Dlfiaction Standards. International Centre for