Computer-Aided Project Duration Forecasting
Subjected to the Impact of Rain
S.-J. Guo
Department of Civil Engineering, National Taiwan University, Taipei 10617, Taiwan
Abstract: Rain is a significant climate factor for project duration control. This study presents an analytical model for project duration forecasting subjected to the impact of rain. Also developed herein is the concept of “level of rain” to analyze the direct and subsequent productivity losess based on various amounts of precipitation. Based on the analytical model, a computer-aided project duration forecasting system subjected to the impact of rain is developed. The proposed system incorporates historical precipitation records, expert experiences, and fuzzy-set techniques in duration forecast-ing. Moreover, the proposed system’s effectiveness is demon-strated by a highway construction project. The system pro-posed herein can provide more realistic duration forecasting for project managers while considering the impact of rain.
1 INTRODUCTION
Conventional scheduling software such as P3, OPENPLAN, and Microsoft Project has been used extensively in schedule planning for various construction projects. However, these software programs do not consider the impact of rain in the scheduling process. If the scheduler does not build in effects of rain in activity duration, then two identical projects with the same network logic and activities would yield the same total project duration even though the weather conditions in the two construction sites are totally different. In other words, these software systems do not account for rain explicitly but depend on the user to deal with this issue implicitly in the activity duration. Moreover, the start date of the construction also should affect the final completion date of the project due to the distribution of rains in a year. For instance, rain can significantly affect the exterior wall finishing in building construction. This activity, if scheduled in the dry season, can be completed in 1 month. However, if the project’s starting date is shifted for one season, then the exterior wall finishing can be shifted to the raining season. In this case, it may take at least 2 months to complete the exterior wall finishing. On
the other hand, the location of the construction site certainly would yield different raining seasons, resulting in different project completion dates.
In practice, an experienced scheduler should consider and estimate how rain might affect the schedule and total dura-tion. However, consider a situation in which the scheduler is unfamiliar with the distribution of rain at the construction site. Inappropriate estimating of rain’s impact could cause the project schedule to significantly differ from the actual dura-tion. An increasing number of construction projects are esti-mated on a calendar-day basis, in which the completion date already may be specified in the contract. The contractor must prepare a feasible schedule plan to avert an enormous penalty in scheduling delays. This situation becomes more serious if the contractor does not have much relevant working experi-ence with the distribution of rain in a particular city or area. An effective means of averting this problem involves incor-porating the historical data of rain in the duration forecasting process. With the historical data of rain, the scheduler can adjust each activity’s duration in the network to yield a more feasible completion date. The scheduler can assign an appro-priate duration for each activity based on a no-rain condition; meanwhile, the schedule impact of rain is adjusted by the his-torical data of rain. By employing this approach, the scheduler can more accurately predict the project completion date even though the scheduler does not have much relevant experience with the distribution of rain of the construction site.
2 LITERATURE REVIEWS
The impact of rain on project scheduling has received limited attention. In practice, the scheduling uncertainties are usually estimated by experience and judgment. However, the impact of rain and precipitation is not distinguished from other uncer-tain factors. A lot of investigators such as Crandall,6Moder et al.,7 Ahuja and Nandakumar,2 and Touran and Wiser11 used Monte Carlo simulation techniques for handling sched-© 2000 Computer-Aided Civil and Infrastructure Engineering. Published by Blackwell Publishers, 350 Main Street, Malden, MA 02148, USA,
ule uncertainties as well as impact of rain. Benjamin and Greenwald4and Carr5started to consider the effects of weather on construction and proposed the concept of weather sensi-tivity correction and DECAD (uncertainty dependent of cal-endar date). Padilla and Carr9developed weather correction factors for resource strategies of project management. In a related work, a fuzzy-set concept was developed by Ayyub Haldar3to cope with project scheduling and forecasting un-certainties. In addition, Smith and Hancher10 developed a fuzzy-set model to evaluate the schedule impact of precipi-tation. That investigation also applied the fuzzy concept of Ayyub and Monte Carlo simulation technique to predict the future weather pattern and the amount of rain.
Smith’s study, although presenting an effective means of estimating the schedule impact of precipitation, has certain limitations. Concerns arise over whether the weather condi-tions are divided as only rainy and sunny days; that study also does not consider subsequent impact of rain, as well as the appropriateness of using Monte Carlo simulation for predict-ing weather uncertainties. Adeli and Karim1developed a job-condition modifier to model productivity loss during and after rainfall. Moselhi et al.8developed a decision support system, named WEATHER, for estimating the combined effect of reduced labor productivity and work stoppage caused by ad-verse weather conditions on construction sites. The weather data in Canada were build into this system to facilitate the planning and scheduling process. Although Moselhi et al. adapted the historical data of rain to develop their system, the subsequent impact of rain is still neglected in this recent study. To address these concerns, three aspects must be discussed:
1. The amount of rain differs according to the location and date/season. In Monte Carlo simulation, assuming a certain distribution and frequency of rain is inappro-priate. Instead, applying historical data of rain toward simulation would be more effective.
2. Different amounts of rain should result in different lev-els of impact for a schedule delay. Various levlev-els of rain must be defined to evaluate the productivity loss of different activities and the total duration impact. There-fore, a fuzzy-set approach can be developed to convert the amount of rain into different amounts of productiv-ity loss.
3. The subsequent impact of rain cannot be neglected. A heavy one-day rain not only delays the work for that par-ticular day but also may cause several days of produc-tivity loss. Under some circumstances, the subsequent work stoppage may be more serious than the direct im-pact. However, previous literature did not emphasize this issue.
Table 1
Level of rain and description
Level of rain Precipitation Description
Drizzling < 1 mm/day Drizzle, umbrella may be unnecessary
Slight 1–10 mm/day Ordinary rain; umbrella is necessary
Medium 10–25 mm/day Rainfall accumulates on the ground
Heavy > 25 mm/day Pour, cloudburst, storm
3 HISTORICAL DATA ON RAIN
Historical data for rain distribution and patterns are a pre-requisite for developing the schedule forecasting model sub-jected to the impact of rain and constructing a computer-aided scheduling system. These data can be obtained from the Weather Bureau. In Taiwan, the Weather Bureau has made observations and maintained records for rain, temperature, and wind for each county since 1949. Updated records for the rain distribution and patterns in Taiwan have been pub-lished, containing the historical daily data for rain for the past three decades. This source document provides prelimi-nary information for this study.
Although Taiwan is not large, each county significantly varies in terms of rain distribution. For instance, north Taiwan experiences about 100 to 180 days of rain annually. However, south Taiwan, has only around 70 to 90 days of rain annually. A rainy day is defined as more than 1 mm/day of accumulated rain. The Weather Bureau defines five levels of rain according to the amount of accumulated rain, i.e., 1, 10, 25, 50, and 100 mm and up per day. The latter two typically incur property damage or fatalities.
Generally, 1 mm/day of rain is referred to as drizzling, pos-sibly interfering with some outdoor activities; 10 mm/day of rain is referred to as only a slight amount of rain, possibly in-terfering with most outdoor activities (also, the rainfall may begin accumulating on the ground before it has been dis-tributed); 25 mm/day of rain is referred to as medium rain, and subsequently, most outdoor activities will cease; and 50 and 100 mm/day of rain usually comes along with a storm and occurs in mountainous areas. This study refines these defini-tions for evaluating different impacts of productivity losses as in Table 1.
4 ANALYTICAL MODEL 4.1 Definitions of variables
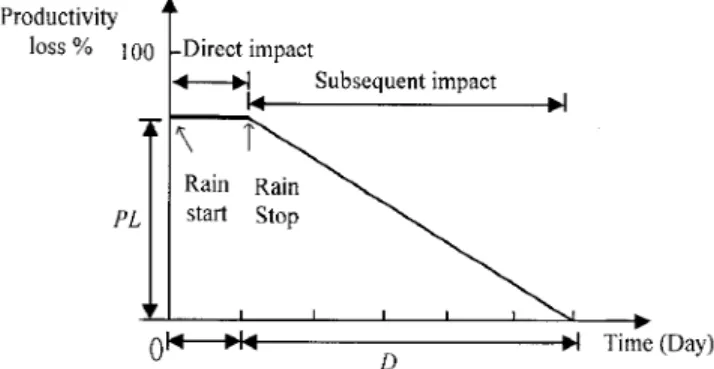
Figure 1 defines two major variables to overcome the previous problems:
Table 2
Example of questionnaire result for P L and D
Drizzling Slight Medium Heavy Level of rain P L D P L D P L D P L D
Earth backfill 0% 0 20% 1 80% 2 100% 6
1. Productivity loss (PL): The productivity loss attributed to the impact of rain. In contrast to the no-rain situa-tion, the productivity loss is 0%. A productivity loss of 50% creates a scenario in which only half the work is completed.
2. Days of subsequent impact (D): The duration that the productivity is affected, as attributed to the impact of rain. It is counted from the stop of rainfall until the productivity loss is decreased to 0% (no-rain situation). 4.2 Productivity impact of a single rainfall
A questionnaire survey was conducted to collect the produc-tivity losses and days of consequential impacts for various activities subjected to different levels of rain. A typical result is shown in Table 2. The questionnaire was administered to 24 experienced site engineers and supervisors of 12 highway construction projects. The questionnaire results were then reviewed by an expert meeting that consisted of four senior highway construction site supervisors. The expert reviews provide the final result of the survey by combining the vari-ations between individual responses. In reality, the value of D should depend on the size of the activity as well as any postrain remedial action taken. However, this survey neglects these effects and assumes that D is dependent only on the time needed to release the impact of rain without special remedial action. The productivity losses and days of subsequent im-pacts are used as input variables for the evaluation model. For other construction projects, these data should be revised according to different characteristics and requirements of ac-tivities.
Fig. 1. Productivity loss and days of subsequent impact.
Fig. 2. Fuzzy membership function u(x).
Constructing the evaluation model involves combining the historical daily data of precipitation with the P L and D. In addition, the questionnaire is conducted on the basis of differ-ent levels of rain instead of the exact amount of precipitation, thereby necessitating that the exact amount of precipitation be converted into a fuzzy description of different levels of rain. To achieve this objective, a well-adopted fuzzy mem-bership function u(x) is used herein. Figure 2 defines u(x), as illustrated below.
As Figure 2 shows, a fuzzy set R of precipitation can be defined as Equation (1). For instance, with a 24-mm amount of precipitation, the fuzzy set R can be obtained as in Equa-tion (2).
R = [u(x1)/ Drizzling, u(x2)/ Little,
u(x3)/ Medium, u(x4)/ Heavy] (1) R = [0, 0, 0.75, 0.25] (2) According to the survey results in Table 2, the productivity losses for different levels of rain ( P L) can be defined as a 1× 4 matrix. Then the direct productivity loss LDdue to a
particular amount of precipitation for a specific activity can be calculated as in Equation (3):
LD= R × P L(%) (3)
In this example, the direct productivity loss of earth back-fill subjected to a 24-mm amount of rain is calculated as in Equation (4): LD = R × P L = [0, 0, 0.75, 0.25] × 0 20% 80% 100% = (0.75 × 0.8 + 0.25 × 1) = 85% (4) In a similar approach, the days of subsequent impact for different levels of rain (D) can be defined as a 1× 4 ma-trix. Thus the total days of subsequent impact Ds due to a
particular amount of precipitation for a specific activity can be calculated as in Equation (5). The case example can be calculated in Equation (6) as a result of 3 days.
Fig. 3. Subsequent productivity losses attributed to a single rainfall. Ds = R × D = [0, 0, 0.75, 0.25] × 0 1 2 6 = (0.75 × 2 + 0.25 × 6) = 3 (days) (6) According to Equations (4) and (6), the LDand Dsfor earth
backfill subjected to a 24-mm amount of rain are calculated. Then the individual subsequent productivity loss for each of these 3 days, attributed to this 24-mm rainfall, can be evaluated as in Figure 3 and Equation (7).
Lj = LD j= 0 LD(2Ds− 2 j + 1)/2Ds 0< j ≤ Ds 0 j > Ds (7)
where Ljis the subsequent productivity loss for the following
j th day
According to Equation (7), the productivity loss for each day can be obtained as follows:
L0 = 85%
L1 = 85% × 5/6 = 71% L2 = 85% × 3/6 = 43%
L3 = 85% × 1/6 = 14% (8) 4.3 Productivity impact of multiple rainfalls
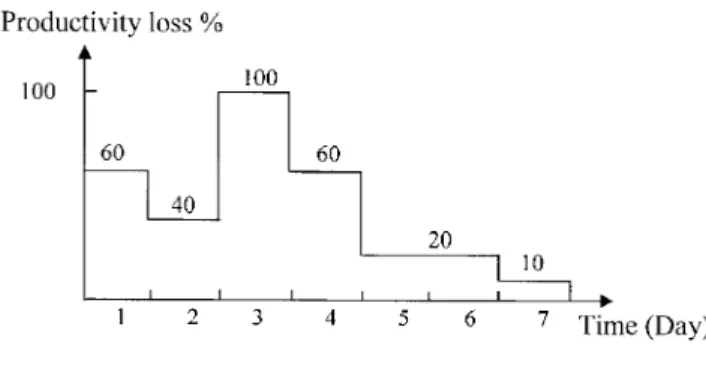
In practice, multiple rainfalls may occur all the time and re-sult in overlapping impacts on productivity and schedule. For highway construction, this effect is significant because the compacting work cannot be performed until the water in soil has been properly distributed to a certain extent. When multiple rainfalls occur, the impacts of subsequent produc-tivity losses should be accumulated. In this study I adapt an upper limit of productivity loss of 100% for calculating the overlapping subsequent productivity losses attributed to mul-tiple rainfalls. The total productivity loss of the i th day (Li)
due to multiple rainfalls can be calculated as in Figure 4 and
Fig. 4. Productivity losses due to multiple rainfalls.
Fig. 5. Case example of productivity losses attributed to multiple rainfalls. Equation (9): Li = ½ Li D+ 6Li j Li D+ 6Li j≤ 1 1 Li D+ 6Li j > 1 (9)
where Li D is the direct productivity loss attributed to the
rainfall on the i th day and6Li j is the accumulation of sub-sequent productivity losses attributed to previous rainfalls on the i th day.
4.4 Schedule impact subjected to rain
Once the productivity loss is determined as in the preced-ing section, the schedule impact for a specific activity can be calculated as in Equation (10). The TR is determined as the
minimum items deemed necessary to ensure that the sum-mation of “remaining productivity” reaches To. Restated, it
is the duration deemed necessary to complete the activity by the remaining productivity under the impact of multiple rainfalls.
TR
X
i=1
(1 − Li) ≥ To (10)
where Tois the activity duration under the no-rain situation
and TRis the activity duration subjected to the impact of rain.
For a case example (as Figure 5 depicts), assume that Tois
equal to 3 days; then TRcan be calculated as follows. At least
to or greater than To. Therefore, the revised duration TRcan
be obtained as 6 days.
(1 − L1) + (1 − L2) + · · · + (1 − LT R) ≥ 3 (11) 0.4 + 0.6 + 0 + 0.4 + 0.8 + 0.8 ≥ 3 (12)
5 SYSTEM STRUCTURE
The daily data of precipitation for the past three decades (1967–1997) in 11 major areas and cities in Taiwan were accumulated to integrate with the analytical model for cal-culating the schedule impact of rain. In this study, the Ms-Project was adapted as the system mainframe to construct a computer-aided schedule forecasting system for construc-tion projects subjected to the impact of rain. The Ms-Project is a readily available and useful software for project schedul-ing. Although some of the functional capabilities may not compete with other major scheduling tools such as P3 and OPENPLAN, Ms-Project has become increasingly popular due to its friendly interface, system application, and other advanced function features. The historical daily data of pre-cipitation are developed in a database format and linked to the Ms-Project’s input file. Other interfaces for importing data about the locations of construction sites and the starting dates of projects are programmed by Visual Basic to link with Ms-Project. All the functional capabilities of Ms-Project are still available for the system user.
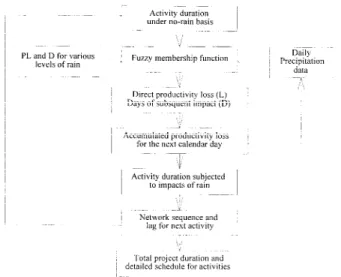
In this computer-aided system, the user must first specify the location of the construction project as well as the project’s starting date. Then the system is automatically linked with the related data on precipitation. A selection interface was build into the system for the user to select the year(s) of precipitation data for simulation. The user can select a specific year of high precipitation for pessimistic forecasting or the 30 sets of data for simulation. This system also contains the results of questionnaire surveys and expert reviews for default input that can be revised by the user for possible modification. A pull-down menu and interface are provided for the user to view and update the historical daily data on precipitation if expansion is necessary. Figure 6 depicts the system structure, and Figure 7 displays the calcualting flowchart.
6 ILLUSTRATIVE EXAMPLE
In this study, a typical real-life highway construction project was used to demonstrate the performance of this computer-aided schedule forecasting system. This project is located in the Keelung area of north Taiwan. Table 3 lists the preliminary information of the activities in the network as well as the predecessors and the duration under no-rain basis.
Four different conditions were tested to examine the sched-ule impact of rain as well as the effectiveness of this system.
Fig. 6. System structure for the computer-aided forecasting system.
Fig. 7. Calculating flowchart for schedule impact of rain.
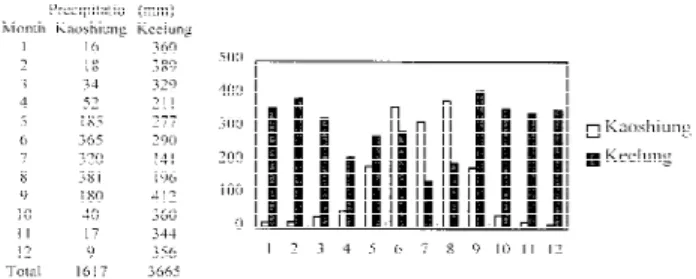
They are in the Kaoshiung area with the starting dates of Jan-uary 1, 1997 and August 1, 1997 and in the Keelung area with the starting dates of January 1, 1997 and August 1, 1997, respectively. The Kaoshiung area is located in south Taiwan, in which the impact of rain is insignificant and the summer is the rainy season. Comparatively, the Keelung area is located in north Taiwan, in which the impact of rain is significant and the summer has less precipitation. Figure 8 presents the average monthly precipitation of each month in the Kaoshiung and Keelung areas for the past three decades. Although this system used the daily data on precipitation, the data in Figure 8 already imply a significant impact of total project duration. Notably, even though the project is con-structed in the same Kaoshiung area, if the starting date is shifted from August 1 to January 1, the backfill and compact-ing activity may need to be done in the rainy season instead of during a slight-rain situation. In this case, the schedule
im-Table 3
Preliminary information of highway construction example
Activity No-rain duration Predecessors and lag
1 Site clearing 135 None
2 17+ 900 − 20 + 300 excavation 95 1SS+ 14d∗ 3 21+ 900 − 24 + 500 excavation 149 2 4 17+ 900 − 20 + 300 backfill 110 2SS+ 14d 5 21+ 900 − 24 + 500 backfill 124 4 6 Base-level aggregate 18 5, 3 7 17+ 900 − 20 + 300 base-level asphalt 60 6 8 21+ 900 − 24 + 500 base-level asphalt 66 7
9 17+ 900 − 20 + 300 compact graded asphalt 59 7SS+ 7d
10 21+ 900 − 24 + 500 compact graded asphalt 62 9, 8SS+7d
11 Open-graded asphalt 18 10
∗1SS+14d: start-to-start relationship with 14 days lag of activity 1.
Fig. 8. Average monthly precipitation in Kaoshiung and Keelung (mm).
pact of rain is essential, resulting in a significantly extended duration.
Table 4 displays the project duration forecasting, as sim-ulated by this schedule forecasting system for the preceding four conditions versus actual project duration. This real-life project was completed in September 1998. The actual total project duration was 912 days, which included a change or-der of 40 days’ duration extension. Tables 5 and 6 list the detailed schedule for each project activity in the Kaoshiung and Keelung areas, respectively, with starting date on Jan-uary 1. The significant difference in total project duration reveals the importance of considering the schedule impact of rain. Table 7 compares the different activity durations in the Kaoshiung area with project starting dates of January 1 and August 1.
7 DISSCUSSION AND SYSTEM VERIFICATION The schedule forecasting results in Tables 4 to 7 show essen-tial differences and deserve close examination. The precip-itation data in Figure 8 reveal that the total precipprecip-itation in the Keelung area is more twice that of the Kaoshiung area.
Meanwhile, for the same project to be constructed in different locations, the computer system estimates that the total dura-tion in Keelung is approximately 1 year longer (892 versus 516 days) than in Kaoshiung. The fact that the precipitation in Kaoshiung is insignificant accounts for why the total dura-tion in Kaoshiung is only about 3 months longer (516 versus 427 days) than the no-rain situation. Consider a situation in which the project manager or scheduler either neglects the productivity loss and subsequent impact of rain or is unfa-miliar with the weather and distribution of rain in the Keelung area. Under such a circumstance, the experience-based judg-ment of precipitation impact on the project schedule may be underestimated. In a situation such as the illustrative exam-ple, a general duration estimate for this project in Keelung is 700 days. It was found by adding 6 months to the total duration in Kaoshiung so as to consider twice the amount of precipitation in Keelung. This estimate appears acceptable for some project managers and schedulers. However, the du-ration forecasting system developed in this study estimates an 892-day duration by adopting the daily precipitation data in Keelung. If the prediction result of the system is correct, then the underestimated experience judgment of project duration could cause a serious schedule delay. The cost for compress-ing the schedule and the enormous amount of delay penalty may directly contribute to project failure.
As in Table 4, the actual total project duration of this real-life project was 912 days. Subtracting the 40-day ex-tension of the change order, it takes 872 days to complete this project. This result is quite close to the prediction of the proposed computer-aided system. On the contrary, the esti-mate (700 days) made by an experienced scheduler from the Kaoshiung area has been proved to be overoptimistic and un-realistic. The effectiveness and value of this system also have been demonstrated by several other highway construction projects. As a result, this proposed computer-aided system is highly appreciated by those experts and schedulers who assisted in this research.
Table 4
Project duration forecasting versus actual total project duration
Location, Kaoshiung, Kaoshiung, Keelung, Keelung, Keelung, start date No-rain August1 January1 August1 January1 3/15/1996
Project 427 516 531 892 850 912
duration
(days)
Table 5
Detailed schedule for each activity in Kaoshiung
Activity Duration Start date Finish date
1 Site clearing 148 1997/1/1 1997/5/28 2 17+ 900 − 20 + 300 excavation 104 1997/1/15 1997/4/28 3 21+ 900 − 24 + 500 excavation 208 1997/4/29 1997/11/22 4 17+ 900 − 20 + 300 backfill 135 1997/1/29 1997/6/12 5 21+ 900 − 24 + 500 backfill 172 1997/6/13 1997/12/1 6 Base-level aggregate 18 1997/12/2 1997/12/19 7 17+ 900 − 20 + 300 base-level asphalt 67 1997/12/20 1998/2/24 8 21+ 900 − 24 + 500 base-level asphalt 79 1998/2/25 1998/5/14
9 17+ 900 − 20 + 300 compact graded asphalt 66 1997/12/27 1998/3/2 10 21+ 900 − 24 + 500 compact graded asphalt 75 1998/3/4 1998/5/17
11 Open-graded asphalt 29 1998/5/18 1998/6/15
Total project duration in Kaoshiung 531 1997/1/1 1998/6/15
Table 6
Detailed schedule for each activity in Keelung
Activity Duration Start date Finish date
1 Site clearing 221 1997/1/1 1997/8/9 2 17+ 900 − 20 + 300 excavation 188 1997/1/15 1997/7/21 3 21+ 900 − 24 + 500 excavation 295 1997/7/22 1998/5/12 4 17+ 900 − 20 + 300 backfill 216 1997/1/29 1997/9/1 5 21+ 900 − 24 + 500 backfill 280 1997/9/2 1998/6/8 6 Base-level aggregate 24 1998/6/9 1998/7/2 7 17+ 900 − 20 + 300 base-level asphalt 113 1998/7/3 1998/10/23 8 21+ 900 − 24 + 500 base-level asphalt 157 1998/10/24 1999/3/29 9 17+ 900 − 20 + 300 compact graded asphalt 107 1998/7/10 1998/10/24 10 21+ 900 − 24 + 500 compact graded asphalt 141 1998/10/31 1999/3/20
11 Open-graded asphalt 41 1998/3/21 1999/4/30
Total project duration in Keelung 850 1997/1/1 1999/4/30
On the other hand, the detailed schedule for each activ-ity, as presented in Tables 5 and 6, also must be examined to focus management efforts on those activities significantly affected by the rain. According to the results, in this high-way construction project, except the base-level aggregate and open-grade asphalt, the remaining activities are related to ex-cavation, backfill, and compacting. Thus the impact of rain is essential, accounting for why the different amounts of precip-itation cause enormous differences in total project duration (850 versus 531 days) for different project locations.
Finally, even in the same project location, different start-ing dates also may result in significant differences in project schedule and total duration. The estimated results in Table 7 display the impact. According to the precipitation data in Figure 8, May to September are the major rainy months in Kaoshiung. The ultimate differences in total project duration are attributed primarily to the schedule impact of rain on ac-tivities 3, 5, and 7. Although the total duration difference in Table 7 is only 15 days, under a circumstance in which productivity is critical to rainy seasons, the different project
Table 7
Comparison of activity duration in Kaoshiung with different starting dates
No-rain Start on Start on Activity duration Jan.1,1997 Aug.1,1997
1 Site clearing 135 148 156 2 17+ 900 − 20 + 300 excavation 95 104 115 3 21+ 900 − 24 + 500 excavation 149 208 165 4 17+ 900 − 20 + 300 backfill 110 135 126 5 21+ 900 − 24 + 500 backfill 124 172 141 6 Base-level aggregate 18 18 27 7 17+ 900 − 20 + 300 base-level asphalt 60 67 101 8 21+ 900 − 24 + 500 base-level asphalt 66 79 72
9 17+ 900 − 20 + 300 compact graded asphalt 59 66 96
10 21+ 900 − 24 + 500 compact graded asphalt 62 75 67
11 Open-graded asphalt 18 29 19
Total project duration in Kaoshiung 427 531 516
startings date may significantly impact the project schedule and total duration.
8 CONCLUSIONS
This study presents an analytical model to evaluate the pro-ductivity loss attributed to rain and precipitation. Based on the proposed model, a computer-aided system is developed for project duration forecasting subjected to the impact of rain. This duration forecasting system demonstrates practi-cal application in the schedule planning process, particularly while considering the impact of rain. In addition, a typical highway construction project is used for testing the perfor-mance and effectiveness of the system. The real-life project duration is also compared with the forecasted result as well as with the judgment-based duration estimate. According to the comparisons, the proposed system can achieve more realistic and accurate results to help the scheduler in considering the impact of rain.
This study incorporates the concept of different levels of rain, the direct productivity loss attributed to different amounts of rain, the subsequent productivity impact of rain, and finally, the historical daily data of precipitation for project duration forecasting. The user is allowed to specify a certain year’s precipitation data on which the simulation is based on. Al-though this study use the precipitation data for Taiwan to develop this computer-aided system, the overall methodol-ogy in developing this computer schedule forecasting system can be applied to other countries as long as historical data on precipitation are available.
ACKNOWLEDGMENTS
I would like to thank the National Science Council, Republic of China, for financially support this research under Contract No. NSC-87-2211-E-002-059.
REFERENCES
1. Adeli, H. & Karim, A., Scheduling/cost optimization and neu-ral dynamics model for construction, Journal of Construction
Engineering and Management, ASCE, 123 (4) (1997), 450–8.
2. Ahuja, H. N. & Nandakumar, V., Simulation model to forecast project completion time, Journal of Construction Engineering
and Management, ASCE, 111 (4) (1985), 325–42.
3. Ayyub, B. M. & Haldar, A., Project scheduling using fuzzy set concept, Journal of Construction Engineering and
Manage-ment, ASCE, 110 (2) (1984), 189–204.
4. Benjamin, N. B. H. & Greenwald, T. W., Stimulating effects of weather on construction, Journal of Construction Division,
ASCE, 99 (1) (1973), 177–80.
5. Carr, R. I., Simulation of construction project duration, Journal
of Construction Division, ASCE, 105 (2) (1979), 117–28.
6. Crandall, K. C., Probabilistic time scheduling, Journal of
Con-struction Division, ASCE, 102 (3) (1976), 415–23.
7. Moder, J. J., Phillips, C. R. & Davis, E. W., Project Management
with CPM, PERT and Precedence Diagramming, Van Nostrand
Reinhold, New York, 1983.
8. Moselhi, O., Gong, D. & El-Rayes, K., Estimating weather im-pact on the duration of construction activities, Canadian
Jour-nal of Civil Engineering, 24 (3) (1997), 359–66.
9. Padilla, E. M. & Carr, R. I., Resource strategies for dynamic project management, Journal of Construction Engineering and
Management, ASCE, 117 (2) (1991), 279–93.
10. Smith, G. R. & Hancher, D. E., Estimating precipitation im-pact for scheduling, Journal of Construction Engineering and
Management, ASCE, 115 (4) (1989), 552–66.
11. Touran, A. & Wiser, E. P., Monte Carlo technique with corre-lated random variables, Journal of Construction Engineering