0040-6090/03/$ - see front matter䊚 2003 Elsevier Science B.V. All rights reserved. doi:10.1016/S0040-6090(03)00456-5
Comparison of visible fluorescence properties between sol–gel derived
Er
3q–Yb
3qand Er
3q–Y
3qco-doped TiO films
2
San-Yuan Chen *, Chu-Chi Ting , Wen-Feng Hsieh
a, a bDepartment of Materials Science and Engineering, National Chiao-Tung University, 1001 Ta-hsueh Road, Hsinchu 300, Taiwan, ROC a
Institute of Electro-optical Engineering, National Chiao-Tung University, Hsinchu 300, Taiwan, ROC b
Received 24 September 2002; received in revised form 18 February 2003; accepted 18 February 2003
Abstract
Both Er3q–Yb3q and Er3q–Y3qco-doped TiO films were prepared on fused silica by sol–gel processes. The effect of doping
2
concentration upon the up-conversion fluorescence of Yb3q–Er3qand Er3q–Y3q co-doped TiO systems will be focused in this
2
investigation. Although the influence of Yb3q and Y3q ions on the structural of Er3q–TiO host material is almost the same,
2
different up-conversion emissions are observed. Both Er3q-doped and Er3q–Y3q co-doped TiO films exhibit the up-conversion
2
emission with green and red light. However, much stronger intensity of red light relative to green light is observed for the Er3q– Yb3q co-doped TiO system. For Er3q (5 mol%)–Y3q co-doped TiO samples, the relative intensity ratio (I yI ) rapidly
2 2 R G
decreases with the increase of Y3q concentration above 10 mol%. On the contrary, the relative intensity ratio(I yI ) increases
R G
with increasing Yb3qconcentration for Er3q (5 mol%)–Yb3q co-doped TiO samples. The up-conversion emission in the Er3q–
2
Y3q co-doped TiO system belongs to a two-photon absorption up-conversion process. However, the overall up-conversion
2
efficiency in the Er3q–Yb3qco-doped TiO system could be contributed from the complicated mechanisms.
2
䊚 2003 Elsevier Science B.V. All rights reserved.
Keywords: Titanium oxide; Up-conversion; Sol–gel; Raman scattering
1. Introduction
Some rare-earth ions, when incorporated as impurities in sufficient concentration into suitable host materials, can up-convert infrared radiation into various shorter wavelengths w1,2x. This process plays an important role in enhancing optical detection and display devices. Over the past two decades, a number of papers have accu-mulated in search of new materials with high up-conversion efficiency w3–6x. For instance, numerous systems with Er3q ions doped have been thoroughly studied in glasses w3x, fiber amplifiers w4x, sol–gel glass
w5x and crystals w6x. However, when developing the
rare-earth-doped optical devices, the optical properties of the host materials have to be considered since the efficiency of up-conversion strongly depends on the crystal-field strength and lattice vibration of host matrices.
*Corresponding author. Tel.: 5731818; fax: q886-3-5724727.
E-mail address: [email protected](S.-Y. Chen).
Amorim et al. reported that low-phonon energy and high refractive index of sulfide-based chalcogenide glasses can reduce the nonradiative decay rates of rare-earth energy levels, and enhance the radiative emission rates w7x. Similarly, TiO thin film was reported to have2
higher refraction index (ns2.52 for anatase and ns
2.76 for rutile) as well as lower phonon energy (-700
cmy1) w8x than silica glass film. Recently, it has been
demonstrated that Er3q-doped TiO -based films have
2
potential applications in the micro-integrated photonic devices w9,10x. Furthermore, in our previous report, we have demonstrated that by codoping yttrium into the Er3q-doped TiO -based films, the ;1.54 mm PL
prop-2
erties can be enhanced by a factor of 10 times for intensity and 1.5 times for full width at half maximum in comparison with the Er3q–Al3q co-doped SiO
2
system w11x. The enhanced PL emission of the Er3q– Y3q co-doped TiO films is attributed to the sufficient
2
dispersion and distorted local structure of Er3q ions in TiO host matrix. In contrast to Y3q ions, Yb3q ions
2
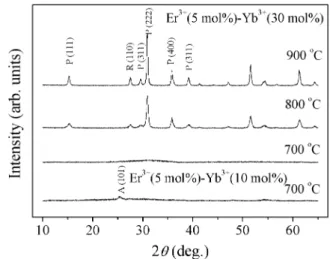
Fig. 1. XRD patterns of Er3q–Yb3q(10 or 30 mol%) co-doped
TiO annealed from 700 to 900 8C for 1 h.2 because Yb3q ions can more efficiently absorb the 980
nm light and transfer the energy to Er3qions w12x. This mechanism makes the population of I4 Er3q level
11y2
increase and leads to the enhancement of ;1.54 mm PL efficiency.
Recently, it has been proposed by some investigators that multi-ion doped systems can be utilized to enhance up-conversion efficiency w13,14x. For example, relative-ly high up-conversion efficiency through energy transfer has been reported for BaF –ThF glass systems with2 2
Yb3qyEr3q and Yb3qyTm3q co-doped w14x. On the other hand, it has been known that these Yb3qyY3qy
Er3q ions have similar ionic radii (Yb s0.0862 nm,3q
Y3qs0.0892 nm and Er3qs0.0881 nm) and Yb O y 2 3
Y O2 3yEr O have nearly the same crystal structural.2 3
However, Yb3q and Y3q belong to different chemical groups. Yb is characteristic of intra-4f transition and the
outer closed 5s 5p shells screen the unfilled inner 42 6 f11
shell but Y does not have intra-4f transition orbital w15,16x. Furthermore, up to now, little or no attention
has been directed to the up-conversion characteristics of Er3q-doped TiO ceramics w17x.
2
Therefore, in this work, the Yb3qor Y3q ions have been tried to co-doped into co-doped TiO systems. The2
effect of doping concentration upon the up-conversion fluorescence will be studied for both co-doped TiO2
systems. Further comparison of up-conversion fluores-cence was investigated to clarify the role of Yb3q and Y3q codopants in Er3q-doped TiO based on structural
2
similarity and different characteristics between Yb3q
and Y3q.
2. Experimental procedure
2.1. Sample preparation
Acetic acid (HAc, Merck) and 2-methoxyethanol (MOE, Merck) with molar ratio of TiyHAcyMOEs1y
10y15 were first added to titanium isoproxide (Alfa),
followed by stirring for 30 min. Subsequently, the ytterbium acetate(or yttrium acetate) (Alfa) and erbium
acetate(Alfa) powders were dissolved into the titanium solution and stirred for 10 h to process homogeneous hydrolysisypolymerization reaction. The molar ratios of
Er3qyTi4q and Yb3q (or Y )yTi3q 4q were varied from 0.5 to 10 mol% and 10 to 50 mol%, respectively.
For the thin film fabrication, the Er3q–Yb3q co-doped TiO precursor solution was spin-coated on fused2
silica substrates. The as-deposited sol–gel films were first pyrolyzed under dry oxygen atmospheres at 400 8C for 30 min at a heating rate of 3 8Cymin and then
annealed at temperatures ranging from 700 to 1000 8C for 1 h in dry oxygen atmosphere. Multiple spin-coating processes were employed to deposit ;0.5 mm thick films. For comparison purpose, the Er3q–Y3qco-doped
TiO2 films following the same procedure were also fabricated.
2.2. Characterization measurements
The phase structure of samples was analyzed by X-ray diffractometer using Cu Ka radiation. A 980 nm diode laser with power of 50 mW was used as the pump source inclined 458 to irradiate the samples. The fluo-rescence spectra were recorded normally from the sam-ples at room temperature using a spectrophotometer
(ARC) equipped with a liquid N -cooled Ge detector2
for the detection of infrared fluorescence, and a multi-alkali photomultiplier tube for the detection of visible fluorescence. The Raman spectrum was recorded on a Jobin-Yvon T6400 instrument with an Arq laser source of 514 nm wavelength and an incident power of 2 mW mmy2.
3. Results and discussion
3.1. Structural evolution
The X-ray diffraction(XRD) patterns in Fig. 1 show that the effect of annealing temperatures on structural evolution of Er3q(5 mol%)–Yb (10 or 30 mol%) co-3q
doped TiO . At 700 8C, the anatase TiO phase can be2 2
detected for the sample with 10 mol% Yb3q codoping but when the concentration of Yb3qions increases more than 10 mol%, the host matrix becomes amorphous. As the samples are further annealed at 800 8C, the well-crystallized pyrochlore crystallite Er Ybx 2yxTi O2 7 has been generated within the TiO2 host matrix. Similar results are also observed in the Er3q–Y3qco-doped TiO system because the ionic radius of both Yb3qand
2
Y3q ions is very similar to that of Er3q ion. It is interesting to note that Er Ti O ,2 2 7 Yb Ti O2 2 7 and
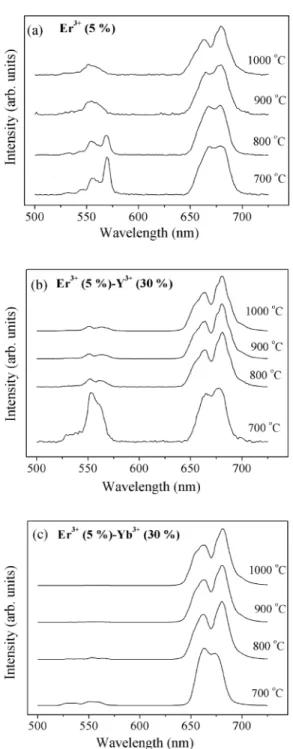
Fig. 2. Up-conversion spectra of (a) Er3q (5 mol%)–Yb3q (0–50
mol%) (b) Er3q(5 mol%)–Y3q(0–50 mol%) co-doped TiO sam-2 ples annealed at 700 8C for 1 h. All of the spectra were normalized on the same basis on intensity for comparison among spectral features.
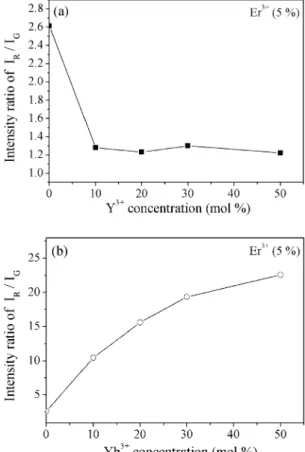
Fig. 3. Intensity ratio ofI yI as a function of codopant concentrationR G in(a) Er3q(5 mol%)–Y3qand(b) Er3q(5 mol%)–Yb3qco-doped TiO systems2 (where I and I represents the intensity of red andR G green up-converted emission).
Y Ti O pyrochlore phases have the same crystal struc-2 2 7
ture and similar lattice constant. Therefore, pyrochlore phases in Er3q–Yb3q or Er3q–Y3q co-doped TiO
2
samples can be regarded as Er Yb2 2yxTi O2 7 or Er Y Ti O , where Er3q, Yb3q and Y3q ions are
2 2yx 2 7
structurally indistinguishable. In the pyrochlore phase such as Yb Ti O , Ti4qions are six coordinated and are
2 2 7
located within trigonal antiprisms with all the six anions at equal distance from the central Ti4qcations. However, Er3q (Y3q or Yb3q) ions are eight coordinated and
located within scalenohedra (distorted cubes) that
con-tain six equal-space anions at a slightly shorter distance from the central Er3q (Y3q or Yb3q) cations w18x. The
aforementioned local structural evolution of Er3q ions can considerably influence the photoluminescence
prop-erties of Er3q–Yb3q (or Er –Y ) co-doped TiO3q 3q 2
systems.
3.2. Up-conversion properties
Fig. 2 shows the up-conversion luminescence in the 500–700 nm range for Er3q (5 mol%)–Yb3q(or Y )3q
co-doped TiO samples annealed at 700 8C hy1.
Accord-2
ing to the Er3q ion energy level diagram, these visible fluorescence spectra exhibit the bands at approximately 569 and 554 nm which are identified as the S4 ™
3y2
I and H ™ I transitions, as well as the band
4 4 4
15y2 11y2 15y2
at approximately 660 nm corresponding to the F4 ™ 9y2
I transition.
4 15y2
Obviously, there exists remarked difference between Er3q–Yb3q and Er3q–Y3q co-doped TiO systems.
2
Both Er3q-doped and Er3q–Y3q co-doped TiO films
2
exhibit the up-conversion emission with green and red light. However, much stronger intensity of red light relative to green light is observed in the Er3q–Yb3q
co-doped TiO system. Fig. 3 shows the relative intensity2
ratio of I yIR G (where I and I represent the intensitiesR G
of red and green up-converted emission, respectively) as a function of Y3qor Yb3qconcentration in Er3q(5
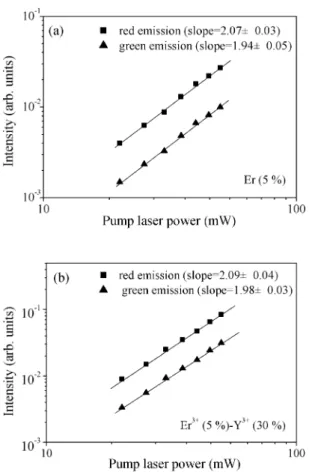
Fig. 4. Intensities of both green and red up-converted emissions vs. the pump power for the(a) Er3q(5 mol%)-doped and (b) Er3q(5
mol%)–Y3q (30 mol%) co-doped TiO systems annealed at 700 2
8C hy1.
Fig. 5. Intensities of red up-converted emissions vs. the pump power for the Er3q (5 mol%)–Yb3q (30 mol%) co-doped TiO systems
2 annealed at 700 8Cy1 h.
Fig. 6. Dependence of the overall green and red up-conversion inten-sity (I qI ) on the codopant concentration for Er3q (5 mol%)–
R G
Yb3qand Er3q(5 mol%)–Y3qco-doped TiO systems annealed at 2
700 8Cy1 h(where I and I represent the intensity of red and greenR G up-converted emission).
mol%)–Y3q and Er3q (5 mol%)–Yb3q co-doped TiO systems. By codoping Y3q ions, the relative
2
intensity ratio (I yI ) decreases from ;2.6 to anR G
approximately fixed value of ;1.3 for Er3q(5
mol%)-doped TiO samples with Y3q concentration above 10
2
mol%. On the contrary, the relative intensity ratio (I yR
I ) increases with increasing Yb3q concentration for
G
Er3q(5 mol%)–Yb3qco-doped TiO samples. In
addi-2
tion, the influence of Y3qor Yb3qconcentration on the line shape of visible fluorescence is not so pronounced, which was also observed in Er3q–Al3q co-doped SiO
2
system w5x.
For the Er3q-doped and Er3q–Y3q co-doped TiO
2
samples annealed at 700 8C for 1 h, the intensity of both green and red up-conversion emissions vs. the pump power at 980 nm has been plotted in Fig. 4. The slope in Fig. 4 is approximately equal to 2 on a log– log scale. This result confirms that green and red emissions belong to a two-photon absorption up-conver-sion process w19–21x. However, a slope of 1.5 for the Er3q–Yb3q co-doped TiO samples shown in Fig. 5
2
indicates that the mechanism is not a biphotonic case. The dependence of the overall green and red up-conversion intensity(I qI ) on codopant concentrationR G
is summarized in Fig. 6 for both Er3q (5 mol%)–
Yb3qand Er3q(5 mol%)–Y3qco-doped TiO samples
2
annealed at 700 8Cy1 h. The Er3q (5 mol%)–Yb3q co-doped TiO system has the much higher up-conversion2
efficiency than Er3q (5 mol%)–Y3q co-doped TiO
2
system.
The influence of annealing temperatures (from 700
to 1000 8C) on an up-conversion emission is shown in
Fig. 7 for Er3q(5 mol%)-doped, Er3q (5 mol%)–Y3q (30 mol%) co-doped and Er3q (5 mol%)–Yb3q (30
mol%) co-doped TiO systems. As the samples were2
annealed above 800 8C, these spectra show a common feature. In other words, a broad red emission splits into two peaks and the relative intensity ratio(I yI ) slightlyR G
increases with the increase of annealing temperatures or the formation of pyrochlore phase.
The multiphonon relaxation processes are directly related to the phonon energy of host materials and
Fig. 7. Up-conversion spectra of (a) Er3q (5 mol%)-doped; (b)
Er3q(5 mol%)–Y3q(30 mol%) co-doped and; (c) Er3q(5 mol%)–
Yb3q(30 mol%) co-doped TiO samples annealed from 700 to 1000 2
8C for 1 h. All of the spectra were normalized on the same basis on
intensity for comparison among spectral features.
Fig. 8. Raman spectra of anatase, rutile, Y Ti O and Yb Ti O .2 2 7 2 2 7
Fig. 9. Raman spectra of(a) Er3q(5 mol%)–Y (10–50 mol%) and (b) Er3q(5 mol%)–Yb (10–50 mol%) co-doped TiO annealed at
2 700 8C for 1 h.
characteristics of codopant (e.g. concentration, crystal
field and sensitizing) w22x. Low-energy phonon
materi-als prevent de-excitation of the excited-state levels through non-radiative phonon-assisted relaxation that results in a strongly enhanced luminescent quantum yield for near infrared radiation into visible light through frequency up-conversion w7,13x. Fig. 8 illustrates that
anatase TiO shows a strong Raman band at 157 cmy1 2
and weak bands at 400, 515 and 635 cmy1. The bands of rutile TiO are at 612, 448 and 240 cmy1 w24x.
2
Generally, the bands approximately 157 and 612 cmy1
are used to identify anatase and rutile phases, respec-tively. Both Yb Ti O and Y Ti O pyrochlore phases2 2 7 2 2 7
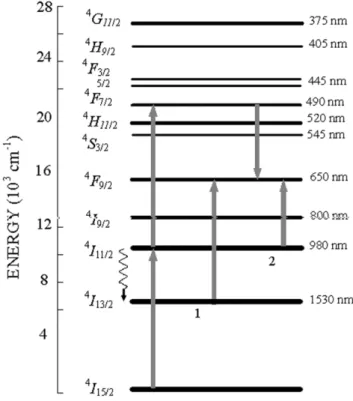
Fig. 10. Schematic up-conversion mechanism of the Er3qESA under 980 nm pumping.
exhibit very similar Raman spectra and the maximum phonon energies are located approximately 710–720 cmy1. The Raman spectra (Fig. 9a) in the Er3q (5
mol%)–Y3q (10–50 mol%) co-doped TiO samples
2
annealed at 700 8Cy1 h illustrate that 30–50 mol% Y
codopant can result in the amorphous host matrix with two weak and broad bands approximately 412 and 718 cmy1. However, the host matrix with mixed anatase and rutile phases is observed for 10–20 mol% Y codopant. Similar phenomenon as shown in Fig. 9b is also detected for Er3q (5 mol%)–Yb3q (10–50 mol%) co-doped
TiO system. As the samples were annealed above 8002 8C, the Raman spectra(no shown here) reveal that both
Er3q(5 mol%)–Yb3q(30 mol%) and Er3q(5 mol%)–
Y3q (30 mol%) co-doped TiO systems have very
2
similar phonon energy. Therefore, the influence of mul-tiphonon relaxation processes on the up-conversion effi-ciency for these two systems is almost the same, which indicates that the up-conversion efficiency is mainly determined by the characteristics of codopant.
In general, there are two kinds of up-conversion mechanisms w4,23,24x: excited-state absorption (ESA)
and energy-transfer up-conversion(ETU). In the Er (53q
mol%)–Y3q(10–50 mol%) co-doped TiO system, the 2
intensity of visible fluorescence presents a quadratic dependence on infrared pump intensity, which suggests that the possible up-conversion excitation mechanism is the two-photon absorption followed by phonon-assisted energy transfer. TheI yI intensity ratio has an approx-R G
imately fixed value of ;1.3, which means that the probability of nonradiative phonon-assisted decay from F to green emitting levels ( H and S ) and to
4 4 4
7y2 11y2 3y2
red emitting level( F ) is similar. On the other hand,4 9y2
a very strong intensity of the red emission with a power dependence of 1.5 is observed in the Er3q (5 mol%)–
Yb3q(10–50 mol%) co-doped TiO system, which also 2
occurs in Er3q–Yb3q co-doped SiO system. The lack
2
of simple power dependence is not surprising since several excitation mechanisms appear to be involved. Except for the ESA, Er3q–Er3q ETU and Yb3q–Er3q
double energy transfer mechanisms can produce the red emission. Furthermore, the other two main up-conver-sion paths as shown in Fig. 10 also contribute to the red emission w25,26x. Because the Er3q excited state level I4 might be saturated by the energy transfer of
11y2
Yb3q ( F ) electrons in this I4 4 level and relax to
5y2 11y2
I level through a multi-phonon relaxation and then
4 13y2
the F4 level is populated via ESA of pump photons.
9y2
The other mechanism is that the Er3qexcited state level F is deexcited to the F accompanied with raising
4 4
7y2 9y2
the other state level from 4I to 4F through an
11y2 9y2
energy transfer cross-relaxation. The above two extra mechanisms can make the F4 level more populated.
9y2
Therefore, the final obtained up-conversion efficiency can be summarized from the overall contributions of the five mechanisms which result in a very strong red
emission in Er3q–Yb3q co-doped TiO system
com-2
pared to Er3q–Y3qco-doped TiO system.
2
4. Conclusions
Both Er3q–Yb3qand Er3q–Y3qco-doped TiO films
2
were prepared on fused silica by sol–gel processes. The influence of Yb3q and Y3q ions on the structural and phase development of Er3q–TiO host material is almost
2
the same. Both Er3q-doped and Er3q–Y3q co-doped TiO samples exhibit the up-conversion emission with2
green and red light. For Er3q(5 mol%)–Y3q co-doped TiO system, the relative intensity ratio2 (I yI ) rapidlyR G
drops with the increase of Y3q concentration above 10 mol%. On the contrary, the relative intensity ratio (I yR
I ) increases with increasing Yb3q concentration for
G
Er3q (5 mol%)–Yb3q co-doped TiO system. In
addi-2
tion, the up-conversion emission in the Er3q–Y3q co-doped TiO system belongs to a two-photon absorption2
up-conversion process that is different from that of Er3q–Yb3qco-doped TiO system.
2
Acknowledgments
This work was financially supported by the National Science Council of the Republic of China, Taiwan under Contract No. NSC90-2216-E-009-041.
References
w1x T.J. Whitley, C.A. Millar, R. Wyatt, M.C. Brierley, D. Szebesta,
Electron. Lett. 27(1991) 1785.
w2x F. Auzel, P. Pecile, D. Morin, J. Electrochem. Soc. 122(1975)
101.
w3x E. Snoeks, G.N. van den Hoven, A. Polman, B. Hendriksen,
M.B.J. Diemeer, F. Priolo, J. Opt. Soc. Am. B 12(1997) 1468. w4x P. Blixt, J. Nilsson, T. Carlnas, B. Jaskorzynska, IEEE Photon.
Technol. Lett. 2(1991) 3.
w5x B.T. Stone, K.L. Bray, J. Non-Cryst. Solids 197(1996) 136. w6x H. Nii, K. Ozaki, M. Herren, M. Morita, J. Lumin. 76–77
(1998) 116.
w7x H.T. Amorim, M.T. de Araujo, E.A. Gouveia, A.S.
Gouveia-Neto, J.A.M. Gouveia-Neto, A.S.B. Sombra, J. Lumin. 78(1998) 271. w8x C. Urlacher, J. Mugnier, J. Raman Spectrosc. 27(1996) 785. w9x A. Bahtat, M. Bouazaoui, M. Bahtat, J. Mugnier, Opt.
Com-mun. 111(1994) 55.
w10x A. Bahtat, M. Bouderbala, M. Bahtat, M. Bouazaoui, J.
Mugnier, M. Druetta, Thin Solid Films 323(1998) 59. w11x C.C. Ting, S.Y. Chen, W.-F. Hsieh, H.-Y. Lee, J. Appl. Phys.
90(2001) 5564.
w12x A.F. Obaton, C. Labbe, P.L. Boulanger, B. Elouadi, G. Boulon,´ Spectro. Acta A 55(1999) 263.
w13x C.B. Layne, W.H. Lowdermilk, M.J. Weber, Phys. Rev. B 16 (1997) 10.
w14x Y. Mita, T. Ide, M. Togashi, H. Yamamoto, J. Appl. Phys. 85 (1999) 4160.
w15x H. Ennen, J. Schneider, G. Pomrenke, A. Axmann, Appl. Phys.
Lett. 43(1983) 943.
w16x H. Ennen, G. Pomrenke, A. Axmann, K. Eisele, W. Haydl, J.
Schneider, Appl. Phys. Lett. 46(1985) 381.
w17x A. Bahtat, M. Bouazaoui, M. Bahtat, C. Garapon, B. Jcaquier,
J. Mugnier, J. Non-Cryst. Solids 202(1996) 16.
w18x M.A. Subramanian, G. Aravamudan, G.V. Subba Rao, Prog.
Solid St. Chem. 15(1983) 55.
w19x E. Maurice, G. Monnom, B. Dussardier, D.B. Ostrowsky, J.
Opt. Soc. Am. B13(1996) 693.
w20x J.L. Jackel, A.Y. Yan, E.M. Vagel, A.V. Lehmen, J.J. Johnson,
E. Snitzer, Appl. Opt. 31(1992) 3390.
w21x N. Jaba, A. Kanoun, H. Mejri, S. Alaya, H. Maaref, J. Phys.:
Condens. Matter. 12(2000) 4523.
w22x S. Tanabe, S. Yoshii, K. Hirao, N. Soga, Phys. Rev. B45 (1992) 4620.
w23x N. Floquet, O. Bertrand, J.J. Heizmann, Oxidation Met. 37 (1992) 253.
w24x M.P. Hehlen, G. Frei, H.U. Gudel, Phys. Rev. B50¨ (1994)
16264.
w25x F. Goutaland, Y. Querdane, A. Boukenter, G. Monnom, J.
Alloys Compd. 275–277(1998) 276.
w26x N. Jaba, A. Kanoun, H. Mejri, S. Alaya, H. Maaref, J. Phys.: