Article Categories: original articles 1
Medical Expenditure and satisfaction of family between hospice care and general care 2
in terminal cancer patients in Taiwan 3
Wen-Yuan Lin MD, MS1,6,9, Tai-Yuan Chiu MD, MS5, Hua-Shai Hsu MD1, Lance E. 4
Davidson, PhD9
, Tsann Lin MD, PhD1,6, Kao-Chi Cheng MD1, Chang-Fang Chiu MD, PhD2, 5
Chia-Ing Li MPH3, Yi-Wen Chiu RN, MS4, Cheng-Chieh Lin MD, PhD1,6,7,8, Chiu-Shong Liu 6
MD, MS1,6 7
1
Department of Family Medicine, 2Division of Hematology/Oncology, Department of 8
Internal Medicine, 3Department of Medical Research, and 4Preventive Medicine Center, China
9
Medical University Hospital, Taichung, Taiwan; 5Department of Family Medicine, National 10
Taiwan University Hospital, Taipei, Taiwan; 6Department of Family Medicine, College of 11
Medicine, and 7School and Graduate Institute of Health Care Administration, College of Public
12
Health, China Medical University, Taichung, Taiwan; 8Institute of Health Care Administration,
13
College of Health Science, Asia University, Taichung, Taiwan; 9St. Luke’s-Roosevelt Hospital,
14
Columbia University, New York, New York.
15
Short running title: Medical Expenditure and family satisfaction in hospice care
16
Disclosure of Conflicts of Interest 17
I certify that all my affiliations with or financial involvement in, within the past 5 years and 18
foreseeable future, any organization or entity with a financial interest in or financial conflict 19
with the subject matter or materials discussed in the manuscript are completely disclosed. 1
2
1,6
Correspondence and reprint request to: 3
Chiu-Shong Liu MD, MS 4
Department of Family Medicine, China Medical University Hospital, 5
2, Yuh-Der Road, Taichung, Taiwan 404 6
Tel: +886-4-22052121 ext 4507, Fax: +886-4-22361803, 7
E-Mail: [email protected] 8
ABSTRACT 1
Background/Purpose: As the increasing number of terminal cancer patients, several care 2
models had been adopted to provide better care quality as well as less medical expenditure. 3
This study assessed the inpatient medical expenditure and family satisfaction between 4
hospice ward (HW) and general ward (GW) in terminal cancer patients in Taiwan. 5
Methods: Terminal cancer patients who were admitted and died during the same admission 6
period in a tertiary care hospital were collected from Jan. 2003 to Dec. 2005 in Taiwan. These 7
patients were allocated into three groups, including inpatient care in HW alone, inpatient care 8
in GW alone, and inpatient care in mixed group (initially in GW, then transferred to HW). 9
Inpatient medical expenditure and family satisfaction were assessed among groups. 10
Results: A total of 1942 patients were recruited and allocated into GW (n=1511), mixed 11
(n=139), and HW (n=292) groups. The average medical expenditures either per person or per 12
inpatient day were lower in the HW group than GW or mixed groups. Subjects who had ever 13
been admitted to the intensive care unit or received cardio-pulmonary resuscitation in the GW 14
or mixed groups spent more on medical care than the HW group. Daily medical expenditure 15
in the HW group was also much lower than the GW and mixed group based on length of stay 16
and cancer type. The family satisfaction score was significantly higher in the mixed and/or 17
HW group than the GW group. 18
Conclusion: In terminal cancer patients, hospice care may improve family satisfaction while 19
reducing medical expenditure in Taiwan. 1
Keywords: hospice care, general care, expenditure, satisfaction, Taiwan 2
Introduction 1
The global incidence of cancer has risen dramatically in past decades (1). In Taiwan, 2
cancer deaths have also sharply increased and become the leading cause of death since 1982 3
(2). In 2007 alone, 40,306 (28.9 % of total deaths) Taiwanese died of cancer (2). Although 4
many new medical technologies and anti-cancer medications have been developed to fight 5
cancers, most of cancer patients are incurable, and clinical signs and symptoms worsen in 6
terminal stages (3). Although survival prediction in early stages of cancer is difficult, accurate 7
predictions are possible in later stages (4). Palliative care can effectively alleviate more than 8
ten symptoms from which terminal patients suffer (3, 5, 6). In 1967, Dr. Saunders in the 9
United Kingdom established modern hospice palliative medicine, which provided holistic 10
care for terminal patients. The goals of hospice palliative care were to improve the quality of 11
life and offer dignity of death in both terminal patients and their families. Many studies had 12
demonstrated that hospice palliative care is one of the best care models for terminal patients 13
(5, 6). In Taiwan, hospice palliative care was introduced in 1990 and the use of this care 14
model has rapidly increased (7). The benefit of hospice palliative care for terminal patients 15
had been shown by many studies. For example, Miceli et al. reported that terminal patients 16
receiving hospice care had higher family satisfaction than did usual care (8). Pyenson and 17
colleagues also showed that terminal patients who received hospice care had longer time until 18
death time than those who received non-hospice care (9). 19
Medical expenditures for terminal patients during the end-of-life period are vast (10). Barnato 1
et al. determined that 30% of medical expenditures are spent by 5% of beneficiaries who die 2
within the year (11). Other researchers have also shown that terminal patients spend more on 3
medical care and have longer inpatient stays before death (12, 13). Spector et al. reported that 4
medical expenditures increase markedly near time of death in terminal patients (13). Hospice 5
palliative care has demonstrated reduced medical expenditures in terminally ill patients 6
compared to usual care (7, 9, 14-16). For example, Pyenson et al. reported that mean and 7
median Medicare expenditures were lower for patients enrolled in hospice care than 8
non-hospice care (9). The lower medical expenditure was not associated with shorter survival 9
time, but appeared to be related to a longer mean time until death (9). A study conducted by 10
Lo in Taiwan also showed that hospice care had less medical expenditure than usual care in 11
terminal patients (7). The rate of hospice utilization during the last year of life increased 12
rapidly from 5.5% to 15.4% between 2000 and 2004 in Taiwan. These terminal cancer 13
patients were enrolled into hospice care close to death (median time till death time ranged 14
from 14 to 47 days) (17). An important question to ask is whether families of end-of-life 15
patients are satisfied with this emerging method of care, despite the associated reduction in 16
medical expenditure. Few studies had analyzed medical expenditures and family satisfaction 17
simultaneously when comparing hospice care and general care. In this study, we assessed the 18
medical expenditures and family satisfaction among different care models in terminal cancer 19
patients in a tertiary medical center which provided both acute care and hospice care in 1
Taiwan. 2
Subjects and Methods 1
Participants and Characterizations 2
Terminal cancer patients who were admitted to a tertiary medical center located in 3
mid-Taiwan and who died during this hospitalization period at the same center were included 4
from the beginning of 2003 to the end of 2005. These subjects were allocated into three 5
groups: (1) General ward (GW) group: admitted to general ward and received general care till 6
death; (2) Hospice ward (HW) group: admitted to hospice ward in the beginning and received 7
hospice palliative care till death; (3) Mixed ward (mixed) group: admitted to general ward in 8
the beginning and were transferred to hospice ward in the same hospitalized period, then died 9
in the hospice ward. Death coding and diagnosis of cancer for all subjects were performed at 10
the same medical center. There were 1511, 292,139 subjects in GW, HW, and mixed groups, 11
respectively. 12
Medical Expenditure analyses 13
Actual medical expenditures were obtained from the same medical center. These medical 14
expenditures were divided into 16 subgroups according to the national insurance of Taiwan, 15
including fees for diagnosis, laboratory, X-ray, therapeutic procedures, rehabilitation, special 16
materials, psychiatric treatment, injection services, drugs, dispensing services, ward, tube 17
feeding, surgery, anesthesia, hemodialysis, and blood/plasma. For comparison, we re-grouped 18
these 16 fees into 6 domains: (1) Diagnosis fees, (2) Laboratory/X-ray fees, (3) Therapeutic 19
fees (therapeutic procedures, rehabilitation, special materials, psychiatric treatment, injection 1
services), (4) Drug fees (drugs, dispensing services), (5) Ward fees (ward, tube feeding), (6) 2
Others (surgery, hemodialysis, blood/plasma). All medical expenditures are presented in US 3
dollars. 4
Questionnaires for family satisfaction 5
Few measurement scales have been developed for the satisfaction of family caregivers in 6
terminal cancer patients. We could not find a family satisfaction questionnaire translated and 7
appropriate to Chinese culture. Therefore, a group of researchers in the fields of hospice 8
palliative medicine, nursing, and health behavior participated in the work of a review of 9
relevant literature and compiled 40 questions assessing family satisfaction. In brief, we 10
designed the questionnaire from two major fields, one from three domains: physiological, 11
psycho-social, and spiritual aspects; the other from knowledge, attitude, and skill. Also, we 12
added the equipment of the ward and overall domain into the original questionnaire. Five 13
experts, including a medical doctor, social worker, senior nurse, project manager, and 14
chaplain in the field of hospice palliative medicine, were asked to comment twice on the 15
content of initial pool items and rate the clarity, concreteness, centrality and importance of 16
each item using a 5-point rating scale (e.g. 1=not important, 5=very important). The content 17
validity index (CVI) of each item was calculated based on the experts’ ratings and items were 18
considered adequate if agreement was 80% or greater between experts. A similar CVI has 19
been used in many studies (18). 1
Based on the results of the content validation, 30 items were retained from the initial item 2
pool using a 5-point scale: 1 (strongly dissatisfied), 2 (dissatisfied), 3 (neither satisfied nor 3
dissatisfied), 4 (satisfied), and 5 (strongly satisfied). The final composition of the 4
questionnaire was as follows: physiological (6 items), psycho-social (8 items), and spiritual 5
domain (8 items). Another classified method was as follows: knowledge (8 items), attitude (6 6
items), and skill (8 items). The equipment and overall domains had 3 and 5 items, 7
respectively. The rating scores were summated by sub-scales. The higher the score on a 8
sub-scale, the better the rating of family satisfaction. A total of 1942 families were invited to 9
fill out the questionnaires, and 332 families returned completed questionnaires. The overall 10
response rate was 17.1%. The response rate among GW, mixed, and HW groups was 219 11
(14.5%), 31 (22.3%), and 82 (28.1%), respectively. Reasons for non-response to our 12
questionnaire included refusal (n=279, 14.4%), incorrect contact information (wrong 13
telephone number and/or address; n=489, 25.2%), no answer on phone call attempts during 3 14
different periods (in the morning, in the afternoon, and at night; n=483, 24.9%), families lost 15
the questionnaire and were sent another but failed to reply within 3 months (n=332, 17.1%), 16
and emotional disturbance (grief-related or otherwise; n=27, 1.4%). 17
Statistical analysis 18
Descriptive statistics were used to characterize the demographic, medical expenditure, and 19
family satisfaction data. The data are presented as means and SD unless otherwise indicated. 1
Chi-square test was used to test significant differences for categorical data among three care 2
groups. Student’s t test and analysis of variance (ANOVA) were used to test significant 3
differences for continuous data on contrasting groups. Post Hoc comparisons between groups 4
were done using the Scheffe test. All statistical tests were 2-sided at the 0.05 significance 5
level. These statistical analyses were performed using the PC version of SPSS statistical 6
software (13th version, SPSS Inc., Chicago, IL, USA). 7
Ethics approval was obtained from the Institutional Review Board of the China Medical 8
University Hospital. 9
Results 1
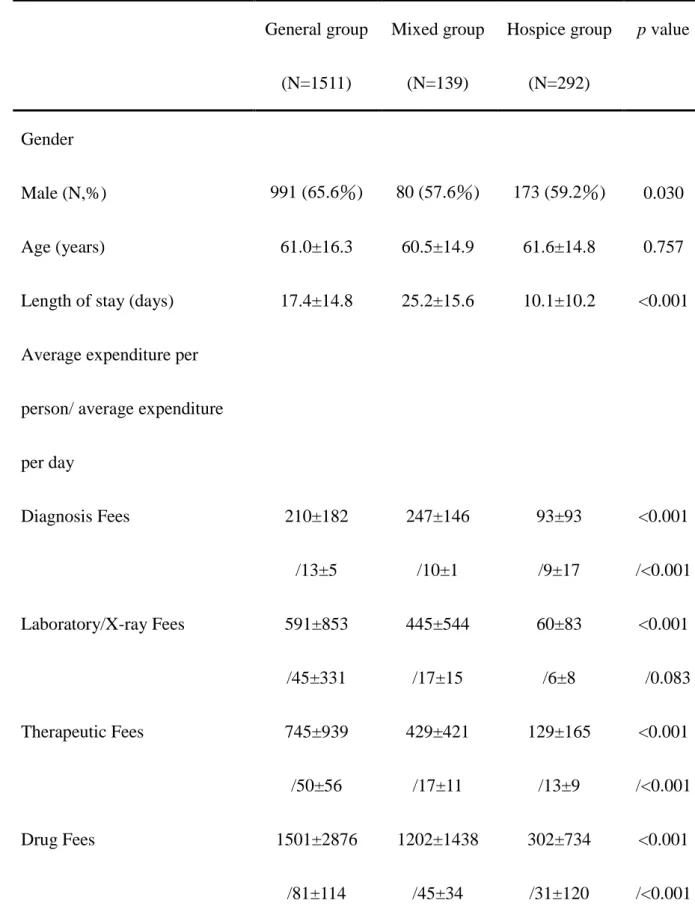
A total of 1,942 patients were recruited and allocated into GW (n=1,511, men=991), mixed 2
(n=139; men=80), and HW (n=292; men=173) groups, respectively. The mean age was 61.0, 3
60.5, and 61.6 years old among GW, mixed, and HW groups. The length of stay (admission 4
duration until death time) was 17.4, 25.2, and 10.1 days among GW, mixed, and HW groups, 5
respectively. Liver cancer (19.5%), lung cancer (17.5%), oral/pharyngeal cancer (10.2%), 6
hematological malignancy (8.3%), and colon-rectal cancer (7.7%) were the top five cancer 7
types among these groups. The total average expenditures in each inpatient day were 284, 8
135, and 102 US dollars among GW, mixed, and HW groups, respectively (Table 1). The 9
average total expenditure per person was 4,602, 3,496, and 1,092 US dollars among GW, 10
mixed, and HW groups, respectively (Table 1). The average medical expenditure per person 11
and per inpatient day was lowest in the HW group compared to the mixed and GW groups, 12
and a similar relationship was found for almost all expenditure subgroups (Table 1). We 13
further divided HW, mixed, and GW into subgroups that identified whether they were 14
admitted to intensive care unit (ICU) or not (admitted to ICU in GW and mixed group: 15
GW-ICU (+) and mixed-ICU (+); not admitted to ICU in GW and mixed group: GW-ICU (-) 16
and mixed-ICU (-); all subjects in HW group weren’t admitted to ICU) and received 17
cardiopulmonary resuscitation (CPR) or not (received CPR in GW group: GW-CPR (+); not 18
received CPR in GW group: GW-CPR (-); subjects in both mixed and HW group did not 19
receive CPR). We found that subjects in the GW-ICU (+) had the highest average daily 1
medical expenditures. The HW group had lowest average daily medical expenditures, even 2
when compared to GW-ICU (-) and mixed-ICU (-) subgroups. The average daily medical 3
expenditures were 509 US dollars in GW-ICU (+), 232 US dollars in GW-ICU (-), 156 US 4
dollars in mixed-ICU (+), 134 US dollars in mixed-ICU (-), and 102 US dollars in the HW 5
group. Total medical expenditures for each inpatient day were 647 US dollars in GW-CPR 6
(+), 261 US dollars in GW-CPR (-), 135 US dollars in the mixed group, and 102 US dollars 7
in the HW group. Subjects in the HW group still had lower daily average medical 8
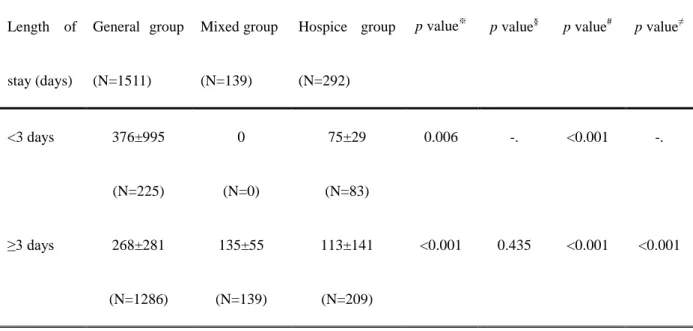
expenditures than other subgroups. Since previous studies found that medical expenditures 9
increase markedly near time of death in terminal patients, we further analyzed average daily 10
medical expenditures according to the length of stay in table 2. We found that the HW group 11
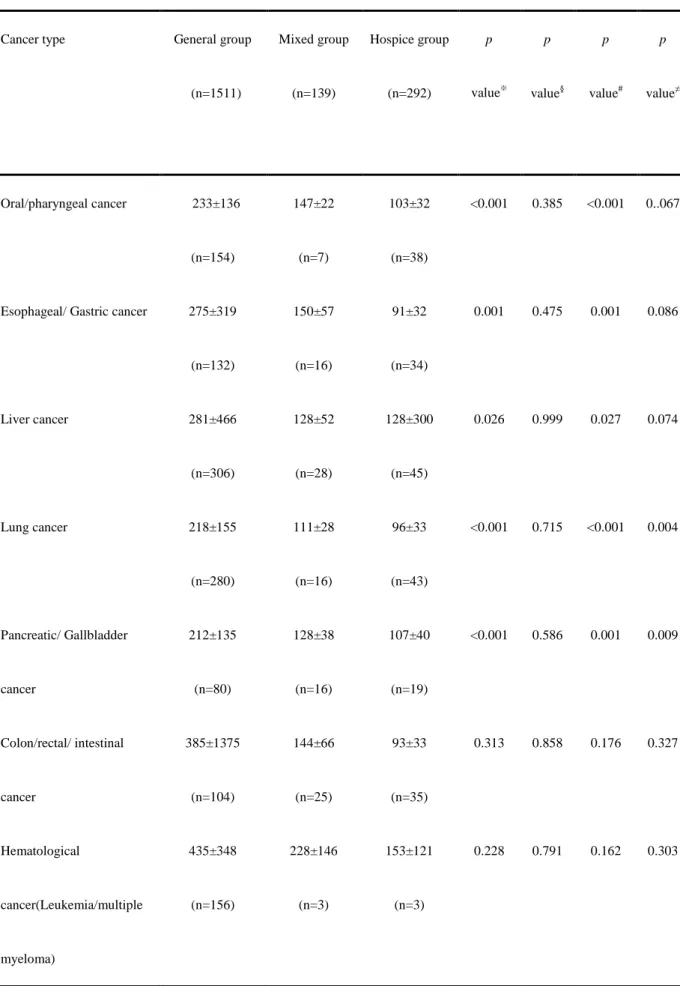
had the lowest average daily medical expenditures for each length of stay (Table 2). In table 3, 12
we showed average daily medical expenditures according to cancer types. The HW group had 13
lower mean daily total expenditures than the other groups; however, no further 14
between-group differences were found within specific diagnoses such as brain cancer, gastric 15
cancer, intestinal cancer, colon/rectal/intestinal cancer, hematological malignancy, renal 16
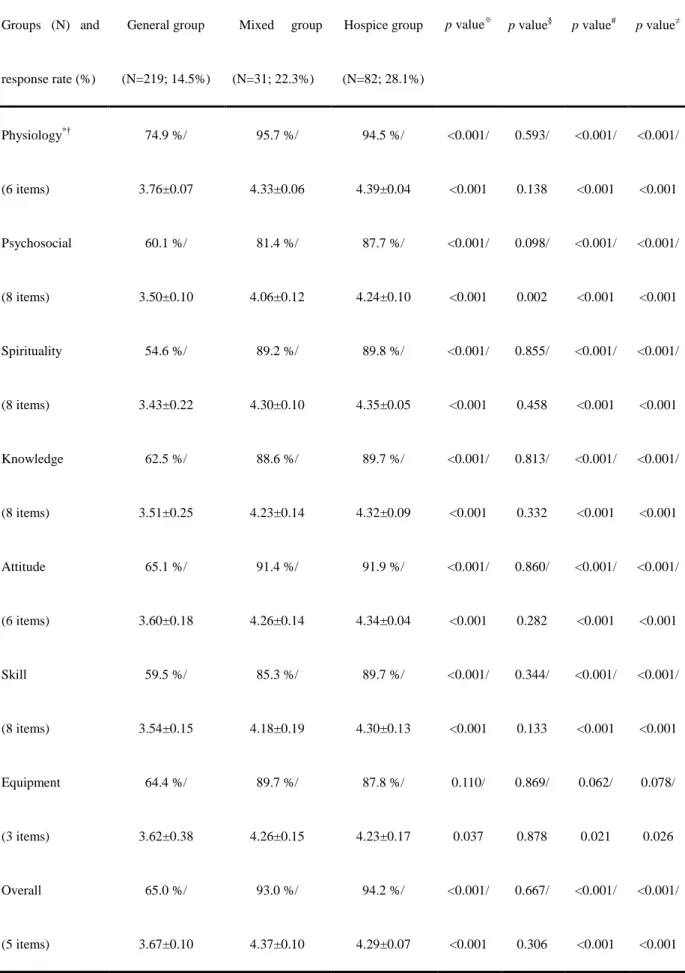
cancer, prostate cancer, and original unknown cancer (Table 3). In table 4, family satisfaction 17
is presented across groups in different domains. We found that subjects who had ever 18
received hospice palliative care (mixed and HW groups) had higher family satisfaction (grand 19
total) than subjects in the GW group. The overall (30 items) score of family satisfaction was 1
62.9%, 89.1%, and 90.7% among GW, mixed, and HW groups, respectively (Table 4). The 2
mixed and HW groups had a higher mean satisfaction score than the GW group in all 3
domains (Table 4). There were no statistical differences between scores of the mixed and HW 4
groups within each domain or for the grand total family satisfaction score. 5
Discussion 1
The results of this study demonstrate that patients who rely solely on hospice palliative 2
care spend substantially less than general ward patients or than those who transition from 3
general ward to hospice care. The marked differences in medical expenditures between 4
hospice and general ward care extended to most cancer types. In addition to the fiscal 5
differences between these end-of-life treatment options, family of patients who had received 6
any form of hospice palliative care report higher satisfaction than family of patients in 7
general hospital wards. 8
Hospice care saved 182 US dollars in medical expenditures per inpatient day by 9
comparison to general ward care. Compared with the medical expenditure in the HW group, 10
terminal cancer patients who had ever been admitted to ICU in the GW group spent an extra 11
407 US dollars per average inpatient day. Each patient in the HW group saved 545 US dollars 12
per inpatient day than those who had received CPR treatment in the GW group. Previous 13
studies have reported that medical expenditures increase more rapidly as death approaches, 14
and that hospice care could save more on medical expenditures than general care (7, 14). In 15
this study, we found that the largest savings of average daily medical expenditures between 16
general care and hospice care appeared in subjects who died within 3 days after admission. 17
The saved medical expenditure in each inpatient day was 301 US dollars (Table 2). In 18
agreement with previous studies, our results demonstrate that the average daily medical 19
expenditures increased while death was approaching (Table 2). In the GW group, patients 1
who died within 3 days after admission (< 3 days) spent 112 US dollars more per day than 2
those who died over 28 days after admission (≥ 28 days). However, patients in the HW group 3
who died within 3 days after admission (<3 days) had the least average daily medical 4
expenditures. One possible reason for this difference may be that in contrast to the GW group, 5
obvious dying signs in the HW patients precluded aggressive treatments to sustain life (such 6
as CPR etc.). Rather, medical faculty focused more aggressively on increasing quality of life 7
and dignity of death for patients and families during this period. Because family satisfaction 8
was higher in the HW and mixed group than GW group, it is reasonable to propose that 9
hospice palliative care is a more appropriate care model than usual care during this period. 10
Previous studies have shown that hospice care provided high levels of family satisfaction 11
(19-21). For example, Miceli and colleagues reported higher family satisfaction under 12
hospice care than under the care of a personal physician (8). In agreement with Miceli’s study, 13
we also found that patients who had ever received hospice care (either mixed or HW group) 14
had higher family satisfaction than patients who received general care. In the HW model in 15
Taiwan and in most other countries, care is provided by a well-trained team which includes 16
hospice palliative specialists, nurses, social workers, chaplains, volunteers, and other workers. 17
Most of terminal cancer patients were transferred to a hospice ward from original oncologists 18
or anti-cancer physicians whose primary responsibility was to cure cancer. Our results 19
demonstrate that continuity of care from the original anti-cancer team is not the major factor 1
influencing good family satisfaction. Moreover, the well-trained hospice team was a key 2
point of satisfaction for both family and patients. 3
That family satisfaction did not differ between the mixed and HW groups, yet still was 4
greater than the GW group, could suggest that either full or partial reliance on hospice 5
palliative care may be beneficial compared to general ward care. Hospice palliative care is 6
likely not the only factor explaining the differences in family satisfaction between the mixed 7
and HW groups, however. For example, the goal of aggressiveness of care may differ 8
between groups, especially if a do-not-resuscitate order exists. The understood goals of 9
medical therapy are to prolong life, increase quality of life, and respect dignity of patients. 10
For the treatment of terminal cancer patients, the goals lean more toward the latter two in 11
hospice palliative care than usual care, but are targeted no less aggressively. The potential 12
effects of these and other confounding variables may explain some of the differences between 13
the three groups studied, and merit further work in this area. 14
There are some limitations to this study. First, the response rate in family satisfaction 15
questionnaire was low, and may reduce the applicability of the findings. One possible 16
explanation for this lack of response might be the inherently difficult timing of the 17
questionnaire for the family (at time of death and during the grieving process). Second, the 18
admission period of this study only focused on the last admission before death, not medical 19
expenditures for the entire terminal stage. Within the duration of last admission, however, 1
average daily medical expenditure was lowest in the HW group, regardless of length of stay. 2
Third, the family satisfaction questionnaire was only assessed for content validity (not 3
predictive, concurrent, construct, or incremental validity) before being used in the study. 4
However, a previous study demonstrated that content validity was a reliable way to design a 5
questionnaire for use in clinical studies (16). Until further validation is completed on this 6
questionnaire, we rely solely on the opinion of our expert panel to determine the ability of 7
this questionnaire to reflect the thinking of these terminal patients’ families. Finally, although 8
the recall bias associated with questionnaire-based research cannot be ruled out in this study, 9
the timing of questionnaire administration was not different between groups and thus would 10
not be expected to affect the study outcomes. 11
In summary, we demonstrated that hospice care not only saved medical expenditures but 12
was associated with higher family satisfaction than general care. The enrollment of hospice 13
care for terminal cancer patients should be encouraged in order to increase family satisfaction 14
and reduce medical expenditure in Taiwan and in other countries. 15
Acknowledgement 16
We thank Miss Mei-Ching Huang for her assistance collecting and managing the study data. 17
References 1
1 J.Ferlay, F.Bray, P.Pisani, et al. GLOBOCAN 2000: Cancer Incidence, Mortality and 2
Prevalence Worldwide. IARC CancerBase No 5. Lyon, IARCPress 2001. 3
2 Department of Health, Executive Yuan, Taiwan. 2007 Statistics of causes of death. 4
Http://www.doh.gov.tw/EN2006/DM/DM2_p01.aspx?class_no=390&now_fod_list_no=1042 5
2&level_no=2&doc_no=70151.2009; Accessed at April, 28, 2009. 6
3 Tsai JS, Wu CH, Chiu TY, et al. Symptom patterns of advanced cancer patients in a 7
palliative care unit. Palliat Med 2006;20:617-22. 8
4 Scitovsky AA. "The high cost of dying" revisited. Milbank Q 1994;72:561-91. 9
5 Jocham HR, Dassen T, Widdershoven G, et al. Quality of life in palliative care cancer 10
patients: a literature review. J Clin Nurs 2006;15:1188-95. 11
6 Paice JA, Muir JC, Shott S. Palliative care at the end of life: comparing quality in 12
diverse settings. Am J Hosp Palliat Care 2004;21:19-27. 13
7 Lo JC. The impact of hospices on health care expenditures--the case of Taiwan. Soc Sci 14
Med 2002;54:981-91. 15
8 Miceli PJ, Mylod DE. Satisfaction of families using end-of-life care: current successes 16
and challenges in the hospice industry. Am J Hosp Palliat Care 2003;20:360-70. 17
9 Pyenson B, Connor S, Fitch K, et al. Medicare cost in matched hospice and non-hospice 18
cohorts. J Pain Symptom Manage 2004;28:200-10. 19
10 Polinder S, Homs MY, Siersema PD, et al. Cost study of metal stent placement vs 1
single-dose brachytherapy in the palliative treatment of oesophageal cancer. Br J Cancer 2
2004;90:2067-72. 3
11 Barnato AE, McClellan MB, Kagay CR, et al. Trends in inpatient treatment intensity 4
among Medicare beneficiaries at the end of life. Health Serv Res. 2004;39:363-75. 5
12 Shapiro E. Impending death and the use of hospitals by the elderly. J Am Geriatr Soc 6
1983;31:348-51. 7
13 Spector WD, Mor V. Utilization and charges for terminal cancer patients in Rhode Island. 8
Inquiry 1984;21:328-37. 9
14 Penrod JD, Deb P, Luhrs C, et al. Cost and utilization outcomes of patients receiving 10
hospital-based palliative care consultation. J Palliat Med 2006;9:855-60. 11
15 Campbell DE, Lynn J, Louis TA, et al. Medicare program expenditures associated with 12
hospice use. Ann Intern Med 2004;140:269-77. 13
16 Morrison RS, Penrod JD, Cassel JB, et al. Cost savings associated with US hospital 14
palliative care consultation programs. Arch Intern Med 2008;168:1783-90. 15
17 Tang ST, Chen ML, Huang EW, et al. Hospice utilization in Taiwan by cancer patients 16
who died between 2000 and 2004. J Pain Symptom Manage 2007;33:446-53. 17
18 Hyrkas K, Appelqvist-Schmidlechner K, Oksa L. Validating an instrument for clinical 18
supervision using an expert panel. Int J Nurs Stud 2003;40:619-25. 19
19 Miceli PJ, Wojciechowski SL. Impacting family satisfaction with hospice care. Caring 1
2003;22:14-8. 2
20 Steele LL, Mills B, Long MR, et al. Patient and caregiver satisfaction with end-of-life 3
care: does high satisfaction mean high quality of care? Am J Hosp Palliat Care 4
2002;19:19-27. 5
21 Wilkinson EK, Salisbury C, Bosanquet N, et al. Patient and carer preference for, and 6
satisfaction with, specialist models of palliative care: a systematic literature review. Palliat 7 Med 1999;13:197-216. 8 9 10 11 12 13 14 15 16 17 18 19
Table 1. Basic data and average medical expenditure per person or per inpatient day among 1 groups 2 General group (N=1511) Mixed group (N=139) Hospice group (N=292) p value Gender Male (N,%) 991 (65.6%) 80 (57.6%) 173 (59.2%) 0.030 Age (years) 61.0±16.3 60.5±14.9 61.6±14.8 0.757
Length of stay (days) 17.4±14.8 25.2±15.6 10.1±10.2 <0.001
Average expenditure per
person/ average expenditure
per day Diagnosis Fees 210±182 /13±5 247±146 /10±1 93±93 /9±17 <0.001 /<0.001 Laboratory/X-ray Fees 591±853 /45±331 445±544 /17±15 60±83 /6±8 <0.001 /0.083 Therapeutic Fees 745±939 /50±56 429±421 /17±11 129±165 /13±9 <0.001 /<0.001 Drug Fees 1501±2876 /81±114 1202±1438 /45±34 302±734 /31±120 <0.001 /<0.001
Ward Fees 1084±1269 /63±51 923±608 /36±12 336±383 /29±6 <0.001 /<0.001 Others 557±1261 /40±137 256±558 /9±17 27±87 /3±9 <0.001 /<0.001 Grand Total 4602±5997 /284±465 3496±2819 /135±55 1092±1401 /102±122 <0.001 /<0.001
*: ANOVA test was used for comparing mean values of continuous variables between groups; 1
Medical expenditure unit: presented in US dollars.
Table 2. The average daily medical expenditure among groups based on length of stay 1 Length of stay (days) General group (N=1511) Mixed group (N=139) Hospice group (N=292)
p value※ p value§ p value# p value≠
<3 days 376±995 (N=225) 0 (N=0) 75±29 (N=83) 0.006 -. <0.001 -. ≥3 days 268±281 (N=1286) 135±55 (N=139) 113±141 (N=209) <0.001 0.435 <0.001 <0.001 <7 days 333±772 (N=484) 118±31 (N=8) 98±168 (N=146) 0.001 0.936 <0.001 0.373 ≥7 days 260±189 (N=1027) 136±56 (N=131) 106±37 (N=146) <0.001 0.143 <0.001 <0.001 <14 days 304±613 (N=802) 118±40 (N=34) 100±139 (N=219) <0.001 0.856 <0.001 0.049 ≥14 days 260±185 (N=709) 140±58 (N=105) 108±41 (N=73) <0.001 0.204 <0.001 <0.001 <28 days 288±507 134±57 101±126 <0.001 0.544 <0.001 0.002
(N=1220) (N=91) (N=271) ≥28 days 264±206 (N=291) 136±51 (N=48) 113±53 (N=21) <0.001 0.638 <0.001 <0.001 ※
: ANOVA test was used for comparing mean values of continuous variables between groups; 1
§
: Post Hoc comparison between hospice group and mixed group using LSD test 2
#
: Post Hoc comparison between hospice group and general group using LSD test 3
≠
: Post Hoc comparison between mixed group and general group using LSD test 4
Table 3. The average daily medical expenditure among groups based on different cancer types 1
Cancer type General group
(n=1511) Mixed group (n=139) Hospice group (n=292) p value※ p value§ p value# p value≠ Oral/pharyngeal cancer 233±136 (n=154) 147±22 (n=7) 103±32 (n=38) <0.001 0.385 <0.001 0..067
Esophageal/ Gastric cancer 275±319
(n=132) 150±57 (n=16) 91±32 (n=34) 0.001 0.475 0.001 0.086 Liver cancer 281±466 (n=306) 128±52 (n=28) 128±300 (n=45) 0.026 0.999 0.027 0.074 Lung cancer 218±155 (n=280) 111±28 (n=16) 96±33 (n=43) <0.001 0.715 <0.001 0.004 Pancreatic/ Gallbladder cancer 212±135 (n=80) 128±38 (n=16) 107±40 (n=19) <0.001 0.586 0.001 0.009 Colon/rectal/ intestinal cancer 385±1375 (n=104) 144±66 (n=25) 93±33 (n=35) 0.313 0.858 0.176 0.327 Hematological cancer(Leukemia/multiple myeloma) 435±348 (n=156) 228±146 (n=3) 153±121 (n=3) 0.228 0.791 0.162 0.303
Urinary bladder/ renal/ prostate cancer 247±145 (n=46) 117±36 (n=6) 93±30 (n=13) <0.001 0.699 <0.001 0.019 Breast cancer 265±271 (n=69) 90±25 (n=7) 88±35 (n=22) 0.004 0.987 0.002 0.059 Ovarian/Cervical/ endometric cancer 268±164 (n=39) 146±35 (n=13) 93±32 (n=25) <0.001 0.202 <0.001 0.002 Other cancers 306±237 (n=145) 173±130 (n=2) 109±43 (n=15) 0.005 0.708 0.002 0.410 ※
: ANOVA test was used for comparing mean values of continuous variables between groups; 1
§
: Post Hoc comparison between hospice group and mixed group using LSD test 2
#
: Post Hoc comparison between hospice group and general group using LSD test 3
≠
: Post Hoc comparison between mixed group and general group using LSD test 4
Table 4. Analysis of family satisfaction according to different domains 1 Groups (N) and response rate (%) General group (N=219; 14.5%) Mixed group (N=31; 22.3%) Hospice group (N=82; 28.1%)
p value※ p value§ p value# p value≠
Physiology*† (6 items) 74.9 %/ 3.76±0.07 95.7 %/ 4.33±0.06 94.5 %/ 4.39±0.04 <0.001/ <0.001 0.593/ 0.138 <0.001/ <0.001 <0.001/ <0.001 Psychosocial (8 items) 60.1 %/ 3.50±0.10 81.4 %/ 4.06±0.12 87.7 %/ 4.24±0.10 <0.001/ <0.001 0.098/ 0.002 <0.001/ <0.001 <0.001/ <0.001 Spirituality (8 items) 54.6 %/ 3.43±0.22 89.2 %/ 4.30±0.10 89.8 %/ 4.35±0.05 <0.001/ <0.001 0.855/ 0.458 <0.001/ <0.001 <0.001/ <0.001 Knowledge (8 items) 62.5 %/ 3.51±0.25 88.6 %/ 4.23±0.14 89.7 %/ 4.32±0.09 <0.001/ <0.001 0.813/ 0.332 <0.001/ <0.001 <0.001/ <0.001 Attitude (6 items) 65.1 %/ 3.60±0.18 91.4 %/ 4.26±0.14 91.9 %/ 4.34±0.04 <0.001/ <0.001 0.860/ 0.282 <0.001/ <0.001 <0.001/ <0.001 Skill (8 items) 59.5 %/ 3.54±0.15 85.3 %/ 4.18±0.19 89.7 %/ 4.30±0.13 <0.001/ <0.001 0.344/ 0.133 <0.001/ <0.001 <0.001/ <0.001 Equipment (3 items) 64.4 %/ 3.62±0.38 89.7 %/ 4.26±0.15 87.8 %/ 4.23±0.17 0.110/ 0.037 0.869/ 0.878 0.062/ 0.021 0.078/ 0.026 Overall (5 items) 65.0 %/ 3.67±0.10 93.0 %/ 4.37±0.10 94.2 %/ 4.29±0.07 <0.001/ <0.001 0.667/ 0.306 <0.001/ <0.001 <0.001/ <0.001
Grand total (30 items) 62.9 %/ 3.57±0.20 89.1 %/ 4.25±0.15 90.7 %/ 4.31±0.10 <0.001/ <0.001 0.447/ 0.114 <0.001/ <0.001 <0.001/ <0.001 *
: Present with percentage: the percentage for families who answered “satisfied” and “strongly 1
satisfied” (scale≥4; a 5-point scale ranging from 1: strongly dissatisfied to 5: strongly 2
satisfied). 3
†
: Present with mean ± SD (a 5-point scale ranging from 1: strongly dissatisfied to 5: strongly 4
satisfied). 5
※
: Chi-square test for categorical data; ANOVA test was used for comparing mean values of 6
continuous variables between groups; 7
§
: Chi-square test and Post Hoc comparison between hospice group and mixed group using 8
LSD test 9
#
: Chi-square test and Post Hoc comparison between hospice group and general group using 10
LSD test 11
≠
: Chi-square test and Post Hoc comparison between mixed group and general group using 12
LSD test 13