National Chiao Tung University
Global MBA Program
College of Management
Master of Business Administration Degree
Thesis
微電網之決策支援模型 – 以應用於台中工業區為例
A Decision Support Model for Microgrids –
An Application to Taichung Industrial Park
Student: Chung-Chuan Chang
Advisor: Prof. Jin-Su Kang
微電網之決策支援模型 – 以應用於台中工業區為例
A Decision Support Model for Microgrids –
An Application to Taichung Industrial Park
研 究 生:張中權
Student: Chung-Chuan Chang
指導教授:姜真秀
Advisor: Jin-Su Kang
國 立 交 通 大 學
管 理 學 院
企 業 管 理 碩 士 學 位 學 程
碩 士 論 文
A Thesis
Submitted to Master Degree Program of Global Business Administration College of Management
National Chiao Tung University In partial Fulfillment of the Requirements
For the Degree of Master
in
Business Administration June 2012
Hsinchu, Taiwan, Republic of China
Chinese Abstract
微電網之決策支援模型 – 以應用於台中工業區為例
學生:張中權
指導教授:姜真秀 博士
巫木誠 博士
姚 遠 博士
國立交通大學企業管理碩士學程
摘 要
近年來,由於社會大眾對環境保護及永續的關注及對更穩定的能源供應系統的需求,結 合了分佈式能源及再生能源之應用的微電網概念逐漸獲得重視。然而,截至目前為止, 微電網所具有的潛在優勢卻尚未能在實際生活中展現出來,這與該系統本身的複雜性及 不確定因素造成的進入門檻頗有關連。在過去,有許多種微電網模型陸續被提出以支援 微電網規劃工作的最佳化;然而,強健最佳化理論及方法卻至今尚未被應用在微電網的 模型建立上以因應消費者能源需求、燃料價格、電價及碳稅稅率等方面的不確定性。本 研究提出一個混合型線性整數規劃(MILP)模型,並採用最壞情況下的成本(經濟性強健 化方法之一)作為本模型多目標函數的最佳化目標之一,以便及早在微電網的早期規劃 設計階段就導入強健最佳化的分析。本模型被設計為可同時進行微電網系統的成本期望 值最小化及最壞情況成本的最小化,而最壞情況成本的最小化即是用來因應系統運作的 各種不同情況之間的差異性。本模型藉由一套完整的數學公式模擬系統運作,從兼顧經 濟、節能及環境保護等觀點為基礎,致力於為一規劃中的微電網系統提供可行的容量設 計建議。此模擬的輸出結果尚包含產生一條描述成本期望值及最壞情況成本之間關係的 帕累托曲線(Pareto curve),該曲線可協助本模型的使用者判斷他們在微電網設計上的風 險控管程度。在本研究中,此一模型被應用於台灣的台中工業區以驗證其作為微電網決 策支援工具的適用性。English Abstract
A Decision Support Model for Microgrids –
An Application to Taichung Industrial Park
Student: Chung-Chuan Chang
Advisors: Dr. Jin-Su Kang
Dr. Muh-Cherng Wu
Dr. Yuan Yao
Global MBA Program
National Chiao Tung University
ABSTRACT
The microgrid concept, which encompasses the application of distributed energy resources and renewable energy, has gained arousing interest in recent years due to the increasing concern on environmental sustainability and demand for a more reliable power supply system from the civil society. So far, the pontential benefits of microgrids have not yet been exploited because of the entry barrier caused by the complexity and uncertainty within the microgrid system. A variety of microgrid models have been presented before to optimize the planning of microgrids; however, robust optimization has not been applied to the modeling of microgrids to deal with uncertainties in customer loads, fuel prices, electricity tariff rate, and carbon tax rate, etc. In this study, a mixed-integer linear programming (MILP) model is proposed to adopt an economic robust measure, worst-case cost, as one of the components in the multi-objective function to allow robust optimization of a planned microgrid as early as in the design stage. The model is designed to simultaneously address the issue of expected cost minimization and worst-case cost minimization, which helps in handling the variation among different scenarios of the system operation. With comprehensive mathematical formulation, the model aims at rendering capacity design recommendations for a microgrid from economic, energy-saving, and environmental perspectives. The results of the simulation include the formation of a Pareto curve between the expected cost and worst-case cost of the project, which enables the model users to judge the degree of their risk-taking on microgrid design. The application of the proposed model to Taichung Industrial Park in Taiwan demonstrates the applicability of the model as a decision support tool for microgrid planning.
Acknowledgement
The author of this Master thesis sincerely thanks his advisor, Professor Jin-Su Kang, for her guidance through this research. She carefully understood the author’s education background and work experience at the beginning and advised the author a possible direction of his research. The modeling of a typical microgrid in this research not only requires basic
knowledge in distributed generation and microgrid-related technologies, but also incorporates the application of economic robust measures in multi-objective optimization. Prof. Kang is a specialist in robust optimization and has long been studying various economic and technical robust measures. She conducted tutorial sessions and explained the principles of robust optimization to the author. She also recommended related papers and helped the author obtain prerequisite knowledge step by step.
During this research, Prof. Kang always knew how to test the author’s microgrid models and was capable of quickly identifying the possible problems within these models. She taught the author how to diagnose the root causes of some problems when difficulties were encountered. She often gave the author valuable suggestions regarding how to improve the modeling and facilitate the problem solving. Without her advice, the research would not have been carried out smoothly and presented with a logical manner.
The author also appreciates the support from Taichung Industrial Park Service Center during his research. The staff of the service center kindly provided relevant data, such as their catalog illustrating the history and current status of Taichung Industrial Park and the latest contracted power capacity (i.e. estimated power demand) of the companies in the park, which were of great importance in this study. Thanks to the assistance of the service center, the simulation of the hypothesized microgrid for Taichung Industrial Park was able to be performed based on realistic on-site conditions.
The work of this study is also partly supported by Central Weather Bureau, Taiwan R.O.C. as it provided detailed local weather data of the Taichung area in the year of 2011. The proposed microgrid model involves the presence of solar energy systems and wind turbines, whose performance deeply depends on local weather conditions. The reference to the real data of the past year enhances the accuracy of the predicted power output from these renewable sources.
Table of Contents
Chinese Abstract ... i
English Abstract ... ii
Acknowledgement ... iii
Table of Contents ... iv
List of Tables ... vi
List of Figures ... vii
List of Appendices ... ix
Symbols ... x
I.
Introduction ... 1
1.1 Background ... 1
1.2 An introduction to microgrids and the related technology ... 1
1.3 The advantages and potential of microgrids ... 3
1.3.1 Advantages of the microgrid system ... 3
1.3.2 History and future potential of microgrid development ... 3
1.4 Objective of the current research ... 4
1.4.1 Development of a decision support model for microgrids ... 4
1.4.2 Scope and position of the current study ... 5
1.5 Framework of the current research ... 5
II.
Literature Review ... 8
2.1 DER system planning approaches ... 8
2.1.1 System planning and design ... 9
2.1.2 Operation plan and scheduling ... 10
2.2 Multi-objective optimization on DER ... 11
2.2.1 Development of multi-objective optimization and decision making... 12
2.2.2 Application of multi-objective optimization ... 13
2.3 Uncertainties in DER and robust optimization on process design ... 13
2.3.1 Prior research regarding uncertainties in DER design... 14
2.3.2 Robust optimization on process design under uncertainties ... 14
2.4 Other researches related to DER and microgrids ... 17
2.4.1 Applicability and classification of microgrids... 17
2.4.2 General studies on renewable energy and DER technologies ... 18
2.4.3 Miscellaneous in literature review ... 18
2.5 Significance of the current study ... 18
2.5.1 Application of robust optimization to microgrid design ... 18
2.5.2 MILP modeling with capacity concern ... 19
III.
Problem Statement ... 21
3.1 Motivation of the current modeling ... 21
3.2 Description of the model structure ... 22
3.3 Pre-settings of the optimization model ... 24
3.3.1 Basic assumptions of the model ... 24
3.3.2 Possible applications of the model ... 25
3.3.3 Summary of the model composition ... 25
IV.
Methodology ... 27
4.1 Positioning of the model ... 27
4.2 Mathematical formulation of the model ... 28
4.2.1 Nomenclature by categories ... 28
4.2.2 Objective function ... 31
4.2.3 Major constraints ... 34
4.2.4 Decision variables... 42
V.
Modeling for Taichung Industrial Park ... 43
5.1 Overview of Taichung Industrial Park ... 44
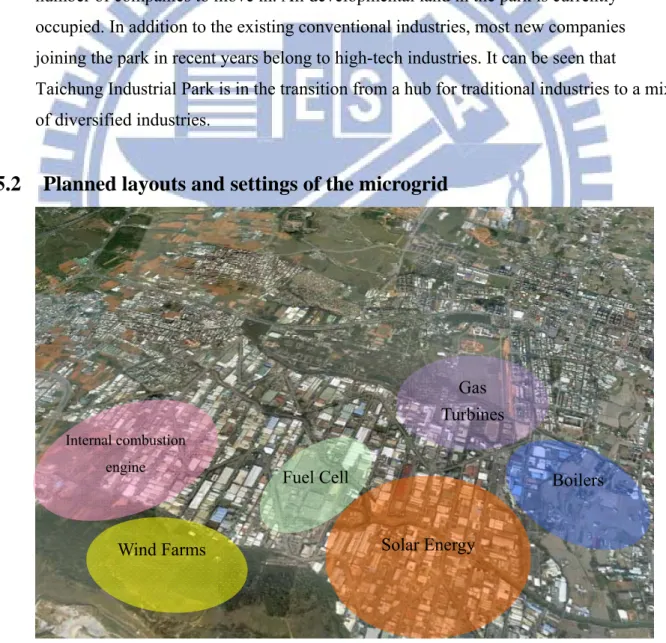
5.2 Planned layouts and settings of the microgrid ... 46
5.3 Scenario construction for robust optimization... 48
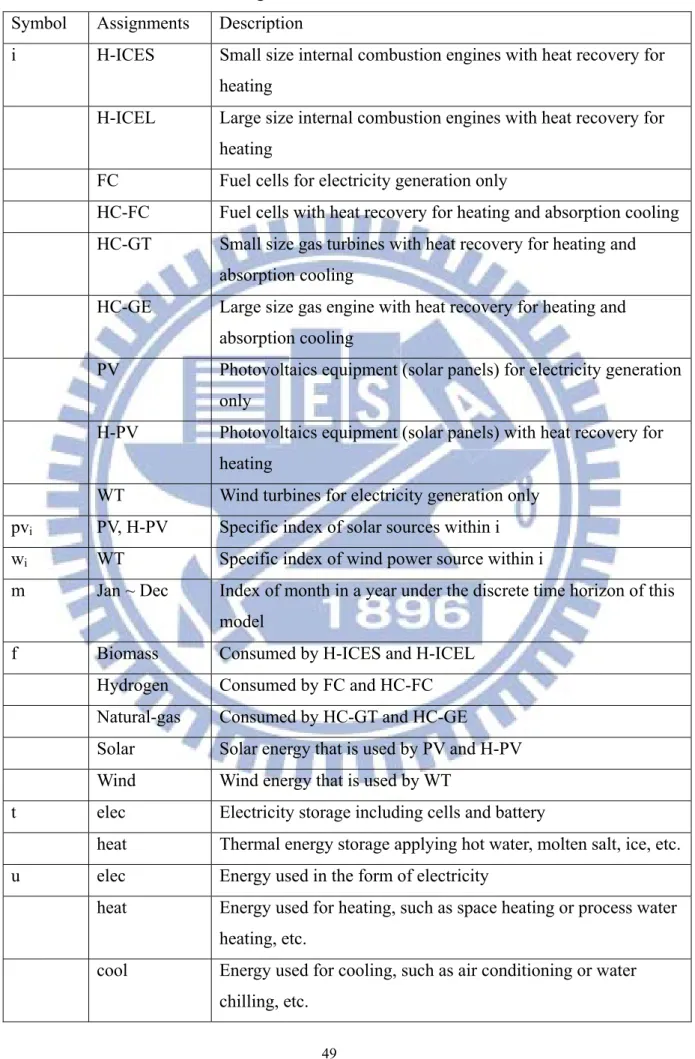
5.3.1 Model index assignment ... 48
5.3.2 Model parameter assignment ... 50
VI.
Analysis and Results... 59
6.1 Operation characteristics of the model ... 59
6.1.1 System performance under expected cost minimization ... 59
6.1.2 System performance under worst-case cost minimization ... 63
6.2 Scenario analysis of the model ... 66
6.2.1 Scenario analysis under expected cost minimization ... 68
6.2.2 Scenario analysis under worst-case cost minimization ... 73
6.3 Influence of diversity constraints ... 79
VII.
Discussion and Suggestions ... 81
7.1 Formation of the Pareto curve for the multi-objective optimization ... 81
7.1.1 Pareto curve under diversity constraints ... 81
7.1.2 Pareto curve without diversity constraints ... 83
7.2 Applicability and limitation of the model... 86
VIII.
Conclusion ... 90
References ... 93
List of Tables
Table 1: List of microgrid architectures ... 17
Table 2: Model Indices for Taichung Industrial Park ... 49
Table 3: DER equipment information ... 53
Table 4: Model Parameters – Hypothesized Demand Schemes of Taichung Industrial Park .. 56
Table 5: Expected cost minimization – DER sources capacity design (Unit: 10 kW) ... 60
Table 6: Worst-case cost minimization – DER sources capacity design (Unit: 10 kW) ... 63
Table 7: List of Differences among Scenarios ... 67
Table 8: Comparison of model layouts with and without diversity constraints ... 79
Table 9: List of outcomes of the objective function with diversity constraints ... 82 Table 10: List of outcomes of the objective function – No Diversity Constraints / 6000 kW . 84 Table 11: List of outcomes of the objective function – No Diversity Constraints / 9000 kW . 85
List of Figures
Figure 1: A typical microgrid schematic diagram ... 2
Figure 2: Framework of this study ... 7
Figure 3: Structure of the levels of DER system optimization ... 9
Figure 4: A Pareto front for a two-objective problem ... 12
Figure 5: Conceptual networks of a typical microgrid ... 23
Figure 6: Geographic location of Taichung Industrial Park ... 44
Figure 7: Statistics of lines of business in Taichung Industrial Park ... 45
Figure 8: Proposed Layout of Microgrid for Taichung Industrial Park ... 46
Figure 9: Monthly customer demand curves of Taichung Industrial Park for five scenarios ... 58
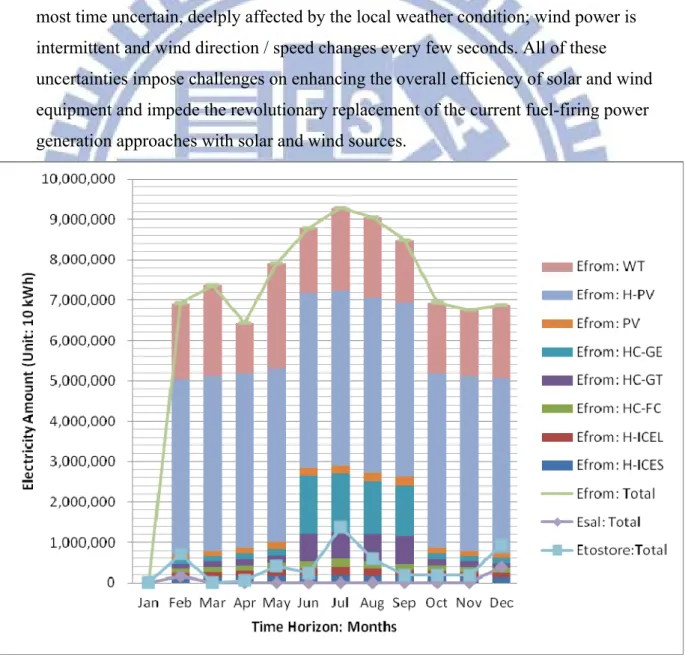
Figure 10: Distribution of power generation and usage under expected cost minimization – Microgrid for Taichung Industrial Park ... 61
Figure 11: Distribution of recovered heat under expected cost minimization – Microgrid for Taichung Industrial Park ... 62
Figure 12: Distribution of power generation and usage under worst-case cost minimization – Microgrid for Taichung Industrial Park ... 65
Figure 13: Distribution of recovered heat under worst-case cost minimization – Microgrid for Taichung Industrial Park ... 66
Figure 14: Scenario analysis under expected cost minimization – Cost structure of each individual scenario (Unit: USD$10) ... 68
Figure 15: Scenario analysis under expected cost minimization (Taichung Industrial Park) – Comparison of total power generation by months among individual scenarios ... 69
Figure 16: Scenario analysis under expected cost minimization (Taichung Industrial Park) – Comparison of power generation composition by power sources among individual scenarios ... 70
Figure 17: Scenario analysis under expected cost minimization (Taichung Industrial Park) – Comparison of total recovered heat by months among individual scenarios ... 71
Figure 18: Scenario analysis under expected cost minimization (Taichung Industrial Park) – Comparison of recovered heat composition by power sources among individual scenarios ... 72
Figure 19: Scenario analysis under expected cost minimization (Taichung Industrial Park) – Comparison of total direct fuel consumption among individual scenarios ... 73
Figure 20: Scenario analysis under worst-case cost minimization – Cost structure of each individual scenario (Unit: USD$10) ... 74 Figure 21: Scenario analysis under worst-case cost minimization (Taichung Industrial Park) –
Comparison of total power generation by months among individual scenarios ... 75 Figure 22: Scenario analysis under worst-case cost minimization (Taichung Industrial Park) –
Comparison of power generation composition by power sources among individual scenarios ... 76 Figure 23: Scenario analysis under worst-case cost minimization (Taichung Industrial Park) –
Comparison of total recovered heat by months among individual scenarios ... 77 Figure 24: Scenario analysis under worst-case cost minimization (Taichung Industrial Park) –
Comparison of recovered heat composition by power sources among individual scenarios ... 77 Figure 25: Scenario analysis under expected cost minimization (Taichung Industrial Park) –
Comparison of total direct fuel consumption among individual scenarios ... 78 Figure 26: Pareto curve of the dual-objective function (Taichung Industrial Park Microgrid) –
Diversity constraints: B=7 / Upper limit of power source capacity = 6000 kW .... 82 Figure 27: Pareto curve of the dual-objective function (Taichung Industrial Park Microgrid) –
No diversity constraints / Upper limit of power source capacity = 6000 kW ... 84 Figure 28: Pareto curve of the dual-objective function (Taichung Industrial Park Microgrid) –
No diversity constraints / Upper limit of power source capacity = 9000 kW ... 86 Figure 29: Example of a Pareto curve excluding the point of L=0 ... 87 Figure 30: Example of the graph for individual scenario costs vs expected costs (excluding the point of L=0) ... 88
List of Appendices
Appendix 1: Model Parameters for Taichung Industrial Park ... 98 Appendix 2: Model Parameters in Greek Letters ... 104 Appendix 3: Model Parameters – Local Weather Data of Taichung in the Year of 2011 ... 106 Appendix 4: Expected cost minimization – Distribution of power generation (Unit: 10 kWh)
... 107 Appendix 5: Expected cost minimization – Distribution of recovered heat (Unit: 10 kWh) . 108 Appendix 6: Worst-case cost minimization – Distribution of power generation (Unit: 10 kWh)
... 109 Appendix 7: Worst-case cost minimization – Distribution of recovered heat (Unit: 10 kWh)
... 110 Appendix 8: Scenario analysis under expected cost minimization – Distribution of power
generation (Unit: 10 kWh) ... 111 Appendix 9: Scenario analysis under expected cost minimization – Recovered heat usage
(Unit: 10 kWh) ... 112 Appendix 10: Scenario analysis under worst-case cost minimization – Distribution of power
generation (Unit: 10 kWh) ... 113 Appendix 11: Scenario analysis under worst-case cost minimization – Recovered heat usage
(Unit: 10 kWh) ... 114 Appendix 12: ... 115
Symbols
A : a large number
Allotims : allocation of capacity of source i to the operation in month m in scenario s,
kW
APVims : area of solar panels from source i in month m in scenario s, m2
B : the number of other sources that must be operating when a source is in use
C : assumed multiplied factor of peak electricity demand over average demand
Capi : capacity of adopted DER source i, kW
CCTaxs : cost of carbon tax in scenario s, $
CEbuyNs : cost of purchasing national grid electricity in scenario s, $
CFuels : cost of fuel consumption in scenario s, $
CInvs : cost of capital investments in scenario s, $
CLoadmus : average customer load in month m for end use u in scenario s, kW
COMs : cost of operation and maintenance in scenario s, $
Costs : total cost of scenario s, $
CSals : revenue from sales of electricity in scenario s, $
CSSs : cost of start and stop in scenario s, $
CTaxs : carbon tax per kg of carbon credit in scenario s, $/kg C
Cw : worst case in terms of cost, $
D : conversion factor of area of PV panels vs. 1kW electricity capacity
EbuyNmus : amount of electricity bought from the national grid in month m for end use u
in scenario s, kWh
ECInt : carbon intensity of electricity, kg C/kWh
EDchars : regulated demand charge rate of electricity in scenario s, $/kW
eff : efficiency of DER technology, %
Efromimus : amount of electricity produced from source i for end use u in month m in
scenario s, kWh
Efromstoretmus : amount of energy output from storage type t in month m for end use u in scenario s, kWh
Epricems : unit rate for electricity purchase from the national grid in month m in
scenario s, $/kWh
otherwise 0
EqStopims : binary variable, equal to 1 when source i stops in month m in scenario s,
otherwise 0
ESalims : amount of electricity sold to the national grid from source i in month m in
scenario s, $/kWh
ESInlts : initial energy storage level in storage type t in scenario s, kWh
ESMaxts : maximum energy storage level in storage type t in scenario s, kWh
ESMints : minimum energy storage level in storage type t in scenario s, kWh
EStoretms : amount of energy stored in the battery or heat storage t in month m in
scenario s, kWh
Etostoreitms : amount of excess energy sent to storage type t from source i in month m in scenario s, kWh
Expected : expected cost of scenario s, $
f : index of fuel type
FCIntfs : carbon intensity of fuel f in scenario s, kg C/unit of fuel
FCostis : fixed capital cost of DER technology i in scenario s, $/kW
Fpricefs : unit fuel charge of fuel f in scenario s, $ per unit of fuel consumed
Fuelfmus : amount of fuel consumption for fuel f in month m for end use u in scenario
s, unit depends on the fuel type
G : proportion factor used to control the minimum power output of each source
i : index of power source
I : the number of DER source types
Inst : interest rate
j : alias of i
L : the weight of expected value in the dual objective function
LTimeis : prevalent life time period of technology i in scenario s, year
m : index of month in a year
MaxEbuyNms : peak electricity demand in month m in scenario s, kW
MaxEqmis : maximum power capacity of DER technology i in scenario s, kW
MinEqmis : minimum power capacity of DER technology i in scenario s, kW
N : the number of scenarios
OMfis : fixed operation and maintenance cost of DER technology i in scenario s, $/kW/yr
OMvis : variable operation and maintenance cost of DER technology i in scenario s,
$/kWh
ps : probability of scenario s
prodSolarims : possible power output from solar sources i in month m in scenario s, kWh
prodWindims : possible power output from wind source i in month m in scenario s, kWh
pvi : index of solar source within i
Rms : local irradiation data in month m in scenario s, kW/m2
RHeatimus : recovered heat from DER technology i in month m for end use u in scenario
s, kWh
s : index of scenario, 1~N
Spriceis : selling price of electricity from source i to the national grid in scenario s,
$/kWh
t : index of storage type including electricity and heat
u : index of end uses of energy including electricity, heating, and cooling
Vcis : cut in wind speed of wind turbine i in scenario s, m/s
Vfis : cut off wind speed of wind turbine i in scenario s, m/s
Vnis : nominal wind speed of wind turbine i in scenario s, m/s
Vwms : on-site wind speed in month m in scenario s, m/s
wi : index of wind source within i
xims : binary variable, equal to 1 when source i is operating in month m in scenario
s, otherwise 0
Greek Symbols
αi : heat recovery efficiency of source i, %
βfu : heat efficiency of fuel f for end use u from direct fuel consumption, %
γiu : utilization efficiency of recovered heat from source i for end use u, % δtu : utilization efficiency of stored energy from storage type t for end use u, %
εt : storage coefficient of storage type t, %
θ : minimum percentage of electricity purchase from the national grid, %
I. Introduction
1.1 Background
For several decades, humans have been facing the threats of natural resources depletion and global climate change to the Earth. Nevertheless, energy consumption contributes to a large portion of these problems. Huge amounts of fossil fuels are used and converted into different energy types such as electricity and heat to meet domestic and industrial demands. On the other hand, energy generation in most cases comes with undesired byproducts, such as carbon dioxide and solid particles, among others, which have been proved to be some of the major causes of greenhouse effect and air pollution. However, continuous technology advancement in electrical appliances and economic growth of human society are often driving forces that place even higher pressure on energy
demands. As a result, seeking alternative power sources, which may share the loading on the centralized power supply system while mitigating environmental impacts, has been receiving more attention than ever before.
1.2 An introduction to microgrids and the related technology
In recent years, renewable energy that is naturally replenished, such as sunlight, wind, rain, etc., has gained renewed interests due to the fact that the technology advancement in efficiency improvement and cost down has gradually made it commercially feasible. Some other power soures such as biomass, hydrogen, and natural gas, etc., though not completely renewable, are also deemed green because they are applicable substitutes for the traditional fossil fuels like oil and coal. Meanwhile, distributed generation (DG) or distributed energy resources (DER), which generates electricity from dispersed small on-site power sources as the supplement to or replacement for the traditional electricity supply system, is another concept that is gaining increasing popularity because of its capability of exploiting local resources, reducing long-distance power transmission loss, and ensuring power generation diversity. A DER system often incorporates a variety of power generation technologies such as fuel cells, wind turbines, and photovoltaic system (PV), as well as trigeneration, also called combined cooling, heat and power (CCHP), which recovers waste heat from electricity generation for the usage of heating and cooling. As a complement of DG, distributed energy storage (DS) enables excess energy generated, in the form of electricity or heat, to be saved near the power sources and local demands for future usage.
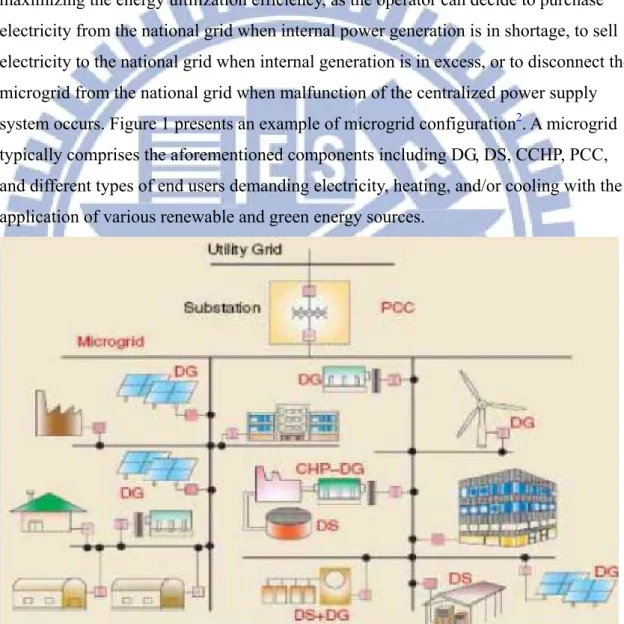
The term microgrid refers to a cluster of customer loads, microsources (DER), and energy storage (DS) operating as a single controllable system, which provides both power and heat to its local area1. One of the features of a microgrid is that it normally connects to a traditional centralized grid, which is also called a macrogrid or national grid. A single point of common coupling (PCC) controls the connection or disconnection of a microgrid to the centralized grid, such that the microgrid may operate autonomously when PCC is disconnected. The point of control gives the grid operator flexibility in maximizing the energy ultilization efficiency, as the operator can decide to purchase electricity from the national grid when internal power generation is in shortage, to sell electricity to the national grid when internal generation is in excess, or to disconnect the microgrid from the national grid when malfunction of the centralized power supply system occurs. Figure 1 presents an example of microgrid configuration2. A microgrid
typically comprises the aforementioned components including DG, DS, CCHP, PCC, and different types of end users demanding electricity, heating, and/or cooling with the application of various renewable and green energy sources.
Figure 1: A typical microgrid schematic diagram Source: Jeon et al. 20102
Power generation and customer loads in a microgrid are often interconnected at low voltage, and this can be assured by the low-voltage bus of the substation transformer.
1.3 The advantages and potential of microgrids
1.3.1 Advantages of the microgrid system
Over the past decade, there have been emerging interests worldwide in the development of the microgrid system in that microgrids have the following advantages:
1. Unlike current centralized power supply grid or huge power plants, they require much smaller financial commitments in each project, although the unit cost of the electricity generated may be higher. This is a tradeoff between economy of scale and flexibility, and when considered with other factors, microgrids may gradually
increase their competitive advantages. For example, lower budget thresholds may encourge central govenments to empower local goverments or even communities to build their own power systems.
2. By utilizing more renewable resources, microgrids can be more environmentally friendly with less carbon footprints.
3. With the application of advanced technology, microgrids demand fewer technical skills to operate and rely more on automation.
4. The microgrid system can be adopted by an isolated area, such as an industrial park or an island, and therefore protecting the area free from grid disturbance or power outage caused by unexpected national grid failure.
5. The multiple diverse generation sources would provide highly reliable electric power to the local area in the way that when one source fails, the other sources may run in higher allocation of capacities to cover the shortage. Moreover, when there is a need from the national grid or other local areas, the excess energy generated by one microgrid can be transmitted to the national grid to release the other loading. 6. Microgrids enable the autonomy of local energy supply and therefore take the
individual customers out of the grip of large power corporations or central power suppliers.
1.3.2 History and future potential of microgrid development
Due to their many advantages over the traditional centralized grids, microgrids have gained popularity among countries and become hot topics of national projects and academic research in the past few years. As of 2006, researches and experiments related to microgrids were conducted in four countries or regions including EU, US, Japan, and
Canada3. For example, 11 EU countries and 22 partners are currently involved in the “MICROGRIDS” project, which is part of the“Intergration of RES+DG” projects in Europe and aims to increase the penetration of micro-generation in the general power networks. In the United States, various organizations including Consortium for Electric Reliaility Technology Solutions (CERTS), Power Systems Engineering Research Center (PSERC), and Lawrence Berkeley National Laboratory (LBNL) have participated in the research of microgrids, and several test fields have been built in different states. In Japan, several projects with field tests on local power system are currently executed by New Energy and Industrial Technology Development Organization (NEDO)4. There are also projects led by CanMET energy technology center in Canada.
Seeing the potential of microgrids as a promising alternative of traditonal power supply system, governments of Singapore, Korea, and Taiwan began to invest in the research of microgrids recently, following the advanced countries (region) mentioned above. The Institute of Nuclear Energy Research (INER) in Taiwan started to develop power control and energy management technology for microgrids in 2009. Although there has been limit research on the topic of microgrids in Taiwan so far, it can be expected that an increasing number of research projects will be launched in the years to come.
1.4 Objective of the current research
1.4.1 Development of a decision support model for microgrids
Due to the lack of empirical data and the complex compostion of microgrids, it is often quite annoying for government agencies or the designers they hire to perform initial analyses, such as power source selection, capacity design, budgeting, and risk evaluation, etc., especially when the specific data of equipment models and manufacturers are not readily available. The designers would need a handy tool to capture the big picture of a proposed project and make a prelimernary planning that takes into account the actual local data, such as customer loads and weather statistics, etc.
The objective of the current study is to develop a decision support model, which provides a set of optimization solutions and can be used for microgrid planning in the design stage. The modle should be capable of performing multiobjective optimization, while considering possible uncertainties to certain degree at the early stage. Although
the output data of this kind of model can be rough, their influence may be critical to the whole project because they often serve as a reference point which indicates whether to proceed with the project or not at the first place.
1.4.2 Scope and position of the current study
There have been numerous researches with different focuses in the field of microgrids. Existent studies include control schemes, scheduling, single-objective optimization, and multi-objective optimization without considering uncertainties, etc. Nevertheless, renewable energies are always full of uncertainties. For instance, the amount of sunlight in an area is deeply depended on the local weather condition, which may change every day. Similarly, the wind power in most cases is unstable because the velocity and direction of wind may change in every minute. Customer demands and fuel prices are also unstable factors, which varies from time to time. Therefore, one of the goals of the study is to use robust optimization to deal with uncertainties in a microgrid system. In addition, a power generation project always involves the participation of diverse stakeholders, including power system developers, government agencies, law makers, and civil society. From the viewpoints of different parties, some objectives are
conflicting by nature. For example, capacity maximization enlarges economy of scale but places lower flexibility; cost minimization may cause larger adverse environmental impacts; minimizing expected cost of a project may increase the variation among
different scenario costs. This study proposes a model that would take multiple objectives into consideration and help decision makers seek compromising solutions among all stakeholders.
To summarize, this study aims at developing a decision support tool for microgrid planning, which provides robust solutions on the basis of multiobjective optimization. The model established will later be applied to Taichung Industrial Park as an example of microgrid planning.
1.5 Framework of the current research
The current study starts with a brief introduction to the key items, such as DER and microgrids, the advantages and potential of microgrids, and then a statement of the
research objective. Chapter 1 ends with the framework of the current research. A comprehensive literature review is conducted in Chapter 2, which is categorized into four parts: DER system planning approaches, multi-objective optimization on DER, uncertainties in DER and robust optimization on process design, and others. The significance of the current study is then mentioned, compared to the prior researches. Chapter 3 states the motivating problem that drives the development of the proposed model. The generic and localized (customized) applications of the model are initially discussed. Chapter 4 presents the methodology of the current research, including the position of this model in the entire microgrid design process and rigorous mathematical formulation of the model.
In Chapter 5, the proposed model is applied to plan a microgrid system to be used in Taichung Industrial Park, which is located in central Taiwan. An overview of the
industrial park and the hypothesized layouts and settings of the microgrid are presented, followed by a series of parameter assignments as the model input. The output of the modeling and the analysis of the output data are shown in Chapter 6. Scenario analysis, sensitivity analysis, and case analysis are performed repectively in this study. The performance of the model can be observed through various analyses.
Chapter 7 contains the discussion of the applicability and limitation of the model, as well as the suggestions for future research. A Pareto curve between expected cost and worst-case cost is present in this chapter as one of the important outputs of this model, which may facilitate the evaluation of the model users on the microgrid configuration and budgeting. The conclusion of the entire study is presented in Chapter 8. Figure 2 shows the main structure of the current study.
The reference part and appendix, which contain the bibliography and the programming codes, repectively, are listed after the main text.
Figure 2: Framework of this study Introduction
Literature Review
Problem Statement Incentives of the Study
Positioning of the Model
Mathematical Formulation of the Model
Modeling for Taichung Industrial Park
Analysis & Results
Discussion & Suggestions
Conclusion Methodology
Verification
Application
Applicability & Limitation of the Model
II. Literature Review
Despite the late introduction of the microgrid concept, there have been many researches in different espects of this field of study. With regard to the objective and scope of the current study, the related prior researches can be categorized into the following sections.
2.1 DER system planning approaches
The planning of DER system or microgrids is a job with broad scope, covering tasks from the initial proposal of an investment plan, through the process of preliminary evaluation, budgeting, and basic design, all the way to the detailed design and the operation plan. Due to the complexity of the real projects, modeling has always been a popular way in simplifying and simulating the actual system, for facilitating the design process and decision making. With the distinct purpose and scope of each stage
described above, sometimes it is necessary for a planner to adopt different plan and evaluation models in different stages of the planning process.
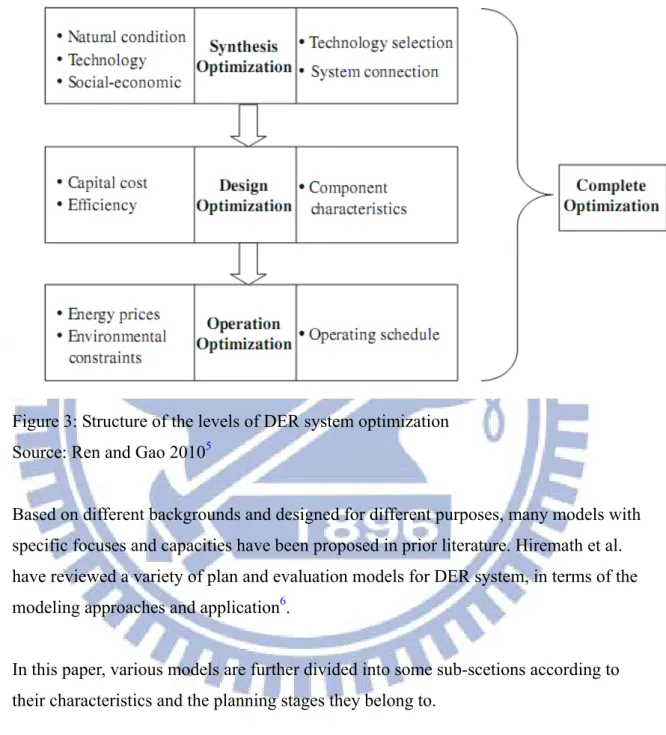
In general, models used in early stages of a project should aid in the synthesis evaluation of the project, while those used in the later stages should assist in detailed operation planning. A hierachical relationship among tasks of different levels in the planning of a DER system is shown in Figure 3 (Ren & Gao, 2010)5. It can be seen that a complete optimization process consists of several levels with different scopes and concerns. In the synthesis optimization level, the designated area is evaluated with a macro analysis, in terms of natural conditions (e.g. geography and climate), technology (e.g. local supply chains), and social-economic characteristics. The objectives of this level are to select DER technology candidates for further evaluation and to consider the system connection. When it comes to the design optimization level, the estimate of capital cost (i.e. budgeting) and the target efficiency of the proposed system should be taken into account. In this stage, different candidates of pre-selected DER components should be put into analysis for an optimized planning of system layouts. It is very important to identify the technical characteristics of all components and observe the properties of the substances entering and exiting each component at the nominal load of the system. Finally in the operation optimization level, factors to be considered include energy prices (e.g. fuel price and electricity purchase price, etc.) and environmental constraints,
such as carbon tax rate and government regulations. The goal of this stage is to obtain a detailed operating schedule of each selected components for the optimum overall system performance, given the system planning derived from the design stage.
Figure 3: Structure of the levels of DER system optimization Source: Ren and Gao 20105
Based on different backgrounds and designed for different purposes, many models with specific focuses and capacities have been proposed in prior literature. Hiremath et al. have reviewed a variety of plan and evaluation models for DER system, in terms of the modeling approaches and application6.
In this paper, various models are further divided into some sub-scetions according to their characteristics and the planning stages they belong to.
2.1.1 System planning and design
Modeling for strategic design of microgrids normally goes ahead of those for detailed design and operation plans, and appears in the early stage of the planning. Driesen and Katiraeri reviewed different trends in planning methods for distribution system from the past to the future and compared the planning approaches of conventional centralized system, decentralized energy system, and microgrids7. Hawkes and Leach presented an
economic optimization model for high level system design and unit commitment of a microgrid8. Li et al. developed a thermo-economic optimization model of a DER system in Beijing9. Chinese and Meneghetti constructed a mixed-integer linear programming (MILP) model for utility profit maximization and a linear programming (LP) model for adverse emissions minimization for a biomass-based industrial district-heating area in Italy10. Medrano et al. developed a simulation model and researched the economic, energetic, and environmental impacts of integrating microgrids into generic types of commercial buildings in California11. Maribu et al. presented a market diffusion model for analyzing DER adoption in US commercial buildings12. Zhou et al. applied a simulation model to anayzing the optimal DER adoption of five prototype commercial buildings in the Japanese context, with US cases for comparison13.
Ren and Gao proposed a synthesis concept for designing the layouts of DER system, considering the integration among DER technologies and customer services5. They also
proposed a MILP model for integrated plan and evaluation of DER system, aiming at integrating synthesis, design, and operation optimization in one single model. Since its goal was to generate a detailed plan of the equipment deployment, this model was developed based on an “equipment concern”, which means that detailed design, such as the number and capacity of the machines in each type of DER equipment selected, can be achieved by setting the number of equipment as integer variables in the model.
2.1.2 Operation plan and scheduling
After the basic design is completed, normally the selected types of DER technologies, the total capacity of each type, and even the number of equipment are also determined. These data then serve as input parameters in the operation plan and detailed scheduling of the DER system or microgrid. Numerous researches have been reported in this field of study. Morais et al. developed a MILP model for optimal scheduling of a renewable microgrid in an isolated load area14. Kalantar and Mousavi proposed a model simulating the dynamic behavior of an isolated microgrid, which consisted of wind turbine, solar array, microturbine, and battery storage15. Logenthiran et al. presented an agent-based system for energy resource scheduling of integrated microgrids16. Ruan et al. analyzed
four types of DER technologies for the optimal operation modes of four commercial buildings17.
Naraharisetti et al. constructed a sophisticated MILP model for scheduling in microgrids with a linear diversity constraint, which provides an efficient way to ensure the diverse operation of various DER technologies18. This was a detailed scheduling plan with source type and capacities given as parameters. Soderman and Pettersson proposed a structural and operational optimization model with MILP for a DER system with the involvement of district heating19.
2.2 Multi-objective optimization on DER
Microgrids and DER system have long been ideal targets of optimization modeling, as they generally involve a complicated network of multiple energy suppliers (e.g., power generation sources, energy storage, and the national grid) and energy consumers. There are so many possible arrangements of the energy transmission between senders and receivers that a single best solution is not readily available or solvable. Depending on the intended objective of the designers and the complexity of the modeling, single or multi-objective functions may be constructed for optimization.
For a single-objective function, normally the one optimal solution can be found if the model is solvable. As for a multi-objective function, in most cases there should be a set of compromise solutions between different or even conflicting objectives, instead of one best solution. This problem can be mathematically formulated as (P1)20:
)) ( ..., ), ( ), ( ( min ) ( min F x f1 x f2 x fn x (P1) . .t s x 0 G(x) 0 H(x) where f is the i th
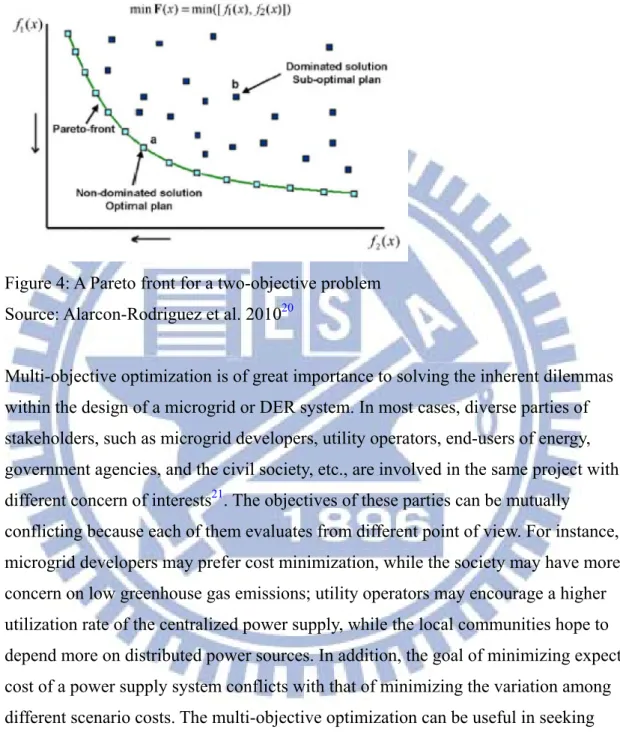
i objective function; n is the number of objectives; x is the decision vector (variable); is the decision domain that defines the possible outcomes of x ; G(x) represents the set of equality constraints and H(x) represents the set of inequality constraints. In this kind of problem, various objectives are conflicting that there is no single solution but a set of optimal solution, called Pareto set. A solution belongs to the Pareto set if no improvement is possible in one objective without losing in any other objective. Figure 4 illustrates the possible outcomes of a two-objective problem as an example. It can be seen from the chart that for a certain two-objective
problem, the set of optimal solution lies along a Pareto curve. A solution “a” is stated to dominate a solution “b” if “a” is not worse than “b” in all objectives and “a” is better than “b” in at least one objective.
Figure 4: A Pareto front for a two-objective problem Source: Alarcon-Rodriguez et al. 201020
Multi-objective optimization is of great importance to solving the inherent dilemmas within the design of a microgrid or DER system. In most cases, diverse parties of stakeholders, such as microgrid developers, utility operators, end-users of energy, government agencies, and the civil society, etc., are involved in the same project with different concern of interests21. The objectives of these parties can be mutually conflicting because each of them evaluates from different point of view. For instance, microgrid developers may prefer cost minimization, while the society may have more concern on low greenhouse gas emissions; utility operators may encourage a higher utilization rate of the centralized power supply, while the local communities hope to depend more on distributed power sources. In addition, the goal of minimizing expected cost of a power supply system conflicts with that of minimizing the variation among different scenario costs. The multi-objective optimization can be useful in seeking compromising solutions, which benefit all parties of stakeholders22.
2.2.1 Development of multi-objective optimization and decision making
The development of multi-objective optimization includes how to systematically obtain the diverse solutions of the Pareto front and how to find a compromising final solution after a considerable number of Pareto solutions are generated. Zangeneh and Jadid used
single-objective minimization to obtain diverse solutions of the Pareto front for planning distributed generation systems23.The normal boundary intersection method was used to generate evenly distributed solutions in the Pareto set. Tang and Tang presented a weighted sum method in the multi-objective planning for choosing the locations and sizes of distributed generation units24. The authors discussed the issue of how to assign proper weights to the objectives depending on the planner’s preference. Barin et al. addressed the problem of choosing the best solution from an existent list of feasible planning options for distributed generation systems25.
2.2.2 Application of multi-objective optimization
Multi-objective optimization was widely used in prior research of microgrids and DER system. Celli et al. worked for minimizing different costs with multi-objective modeling for the optimal sizing and siting of distributed generation26. Ren et al. considered both economic and environmental aspects while constructing a multi-objective linear
programming (MOLP) model for analyzing the operation of distributed energy systems in a local area of Japan27. Kavvadias and Maroulis applied multi-objective optimization to the design of a trigeneration plant with economic, energy-saving, and environmental concerns28. This is a detailedsmall scale optimization model focusing on a single plant. Becerra-Lopez and Golding presented a multi-objective optimization model for the capacity expansion of regional power generation systems29. Haesen et al. incorporated multiple objectives into the model for long-term planning of DER deployment and sizing30.
2.3 Uncertainties in DER and robust optimization on process design
Uncertainties exist in almost every design of engineering and industrial processes. There is no exception to the planning of DER systems and microgrids. A microgrid design, for instance, may encounter a variety of uncertainties, such as fluctuation of energy and fuel prices, variation of customer demands, changes in local weather, changes in regulations, unstable power supply quality, and possible outcome of main grid failure, etc. Robust optimization, which minimizes the risk of uncertainties, can be a solution to this kind of problems. There have been a number of researches in prior literature regarding
uncertainties in distributed generation systems. However, the research on the application of robust optimaiztion is limited.
2.3.1 Prior research regarding uncertainties in DER design
Consideration to various uncertainties in the design of DER systems can be found in some of the literature before. Handschin et al. used mathematical programming in achieving better economic efficiency of distributed generation system under uncertainty
31. Fleten et al. considered price uncertainty while constructing a mathematical model to
obtain optimal investment strategies in distributed renewable power resources32. Afzal et al. studied investiments in the DER system with a microgrid model under uncertainty33. Mavrotas et al. developed an integrated model with a mathematical programming framework for planning the CHP system in buildings of the services’ sector, while considering the uncertainties in customer demand34. Houwing et al. also used modeling to systematically analyze uncertainties in the design and operation of DER systems35.
2.3.2 Robust optimization on process design under uncertainties
In the design of engineering process, one of the critical issues is to deal with different kinds of uncertainties, which may adversely increase variations in the performace of the designed system. For instance, in the process design of a microgrid or DER system, uncertainties come along with the estimated customer demand, fuel prices for power generation, and local weather conditions, such as the amount of sunlight and wind, etc. Multiple scenarios are typically used to express possible uncertainties in a model that copes with uncertainty. Different scenarios usually have different objectives (e.g. cost minimization for different scenarios). When a number of scenrios are evaluated together, optimizing various objectives simultaneously results in a multi-objective problem. The prevailing way to deal with this problem is to use the stochastic model (Dempster, 1980)
36, which optimizes the expected value of all objectives with a cost vector. This approach
can be expressed as follows: Expected N y y ,..., , 1 min x (P2) . .t s s s s Cost p Expected
) , ( s s f y Cost x N y y ,..., , 1 xthe cost of scenario s constituded by a certain function f(x,ys); is the set of viable vectors. In practice, the set of viable vectors is usually restricted to the Pareto optimal set, . Each scenario s is formed with a different set of design and control variables, *
denoted as xRn0and n1
s R
y respectively, which corresponds to a certain practical
realization of the operation process. The stochastic model is established based on the assumption that the decision maker is risk-neutral, such that the optimal decision only depends on the expected cost. Handschin et al. used a stochastic model to deal with uncertainties when optimizing the operation of a distributed generation system31. Although the stochastic model ensures that the probability-weighted average of the scenario costs is minimized, it is not guaranteed that the process of this approach can perform to a certain level over all of the uncertain parameters37. In addition, the accurate assessment of the probability of each scenario cannot easily be achieved in most cases. Hence it is necessary to use some additional robustness approaches to cope with the process variability among scenarios.
Robustness can be inferred as risk aversion from the economic and technical points of view (Kang et al., 2011)37. Due to the fact that the nature of each variable is different,
Kang et al. proposed that the design and control variables can be classified into three groups: (1) scenario-independent variables, (2) scenario-dependent economic or
monetary variables (e.g., cost and profit), and (3) scenario-dependent technical variables (e.g. temperature, pressure, and efficiency, etc.). For the scenario-dependent economic variables, the robustness mechanism should work in the way to reduce relatively higher scenario costs, while keeping the overall average cost as low as possible. As for the scenario-dependent technical variables, the robustness measures should be acting to make the operation conditions insensitive to variations within certain ranges as defined by the scenarios.The robustness measures for scenario-dependent economic variables can also be referred to as the “economic robustness measures”, while the robustness measures for scenario-dependent technical variables being referred to as the “technical robustness measures” 37.
Considerable research has been done in the development of economic and technical robustness measures. It has been verified that economic robust measures should be
monotonic, and that using symmetric measures (e.g., variance) as economic robustness measures generates suboptimal solutions, because symmetric measures act for reducing the variability from the mean, a mechanism which itself cannot be an objective of robust optimization37. In addition, in a multi-objective problem, no single optimal solution can optimize several objectives at the same time. Pareto optimality has been shown to be one of the effective criteria in deciding which robustness measures are suitable for robust economic optimization. It should be noted that Pareto optimality is guaranteed only for monotonic robustness measures. Kang et al. introduced the application of robust economic optimization for process design under uncertainties in 200438. On the other hand, study has shown that unlike economic robustness measures, technical robustness measures should be even functions to reduce variations among scenarios37. Although a number of robustness measures have been developed for technical variables, the differences between economic and technical variables and between their respective robustness measures have seldom been studied.
Regarding economic variables, various kinds of economic robustness measures have been available so far for variability control. Suh and Lee presented the Pareto-optimal subset condition, in which worst-case cost and partial mean of costs were recommended for robust economic optimization39. It was proven that these two approaches guaranteed the Pareto optimality of multi-scenario problems. The definitions of worst-case cost and partial mean of costs are listed and given by (P3) and (P4):
Worst-case cost: Cw max
Costs s1,...,N
(P3)Partial mean of costs:
N s s s PM C t p Cost t U 1 0 , max ) , ( (P4)
where t is a target value defining the criterion for penalizing exceedingly high scenario costs. Both measures have been proven to be effective in robust economic optimization. Kang et al. presented an integrated robust optimization model, which incorporates both economic and technical robustness measures, along with a decision making procedure37. The objectives include expected value, an economic robustness measure, and technical robustness measures. In this study, an innovative formulation for robust economic optimization was proposed for suggesting the proper range of target values in a robust partial mean model. In addition, worst-case cost is recommended to be the economic robustness measure and half interval is proposed as the technical robustness measure.
This study also applies the global criterion (Miettinen, 1999)40 to help determine the compromising final solution of the multi-objective model.
2.4 Other researches related to DER and microgrids
2.4.1 Applicability and classification of microgrids
Defined as a localized grouping of distributed electricity generation, energy storage, and customer loads that is normally able to operate independently with optional connection to a traditional centralized grid, a microgrid system can be applied to many kinds of local regions (e.g. an industrial park or a remote island)7.
Table 1: List of microgrid architectures
Utility Microgrids Industrial/Commercial
Microgrids
Remote Microgrids
Urban Rural Multifacility Single
Facility Application Downtown areas Planned islanding Industrial parks, university campus, and shopping centers A commercial or residential building Remote communities and geographical island Main Drivers Outage management,
RES integration
Power quality enhancement, reliability and energy efficiency
Electrification of remote areas and reduction in fuel consumption Benefits GHG1 reduction Supply mix Congestion management Upgrade deferral Ancillary services
Premium power quality
Service differentiation (reliability levels) CHP integration DRM2 Supply availability RES integration GHG reduction DRM
Operating modes GD3, GI4, IG5 GD, GI, IG IG
Transition to GI and IG mode
Accidental Faults (on adjacent feeders or substation)
Main grid failure, power quality issues
Pre- scheduled
Maintenance Energy price (peak time), utility maintenance
1: greenhouse gases; 2: demand resource management; 3: grid dependent; 4: grid independent and autonomous operation; 5: isolated grid
A number of possible microgrid types have been presented in prior literature (Driesen and Katiraeri, 2008)7. Table 1 shows a general classification of applicable microgrid architectures and their characteristics, based on a comparison of their applications, drive forces, and benefits, etc. It can be seen from the list that industrial parks and islands are two of the best targets for microgrid adoption.
2.4.2 General studies on renewable energy and DER technologies
Numerous studies have been carried out on the topics of renewable energy and DER technologies. Chicco et al.41 and Hiremath et al.6 conducted comprehensive reviews on
distributed generation, discussing emerging green energy such as biomass, fuel cells, solar energy, and wind power, etc. Alanne et al. analyzed the advantages of distributed energy generation and identified it as a favorable option for low carbon emissions and sustainable development of human society42. Huang et al. reviewed the current operation and market penetration of DER and microgrids43.
2.4.3 Miscellaneous in literature review
Katiraei et al.44 and Lopes et al.45 studied the autonomous operations of microgrids. Barsali et al.46, Piagi and Lasseter47, and Yuan et al.48 focused on control schemes of microgrids. Jiang-Jiang W et al.49 and Cho et al.50 placed particular concerns on
combined cooling, heating, and power systems (CCHP), which is one of the major forms of DER technologies. Mohamed and Koivo used Mesh Adaptive Direct Search
algorithm to solve a nonlinear model of microgrids51. Chen et al. analyzed the influence
of introducing a DER system for redevelopment of a densely built-up area in Tokyo52.
2.5 Significance of the current study
Compared to the existing literature mentioned above, the current study features in the following espects:
2.5.1 Application of robust optimization to microgrid design
It can be found from the literature review that most studies regarding microgrids have focused on system analysis and evaluation, scheduling, control schemes, planning with single-objective optimization, and planning with multi-objective optimization without considering uncertainties. However, uncertainties constitute one of the most annoying
problems in microgrid design and thus cannot be ignored. There has been rigorous research in the field of robust optimization, but the application of robustness measures in microgrid modeling has not been explored yet. Hence this study proposes a decision support model with multi-objective optimization, which takes an economic robustness measure as one of the components of the dual objective function. The optimization approach aims at lowering the impacts of comparably higher scenario costs, while minimizing the overall expected cost of the system. This model may be used in practice for microgrid planning, taking uncertainties into account already in the design level.
2.5.2 MILP modeling with capacity concern
Modeling has been widely used in previous research to simulate the operation of various microgrids. Some models are designed for primary analysis of a project, while others are specified to do detailed planning on microgrid operation. Linear programming (LP), mixed integer linear programming (MILP), and nonlinear programming are typical appoaches to be applied in modeling. Although models with nonlinear programming sometimes can better simulate the real situation, they are generally much more difficult to be solved practically. On the other hand, models with integer or binary variables usually place substantial computing load in the solving process. In this study, a MILP model is developed to facilitate the planning of a microgrid project, by simulating the possible operation of the proposed microgrid in response to given conditions.
Unlike some other models, which were designed to generate the detailed plans of equipment types and numbers for a certain microgrid (e.g., Ren and Gao, 2010), the model presented in this study is designed based on a “capacity concern” and can be used even for the preliminary analysis of a proposed project with unknown or insufficient equipment data. In other words, the current model aims at capacity sizing for different power source candidates, such as fuel cells, photovoltaic panels, and wind farms, etc., rather than suggesting in detail which types of power generators and the number of each type to be installed. In addition, this model adopts several piece-wise linear relationships between cost and capacity to approximate the effect of economy of scale.
2.5.3 Application of the model to an industrial park
The model proposed in this study is applied to design a mirogrid for Taichung Industrial Park, which is one of the most important industrial clusters in Taiwan. A strategic layout of different DER technologies is also proposed for the park. The trial of modeling a microgrid for Taichung Industrial Park helps in verifying the applicability of this model as a decision support tool and indicates the potential of applying it elsewhere.
III. Problem Statement
For a few years, the microgrid concept, which encompasses renewable energy and distributed energy resources, has been attracting increased attention from the academia, governments, and industry in many countries. Owing to the facts that renewable energy can assist in releasing humans’ dependence on fossil fuels and reducing greenhouse gas emissions, and that the DER system can enhance the flexibility and independence of local energy supply, the demand for microgrid development can only be stronger in the foreseen future because of the arousing global concerns on long-term sustainability.
With the above-mentioned incentives and other advantages brought by renewable energy and DER technologies, the microgrid topic has drawn a wide range of research from all over the world and has been studied from economic, energy-saving, and environmental points of view. Some studies reviewed the history and current status of microgrid and DER development, while others analyzed the performance of microgrid systems with respect to various factors, and still some others proposed mathematical models for microgrid planning. Aside from the other research in the literature, the problem to be solved in this study is addressed as follows.
3.1 Motivation of the current modeling
Taiwan is still in the early stage of introducing DER and microgrid concepts to the academia and industry, falling behind EU, US, Japan, and Canada. There is lack of green energy information, such as the accurate trade price of biomass or hydrogen, not to mention detailed DER equipment information, such as the fixed cost and operation cost of each equipment type, or the technical characteristics (e.g. efficiencies) of each type. This information gap between planners (e.g. government agencies) and equipment suppliers (e.g. domestic or oversea manufacturers) usually causes difficulties in the preparatory work of an intended project under assessment. Hence there is a need for an applicable model that would only require generic parameters and can be used as early as in the budgeting or design stage of a project before the planners would bother to obtain comprehensive equipment specifications from various manufacturers.
The proposed modeling in this study enables a quick evaluation of building a microgrid in a newly developed local area or an existent district supplied by traditional centralized power system. This approach may ease the pressure of data collection with limited time
and resources in the preliminary planning stages when there is inadequate equipment information. Furthermore, under the situations that customer demand and local weather data are variable and that detailed equipment and fuel price information are not easily available, uncertainties play a critical role in determining the feasibility of a microgrid proposal and the tolerance of budgeting, and therefore need to be considered in advance. It is thus necessary that the robustness measures be included in the initial planning for risk control. The current modeling attempts to handle uncertainties with the initiative of robust optimization, while still keeping other economic and environmental objectives as primary concern.
3.2 Description of the model structure
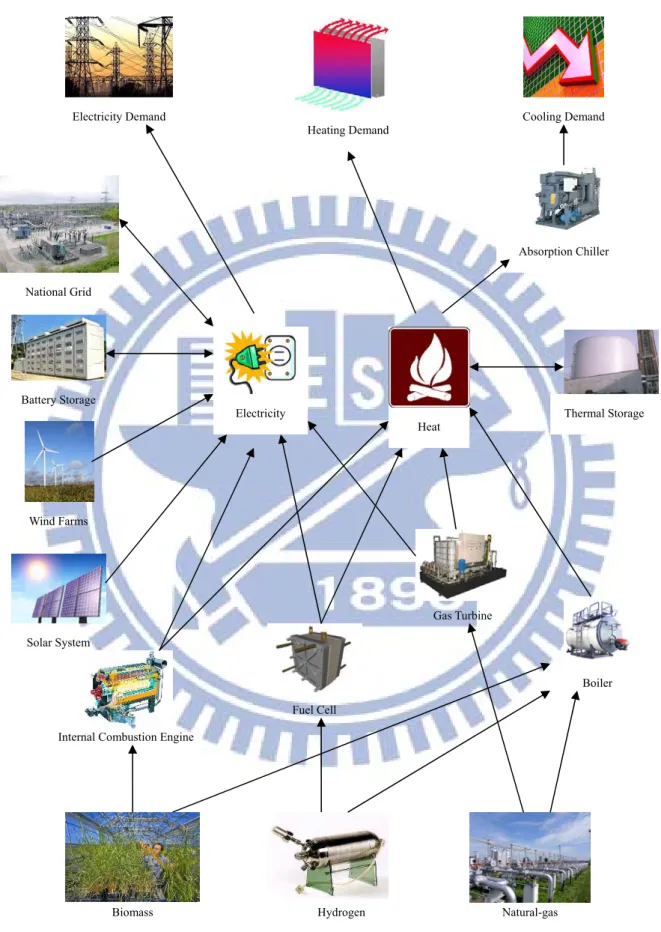
In order to simulate the real operation of a microgrid, the proposed model consists of a variety of power generation sources, namely the different DER technologies, energy storage such as batteries and heat storage, and different kinds of customer loads, including electricity, heating, and cooling demands, as well as the external connection with the national grid. The individual elements are interconnected with others to form a circulated system, such that the energy flows therein to feed demand with supply. The schematic structure of the energy supply networks is shown in Figure 5. The power generators produce electricity with different types of fuels. For example, fuel cells use hydrogen to generate electricity, internal combustion engines transform biomass or natural gas into electricity, and wind turbines convert wind power into electricity, etc. The electricity produced normally should be sent to the end-users directly for their immediate use. When the power supply is in excess of the customer demand, the extra electricity can either be sent to the storage for future usage, or be sold to the national grid to support other areas in need.
As for the heating demand of customers, it can be satisfied either with the heat generated from the CCHP technology (i.e., recovered from the waste heat of power generation), or with heat generation from direct combustion of fuels such as biomass and natural gas, through the use of traditional boilers. Similar to the case of electricity, excessive heat may be saved in the thermal storage for future arrangement. However, there is currently no such mechanism that energy can flow out of the microgrid in the form of heat.
Figure 5: Conceptual networks of a typical microgrid Biomass
Absorption Chiller
Hydrogen Natural-gas
Internal Combustion Engine
Fuel Cell
Gas Turbine
Cooling Demand
Heat Thermal Storage
Heating Demand Electricity Demand Electricity Solar System Wind Farms Battery Storage National Grid Boiler
On the other hand, heat can also be transferred to meet local cooling demand, generally through the application of absorption chillers. In this model, the chilling process is not independently presented, but combined with the operation of some particular kinds of DER technologies, including fuel cells with heat recovery for heating and absorption cooling (HC-FC), small size gas turbines with heat recovery for heating and absorption cooling (HC-GT), and large size gas engine with heat recovery for heating and
absorption cooling (HC-GE), each with the prefix HC-.
Finally, the interaction between the microgrid and the national grid is configured in the way that the microgrid operator can choose either to connect or to disconnect with the national grid. When the PCC is disconnected, the microgrid operates independently and all customer loads should be met with internal power supply. In the case that the
microgrid is connected to the national grid, the deal with the centralized power supplier should be subject to some contracted conditions. The macrogrid operator may request to set up a threshold, such that a minimum percentage of the total power supply within the microgrid should be purchased from the main grid. This kind of request is generally deemed reasonable because the flexible connection option between the microgrid and the national grid inevitably lifts up the maintenance cost of the national grid, reduces power supply quality, and increases the possibility of system malfunction. When the PCC is connected, the microgrid is allowed to purchase electricity from the national grid or to sell its electricity to the national grid.
3.3 Pre-settings of the optimization model
The problem stated in this chapter is addressed and analyzed with a multi-objective optimization model, which is aiming at generating a feasible plan of the microgrid design. The model is formulated mathematically in the next chapter with different sets of parameters, variables, and equations. Before the modeling process is systematically presented, some pre-conditions regarding the model should be put forward here.
3.3.1 Basic assumptions of the model
The model is constructed based on the following basic assumptions:
1. All arrangements of the DER system and their corresponding performances in the model are evaluated from purely the economic point of view. Although the criteria