1198
Preparation and characterization
of activated carbons from corn cob
W. T. TSAI
Department of Environmental Engineering and Health Chia Nan College of Pharmacy and Science, Tainan 717, Taiwan
C.Y. CHANG and S.L. LEE Graduate Institute of Environmental Engineering
National Taiwan University, Taipei 106, Taiwan (Received 11 April 1997; accepted in revised,fon I July 1997)
Key words - A. activated carbon, B. activation
Activated carbons are carbons of highly microporous form with both high internal surface area and porosity, and commercially the most common adsorbents used for the removal of organic compounds from air and water streams. Any cheap material with a high carbon content, low inorganics can be used as a raw material for the production of activated carbon [I]. Literature survey indicates that there have been many attempts to obtain low-cost activated carbon or adsorbent from agricultural wastes such as coconut shells [2-41, almond shells [S-9], peach stones [7], grape seeds [9], apricot stones [5,9- lo]. cherry stones [9,11], olive stones [6,7,12], peanut hull [ 131, nut shells [14], rice husks [15], oil palm shells
[ 161, and sugarcane bagasse [ 171.
During the 1980’s, expansion of corn plantations was followed by the generation of large quantities of agricultural waste corn cob. It was reported that the annual generation of waste corn cobs has exceeded 130,000 metric tons in Taiwan [ 181. There are several ways of disposing of this waste. For example, the conversion of the biomass into energy by combustion is one of the choices to treat the waste [ 191. However, this method will generate serious problem of air pollution from burning. It is a possible utilization to turn this waste material into useful and valuable products. The data of ash and the carbon content in corn cob indicate that it is a suitable raw material for the production of activated carbon [20].
Basically, there are two different processes for the preparation of activated carbon: physical activation and chemical activation [ 11. Physical activation involves carbomzatlon of a carbonaceous material followed by the activation of the resulting char at a temperature between 1073 and 1373K in the presence of suitable oxidizing gases such as carbon dioxide or steam. In chemical activation the precursor is mixed with a chemical agent and then pyrolyzed between 673 and 873K in the absence of air. Chemical activation offers several advantages in that it is carried out in a single step combining carbonization and activation, performed at lower temperatures and therefore resulting in the development of a better porous structure, although the environmental concerns of using chemical agents for activation could be developed [21]. Besides, part of the added chemicals can be easily recovered [ 10,221.
The objective of the present work was to investigate the feasibility of producing activated carbons from agricultural waste corn cobs. Process parameters such as impregnation ratio of chemical activating agent to
corn cob. pyrolysis temperature and soaking time were varied to examine the effects on the preparation of activated carbons by chemical activation with zinc chloride (ZnClz). The physical characterization of the resulting activated carbons was then analyzed in terms of BET surface area, total pore volume and pore size distribution.
Fresh, air-dried, corn cobs were first cracked and crushed to free the pitch and chaff in a hammer mill, and then sieved to several different particle sizes. Fifty grams of the sieved corn cob with mesh of 12 to 16 (average particle size of 1.435 mm) was mixed in a glass flask with about 200 cm3 of ZnCl, solutions of various impregnation ratios (i.e., with the ratio of ZnClz weight to corn cob weight of 0.2-2.0). Impregnation was carried out at about 358K on a hot plate with boiler- reflux condenser for 2 hours. The sample solution was then filtered in a vacuum filter flask to collect the impregnated corn cob sample. It was then dried in an oven at 393K overnight. According to the results of inductively coupled plasma-atomic emission spectro- meter (ICP-AES) analysis, the actual impregnation ratios arc 6.4, Il.0 and 19.8 wt.% in comparision with the initial impregnation ratios (defined above) of 0.2, 0.5 and 1 .O, respectively. Due to operational considerations, the impregnated sample was placed at the isothermal zone of a tubular stainless steel reactor (800 mm in length and 50 mm in diameter) instead of a quartz reactor. This reactor was placed vertically inside an electric tube furnace controlled by the proportional integral derivative (PID) programmer to maintain a stable bed temperature. Samples were heated at a rate of IOK/min to the specific pyrolysis temperature in the range of 673.1073K under a nitrogen flow of about 300 cm3/min STP. Thermal treatment at each of the specified temperatures was held for 0.5-4.0 hours of soaking time. After pyrolysis, the products was cooled, weighted. washed thoroughly with 3N hot hydrochloric acid solution, filtered in a vacuum flask and then washed repeatedly wrth hot distilled water to remove chlorides and other residues attached to the resulting activated carbon. Finally, the product of activated carbon after vacuum filtration was dried at 378K overnight and then placed in a desiccator. The notation of samples, and the conditions of their preparation are cited in Table 1. An automated surface area porosimeter (Micromeritics ASAP 2000) was used to characterize the physical properties of the activated carbon produced from the corn cobs. The values of BET surface area, the total port
Table 1. Physical characteristics of activated carbons obtained from corn cob with chemical activation using ZnCl2.
Sample code
Pyrolysis Soaking Impregnation ratio BET surface Total pore
temperature (K) time (hour) (% wt.) area volume
(m2/g)* SBET (cm3/g), V, AC114 673 0.5 AC124 673 AC213 AC223 AC214 AC224 AC234 AC244 AC215 AC225 AC216 AC226 773 773 773 773 773 773 773 773 773 773 AC314 873 AC324 873 AC334 873 AC344 873 AC414 AC424 AC434 Ah AC541 AC532 AC542 AC514 AC524 AC534 973 973 973 973 1073 1073 1073 1073 1073 1073 1.0 0.5 1.0 0.5 1.0 2.0 4.0 0.5 1.0 0.5 1.0 0.5 1.0 2.0 4.0 0.5 1.0 2.0 4.0 4.0 2.0 4.0 0.5 1.0 2.0 100 100 75 75 100 100 100 100 150 150 175 175 100 100 100 100 100 100 100 100 20 50 50 100 100 100 535 0.28 613 0.31 651 0.33 725 0.36 960 0.49 911 0.45 774 0.35 783 0.38 1114 0.55 1139 0.57 1410 0.70 1338 0.66 750 820 791 744 747 786 682 703 400 424 446 706 757 721 0.37 0.40 0.39 0.38 0.37 0.37 0.33 0.34 0.19 0.21 0.20 0.34 0.37 0.34
ACM
1073 4.0 100 688 0.33volume and the pore size distribution were those obtained from the adsorption of nitrogen at 77K. The total pore volume and the pore size distribution are taken from the Kelvin method and BJH method, respectively.
The adsorption isotherm (Figure 1) of the resulting activated carbon indicates a typical Type I curve of the BDDT classification of physical adsorption isotherms 1231. The Type I isotherm was therefore
5
B
0-l
0.0 0.1,
0.2,
0.3,
0.4,
0.5 0.6 0.7 0.6Relative pressure, (P/PO)
0.9 1.0 Figure 1. Adsorption isotherm of nitrogen of activated carbon AC216 at 77K.
1199
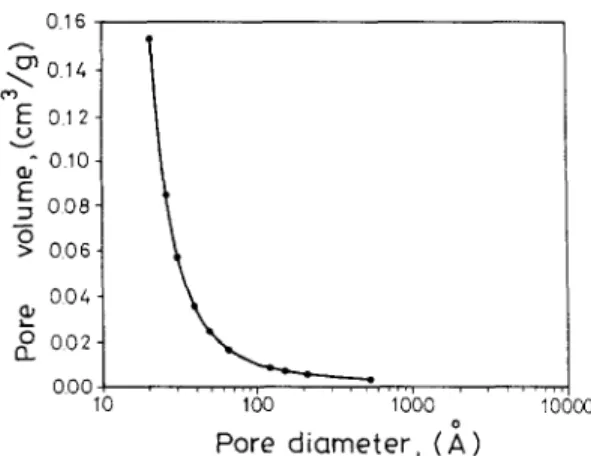
assumed to conform to the Langmuir equation and characterized by adsorption in a microporous solid having a small external surface area. It is noted that the interaction potential may be strong enough to bring about a nearly complete filling of the pores at a quite low relative pressure. Figure 2 shows that the pore size distribution of the resulting activated carbon reveals a sharp peak at a much lower pore diameter, about 2.0 nm. This is a characteristics of narrow pore size distribution for materials that are essentially microporous in nature. The results of Figure 2 with most of the pores being about or less than 2.0 nm in diameter were consistent with the data shown in Table 1.
The data in Table 1 indicate the BET surface area and the total pore volume which then give the mean pore diameter (4 Vr/Saur) of the resulting activated carbon. The data for the effects of pyrolysis temperature, soaking time and impregnation ratio on the physical characteristics of the samples are also presented in Table 1. The results reveal the following points.
1. The values of the BET surface area and the total pore volume increase rapidly with increase in the impreg- nation ratio of ZnCls activating agent, i.e., ACz13 < AC214 < AC215 < AC216 and AC541 < AC542 < A&,+
2. In the temperature range studied (673-1073K), the BET surface area and the total pore volume increase with pyrolysis temperature, and reach a maximum at about
016 3 ,014. mg 012- ; OlO- E -J ooa- 5 F ooo+ !L ,I',,< > 006. 004- 2 ooz- 10 100 1000 10000
Pore diameter, (i)
Figure 2. Pore size distribution of activated carbon AC216.
773K; thereafter, the trend is a decrease with pyrolysis temperature. The rate of declination is not as fast as that of increase. In our ZnC12-activated carbon series, the increase in temperature from 773K to 1073K may induce a shrinkage in the carbon structure, resulting in a reduction in the surface area and the pore volume.
3. As shown in Table 1, it seems that the soaking time plays a less important role in the production of activated carbon. It is seen that, by increasing soaking time from 0.5 to 1 .O hour, the surface area and the pore volume of the samples were increased as a result of the development of porosity. However, the values thereafter are observed to decrease gradually at longer soaking time, which is possibly attributed to the gasification of the few well developed micropore wall
In conclusion, the chemical activation process was used to prepare activated carbons from agricultural waste corn cob with commonly used chemicals, ZnC12, in the present study. The effects of major parameters during chemical activation were investigated. Under the experimental conditions investigated, the resulting activated carbons are essentially microporous materials as supported by the adsorption isotherm by the BET method. The optimal values of the parameters for the production of high surface area (about 1400 m2/g) activated carbon are 175 % impregnation ratio, 773K pyrolysis temperature, and OS- 1 .O hour soaking time for the corn cob activated with ZnC12. Further studies on the chemical characteristics of the resulting activated carbon, and the chemical activation with potassium salts and the physical activation with CO2 from corn cob will be made.
Acknowledgements The
thanks to the National for its financial support NSC 84-221 l-E-041-002).
authors express their sincere Science Council, Taiwan, of this work (Project No.
I. 2. 3. 4. 5 _ 6. I. 8 9. IO. I I. 12. 13. 14. IS. 16. 17. 18. 19. 20. 21. 22. 23. REFERENCES
Bansal. R.C., Donnet, J.B. and Stoeckli, F., in Active
Clzrbon, Dekker. New York, 1988, pp.3-5.
Mortley, Q., Mellowes, W.A. and Thomas, S., Thermochimico Acta, 1988, 129, 173.
Laine, J., Calafat, A. and Labady, M., Carbon, 1989, 27. 191.
Raivigorova, M., Goranova, M., Minkova, V. and Cernv, J., Fuel, 1994, 73, 1718.
Torreerosa. R. and Martin-Martinez. J.M.. Fuel.
1991,~70, i173.
Domingo-Garcia, M., Fernandez-Morales, I., Lopez-Garzon, F.J. and Moreno-Castilla, C.,
Langmuir. 1991.7. 339.
Rodiiguez-Reinoso, F. and Molina-Sabio, M.,
Carbon, 1992,30, I 11 I.
Guzel, F. and Tez, Z., Separation Sci. and Tech., 1993,28, 1069.
Gergova, K., Petrov, N. and Eser, S., Carbon, 1994, 32, 693.
Philip, C.A. and Girgis, B.S., J. Chem. Tech. Biotechnol,. 1996. 67. 248.
Lussier, M.C., Shull, J.C. and Miller, D.J., Carbon, 1994, 32, 1493.
Gonzalez, M.T., Molina-Sabio, M. and Rodriguez Reinoso. F.. Carbon. 1994. 32. 1407.
Periasamy,’ K. and ‘Namasivaiam, C., Sepuration
Sci. and Tech., 1995, 30, 2223.
Nguyen, C.. Ahmadpour, A. and Do, D.D.,
Adsorptzon Sci. Tech., 1995, 12, 241.
Khalil, L.B., Adsorption Sci. Tech., 1996, 13, 317.
Hussein, M.Z., Tarmizi, R.S.H., Zainal, Z., Ibrahim, R.and Badri, M., Carbon, 1996, 34, 1447.
Girgis, B.S., Khalil, L.B. and Tawfik, T.A.M., J.
Chem. Tech. Biotechnol., 1994, 61, 87.
Yang, S.S., Wei, C.B., Koo, K. and Tsai, S.S., J. The
Biomass Energy Society of China (Taiwan), 1991,
10, 70. (in Chinese).
Lin, J.L.. J. Agricultural Machinery (Taiwan), 1994, 2. 21.
Ebeling, J.M. and Jenkins, B.M., Trans. ASAE, 1985. 28. 898.
Jankowskai H., Swiatkowski, A. and Choma, J., in
Active Cnrbon, Ellis Horwood, New York, 1991, pp.50-52.
Ahamdpour, A. and Do, D.D., Carbon, 1996, 34, 471.
Gregg, S.J. and Sing, K.S.W., in Adsorption,
Surface Area and Porosity, 2nd ed., Academic Press, London, 1982, pp.2.4.