The prevalence rate of fatigue ranges from 7% to 45%,1and variations are due to the different char-acteristics of study populations. Fatigue is the pre-dominant physical symptom in patients with chronic diseases, such as arthritis and cancers. The complaints from patients are attributable to biological factors or psychiatric distress, such as depression and anxiety.2In patients with physical illnesses, such as cancer, or chronic disease and depression, fatigue can be explained by care- and cure-related factors.2
However, patients with fatigue as their chief complaint in a primary care unit might have dif-ferent causes that biologic factors cannot explain. The pathogeneses for fatigue are categorized into
four main areas:3physical illnesses, demographic factors, lifestyle factors, and social factors. Among young adults, lifestyle and social factors play an important role. Poor physical activity may also be associated with fatigue.4
There are scanty reports on the prevalence of fatigue and its associated risk factors among work-ing and young adult populations. Bultmann et al reported that fatigue prevailed among the working population, and lifestyle habits and psychologic distress contributed to the fatigue symptoms.4In one university, the prevalence of fatigue was as high as one-quarter of total new entrant students.5 Risk factors in association with fatigue in graduate students are poorly understood, and fatigue-related
Lifestyle Risk Factors Associated with
Fatigue in Graduate Students
Yi-Chin Lee,1Kuo-Liong Chien,2* Hsiu-Hsi Chen2Background/Purpose: Fatigue is not only common in clinical patients but is also prevalent in the healthy
population. This study aimed to estimate the prevalence rate of fatigue and identify significant risk factors among graduate students.
Methods: Health check-ups were carried out on graduate students who were newly admitted to the National
Taiwan University in this cross-sectional study. A total of 1806 attendees (response rate, 84%) agreed to participate in the fatigue survey, which used the Checklist Individual Strength questionnaire (CIS-20). The modified Baecke’s questionnaire was used to quantify the intensity of physical activity.
Results: The prevalence rates of fatigue were 45.8% for males and 48.9% for females. Regular meal (odds ratio
[OR], 0.69) and exercise habits (OR, 0.68), insomnia (OR, 2.23), greater amount of sleeping time (OR, 0.7), identity (doctorate vs. master students; OR, 0.61), and chronic disease history (OR, 1.61) were statistically significant predictors for fatigue. Intensity of physical activity was a protective factor (ORs, 0.72, 0.50 and 0.36 in the 2nd, 3rdand top quartiles vs. 1stquartile; p< 0.001).
Conclusion: A high prevalence rate of fatigue among the graduate students was demonstrated. The risk factors
among young adults are not only related to current chronic disease and insomnia but are also attributed to the lack of physical activity. [J Formos Med Assoc 2007;106(7):565–572]
Key Words: fatigue, graduate student, lifestyle, physical activity, young adult
©2007 Elsevier & Formosan Medical Association
. . . .
1Student Health Center, and 2Institute of Preventive Medicine, College of Public Health, National Taiwan University, Taipei, Taiwan.
Received: October 24, 2006 Revised: January 5, 2007 Accepted: April 10, 2007
*Correspondence to: Dr Kuo-Liong Chien, Institute of Preventive Medicine, College of Public Health,
National Taiwan University, Room 517, 17 Hsu Chow Road, Taipei 100, Taiwan. E-mail: klchien@ha.mc.ntu.edu.tw
risk factors, such as demographics, social and life-style factors, and physical illness are not reported among the young adult population.
This study aimed to estimate the prevalence rate of fatigue among graduate students in one university. Four dimensions of fatigue-related risk factors, including demographic factors, social factors, lifestyle factors, and physical illness, were investigated to identify significant predictors for fatigue.
Methods
Study subjects
Our survey targeted young adults, graduate stu-dents, in one university. According to the Labor Safety and Sanitary Regulations, new entry graduate students (including those in master’s and doctor-ate programs) are required to undergo a health check-up. In September of 2004, 2688 students were admitted into the university graduate pro-grams and they completed the health check-up program in October.
Data collection
The questionnaire package, including the basic information sheet, the Checklist Individual Strength–20 (CIS-20) questionnaire,6 and the modified Baecke’s physical activity questionnaire, were distributed to the students a week prior to the date of the health check-up. Students returned the questionnaire on the examination date and assis-tants gave instructions for those who had failed to complete the questionnaires properly and checked the data. Blood samples were collected in a fast-ing status and were sent to the central laboratory of National Taiwan University Hospital, which is affiliated to the National Taiwan University, for clinical measurements.
Measurement of variables
The CIS-20 questionnaire was used to detect fa-tigue severity. The items were divided into four dimensions, including eight questions for sub-jective fatigue (SF), four for reduced motivation
(RM), three for reduced activity (RA), and five for reduced concentration (RC). Each question had seven levels, classified from a score of 1 to 7. Fatigue severities were presented as high scores. CIS-20 had good reliability and validity, and the Chinese version of the CIS-20 questionnaire was likewise validated and proven to be reliable.7We defined a CIS-20 score of more than 76 as the cut-off point for fatigue as in the Maastricht Study.8
The physical activity questionnaire was adapted from Baecke’s physical activity questionnaire, al-though we excluded the work index in our study.9 The sport index included the types of sports en-gaged in and the duration and frequency of the exercise. Three levels of intensity of the sport index were specified,8and we estimated the total calorie by enumerating the items. The leisure-time index, on the other hand, included normal daily activities and lifestyle other than work and exercise. The total activity score was the summation of the sport and leisure-time indices. We also defined insomnia status as sleeplessness of more than once per week, and specified the sleeping hours by 7 hours, with regular exercise and meals as lifestyle variables.
In addition to demographic features (age and gender), information regarding lifestyle factors was also collected on sleep duration, frequency of in-somnia, the regularity of three meals per day, and smoking and drinking habits. The identification for students was classified into Doctorate or Master’s status.
Information on previous hospitalization, hepatitis events, and medication history was ob-tained from the questionnaire. We performed the biochemical tests, including liver function, renal function, hemoglobin, and levels of glucose, uric acid, cholesterol, and triglyceride in the blood. Hepatitis history was defined by self-report of hepatitis B or hepatitis C. Abnormal liver function was defined as alanine aminotransferase (ALT) > 41 IU/L for males and ALT > 31 IU/L for females. Fasting blood glucose > 115 mg/dL was also con-sidered abnormal. The criteria for defining abnor-malities included serum creatinine ≥ 1.3 mg/dL for renal function, uric acid ≥ 7.6 mg/dL, choles-terol > 220 mg/dL, triglyceride > 200 mg/dL,
hemoglobin < 12.3 g/dL for males and < 11.3 g/dL for females in association with anemia.
We defined the systemic diseases as follows: tuberculosis, asthma, hypertension, heart disease, stroke, renal disease, hyperlipidemia, diabetes, thyroid disease, gout/hyperuricemia, peptic ulcer disease, arthritis, epilepsy, poliomyelitis, hemo-philia, systemic lupus erythematosus, anemia, psychiatric disease, or malignancies.
Statistical analysis
Continuous variables were presented as mean± standard deviation and the categorical data were presented by contingency tables. We specified the characteristics of fatigue and related risk factors by gender. The χ2test was used to detect differ-ences between genders and if the expected num-bers were less than 5, Fisher’s exact test was used. We defined fatigue status as a total score of more than 76 in the CIS-20,8and estimated the preva-lence of fatigue in the study population.
Logistic regression model was used to estimate the parameters of various risk factors for fatigue. After the univariate model, we selected the best sub-sets of risk factors for binary outcome by stepwise selection criteria, with entry and stay significance levels of 0.2. We specified the quartiles of physical activity intensity as independent variables and test for the trend was used to evaluate the possible dose-response relationship between fatigue severity and physical activity intensity. All statistical analy-ses were performed using SAS version 9.1 (SAS Institute Inc., Cary, NC, USA) and a p value less than 0.05 was considered statistically significant.
Results
A total of 2144 students completed the health check-up program and 1806 signed the informed consent forms and were recruited into this study (response rate, 84%). The reasons for absence in-cluded withdrawal of admittance (n= 400) and failure to show up (n= 124). Distributions of age, gender, and identity of students were similar between respondents and non-respondents.
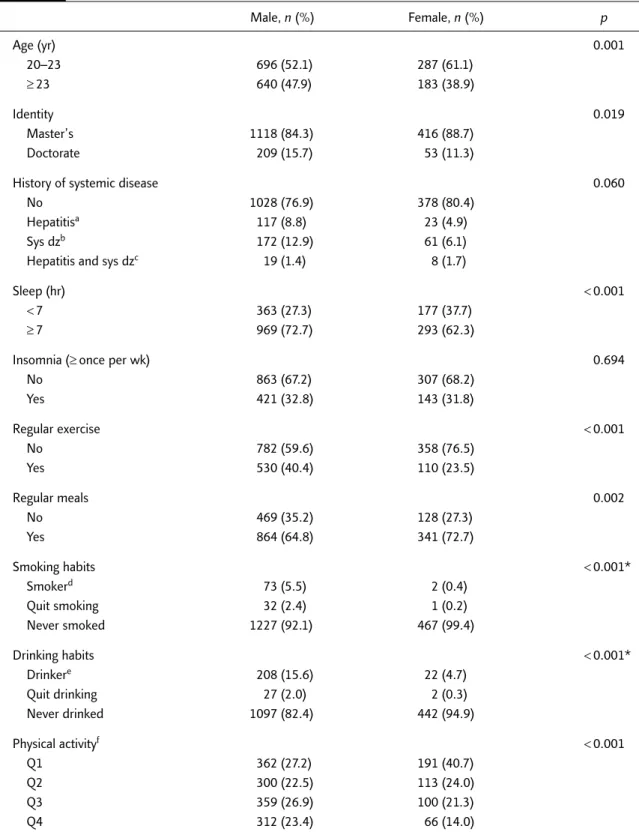
The characteristics of the study population, specified by gender, are listed in Table 1. Females were younger than males. Men had more doctor-ate students, more sleeping hours, more regular exercise habits, more irregular meals, more fre-quent drinking and smoking habits, and higher physical activity levels than women.
The overall prevalence rates of fatigue were 45.8% in males and 48.9% in females (Table 2). Master’s identity had higher fatigue rates than doctorate identity. Subjects with hepatitis or sys-temic diseases also had high prevalent fatigue rates, more than 50%. Sleeping hours < 7 hours was associated with high fatigue rates (52.6% in men, 54.2% in women). The prevalence rates were higher in the insomnia group, and regular exercise and meal habits had lower fatigue rates than their counterparts. The fatigue rates were 28.9% in males in the top quartile of physical activity level and 60.2% in the bottom quartile. In women, the corresponding prevalence rates among the top and bottom quartiles were 34.9% and 60.2%, respectively (Table 2). There were no differences in fatigue score among biochemical variables.
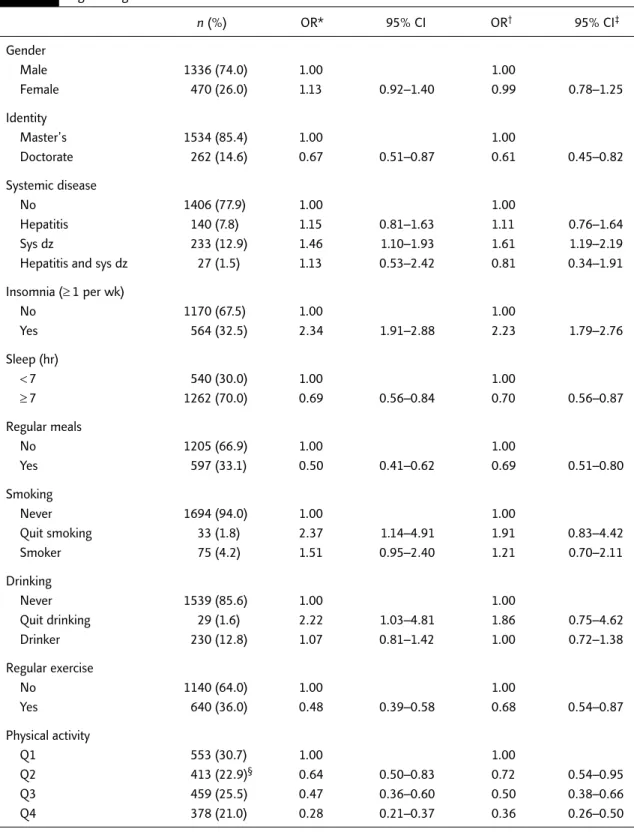
Table 3 shows the simple and adjusted odds ratios (OR) and respective 95% confidence inter-vals (CI) of various risk factors to predict fatigue status. Doctorate identity had less than a one-third likelihood of fatigue, compared with master’s identity. Those with systemic diseases or hepatitis history were strongly related to fatigue status, which had many associated risk factors, such as frequent insomnia, fewer sleeping hours, irregular meals, smoking and drinking habits, and irregular exercise habits.
Finally, physical activity intensity was inversely related to fatigue status, and the top physical ac-tivity quartile could reduce the significant likeli-hood of fatigue among the study population (adjusted OR, 0.36; 95% CI, 0.26–0.50). There were significant dose-response relationships be-tween physical activity intensity and fatigue rates (adjusted ORs, 0.72, 0.50 and 0.36 in the 2nd, 3rd and top quartiles vs. 1st quartile, p< 0.001, test for trend).
Table 1. Characteristics of subjects by gender in the study population (N= 1806) Male, n (%) Female, n (%) p Age (yr) 0.001 20–23 696 (52.1) 287 (61.1) ≥ 23 640 (47.9) 183 (38.9) Identity 0.019 Master’s 1118 (84.3) 416 (88.7) Doctorate 209 (15.7) 53 (11.3)
History of systemic disease 0.060
No 1028 (76.9) 378 (80.4)
Hepatitisa 117 (8.8) 23 (4.9)
Sys dzb 172 (12.9) 61 (6.1)
Hepatitis and sys dzc 19 (1.4) 8 (1.7)
Sleep (hr) < 0.001
< 7 363 (27.3) 177 (37.7)
≥ 7 969 (72.7) 293 (62.3)
Insomnia (≥ once per wk) 0.694
No 863 (67.2) 307 (68.2) Yes 421 (32.8) 143 (31.8) Regular exercise < 0.001 No 782 (59.6) 358 (76.5) Yes 530 (40.4) 110 (23.5) Regular meals 0.002 No 469 (35.2) 128 (27.3) Yes 864 (64.8) 341 (72.7) Smoking habits < 0.001* Smokerd 73 (5.5) 2 (0.4) Quit smoking 32 (2.4) 1 (0.2) Never smoked 1227 (92.1) 467 (99.4) Drinking habits < 0.001* Drinkere 208 (15.6) 22 (4.7) Quit drinking 27 (2.0) 2 (0.3) Never drinked 1097 (82.4) 442 (94.9) Physical activityf < 0.001 Q1 362 (27.2) 191 (40.7) Q2 300 (22.5) 113 (24.0) Q3 359 (26.9) 100 (21.3) Q4 312 (23.4) 66 (14.0)
*Fisher’s exact test. aHepatitis: positive hepatitis B antigen or anti-hepatitis C antibody; bSys dz (other systemic disease), including any
of these illnesses: tuberculosis, asthma, hypertension, heart disease, stroke, renal disease, hyperlipidemia, diabetes, thyroid disease, gout/hyperuricemia, peptic ulcer disease, arthritis, epilepsy, poliomyelitis, hemophilia, systemic lupus erythematosus, anemia, psychi-atric disease, malignancy; cHepatitis and sys dz: simultaneously having hepatitis and other systemic disease; dSmoker: individual who
did not classify whether or not they have quit smoking were grouped into the smoking group; eDrinker: individual who did not classify
whether or not they have quit drinking were grouped into the drinking group; fPhysical activity: Q1 is ≤ the first quartile, Q2 is the first
Discussion
This study clearly demonstrated the high preva-lence rates of fatigue among young adults, com-posed by new entry graduate students in one university. We also defined several significant risk factors associated with fatigue. Physical ac-tivity intensity was demonstrated to be an inde-pendent protective factor.
The high prevalence of fatigue may cause some concern if graduate students, particularly those of master’s identity, are overloaded with study work and stress, which lead to fatigue or distress. We found a high prevalence of poor lifestyle habits, including insomnia and irregular exercise and meals. Moreover, a lower prevalence of fatigue was found in young adults with a suffi-cient amount of sleep, regular meals/exercise, Table 2. Prevalence of fatigue in the study population
Male (n= 1336) Female (n= 470) Total (N= 1806)
% (n) % (n) % (n) CIS-20 > 76 45.8 (612) 48.9 (230) 46.6 (842) ≤ 76 54.2 (724) 51.1 (240) 53.4 (964) Identity Master’s 47.1 (527) 50.7 (211) 48.1 (738) Doctorate 38.8 (81) 35.9 (19) 38.2 (100)
History of systemic diseases
No 43.8 (450) 48.7 (184) 45.1 (634)
Hepatitis 47.9 (56) 52.2 (12) 48.6 (68)
Sys dz 56.4 (97) 49.2 (30) 54.5 (127)
Hepatitis and sys dz 47.4 (9) 50.0 (4) 48.2 (13)
Sleep (hr)
< 7 52.6 (191) 54.2 (96) 53.2 (287)
≥ 7 43.1 (418) 45.7 (134) 43.7 (552)
Insomnia (≥ once per wk)
No 37.9 (327) 43.3 (133) 39.3 (460) Yes 60.6 (255) 59.4 (85) 60.3 (340) Regular exercise No 53.2 (416) 52.5 (188) 53.0 (604) Yes 34.3 (182) 42.0 (42) 35.0 (224) Regular meals No 58.9 (276) 54.7 (70) 58.0 (346) Yes 38.8 (335) 46.6 (159) 41.0 (494) Physical activity Q1 60.2 (218) 60.2 (115) 60.2 (333) Q2 50.0 (150) 47.8 (54) 49.4 (204) Q3 42.3 (152) 38.0 (38) 41.4 (190) Q4 28.9 (90) 34.9 (23) 29.9 (113)
CIS-20 = Checklist Individual Strength–20; Sys dz = other systemic disease, including any of these illnesses: tuberculosis, asthma, hypertension, heart disease, stroke, renal disease, hyperlipidemia, diabetes, thyroid disease, gout/hyperuricemia, peptic ulcer disease, arthritis, epilepsy, poliomyelitis, hemophilia, systemic lupus erythematosus, anemia, psychiatric disease, malignancy; Q1 is ≤ the first quartile; Q2 is the first quartile to median; Q3 is the median to the third quartile; Q4 is > the third quartile.
Table 3. Odds ratios and respective 95% confidence intervals of various risk factors for fatigue status in logistic regression models
n (%) OR* 95% CI OR† 95% CI‡ Gender Male 1336 (74.0) 1.00 1.00 Female 470 (26.0) 1.13 0.92–1.40 0.99 0.78–1.25 Identity Master’s 1534 (85.4) 1.00 1.00 Doctorate 262 (14.6) 0.67 0.51–0.87 0.61 0.45–0.82 Systemic disease No 1406 (77.9) 1.00 1.00 Hepatitis 140 (7.8) 1.15 0.81–1.63 1.11 0.76–1.64 Sys dz 233 (12.9) 1.46 1.10–1.93 1.61 1.19–2.19
Hepatitis and sys dz 27 (1.5) 1.13 0.53–2.42 0.81 0.34–1.91
Insomnia (≥ 1 per wk) No 1170 (67.5) 1.00 1.00 Yes 564 (32.5) 2.34 1.91–2.88 2.23 1.79–2.76 Sleep (hr) < 7 540 (30.0) 1.00 1.00 ≥ 7 1262 (70.0) 0.69 0.56–0.84 0.70 0.56–0.87 Regular meals No 1205 (66.9) 1.00 1.00 Yes 597 (33.1) 0.50 0.41–0.62 0.69 0.51–0.80 Smoking Never 1694 (94.0) 1.00 1.00 Quit smoking 33 (1.8) 2.37 1.14–4.91 1.91 0.83–4.42 Smoker 75 (4.2) 1.51 0.95–2.40 1.21 0.70–2.11 Drinking Never 1539 (85.6) 1.00 1.00 Quit drinking 29 (1.6) 2.22 1.03–4.81 1.86 0.75–4.62 Drinker 230 (12.8) 1.07 0.81–1.42 1.00 0.72–1.38 Regular exercise No 1140 (64.0) 1.00 1.00 Yes 640 (36.0) 0.48 0.39–0.58 0.68 0.54–0.87 Physical activity Q1 553 (30.7) 1.00 1.00 Q2 413 (22.9)§ 0.64 0.50–0.83 0.72 0.54–0.95 Q3 459 (25.5) 0.47 0.36–0.60 0.50 0.38–0.66 Q4 378 (21.0) 0.28 0.21–0.37 0.36 0.26–0.50
*OR = simple odds ratio in univariate logistic regression model; †OR = adjusted odds ratio for multiple logistic regression model
adjusting for gender, identity status, histories of systemic disease, insomnia, regular meals, smoking, drinking, regular exercise and physical activities; ‡c = 0.7 for multiple logistic regression model; §trend test, p< 0.0. Sys dz = other systemic disease, including any of
these illnesses: tuberculosis, asthma, hypertension, heart disease, stroke, renal disease, hyperlipidemia, diabetes, thyroid disease, gout/hyperuricemia, peptic ulcer disease, arthritis, epilepsy, poliomyelitis, hemophilia, systemic lupus erythematosus, anemia, psychiatric disease, malignancy; Q1 is ≤ the first quartile; Q2 is the first quartile to median; Q3 is the median to the third quartile; Q4 is > the third quartile.
and high physical activity levels. These findings might suggest that a high prevalence rate of fatigue may be mainly due to lack of regular lifestyle habits such as regular meals or exercise, sufficient amount of sleep and physical activity among graduate students.
Another possibility is that irregular lifestyle habits or lack of physical activity may lead to in-somnia, and that in turn results in fatigue. By using a log-linear model to assess the association be-tween these lifestyle factors, we found that regular meals of three times per day (p< 0.0001) were significantly associated with insomnia and that there was a lack of significant association for phys-ical activity. This finding implied that those who have insomnia and irregular meals share common factors, such as stressful life events. The lack of association between physical activity and insomnia may also suggest that the link (or relationship) be-tween physical activity and fatigue is independent of insomnia in causing the symptom of fatigue.
Our study reported higher rates than previous population studies (21.7% for males and 22.5% for females),4but less than an Arabian popula-tion.10 Different ethnic populations have varied cultural viewpoints on fatigue and economic de-velopment levels also have impacts on fatigue prevalence. Fatigue is viewed as having a high rela-tion with psychologic or life stresses, rather than as an illness in Western countries. Westerners might not pay as much attention to the symp-toms related to fatigue during physical check-up. In contrast, Asians have an ingrained belief that fatigue is an illness due to the accumulation of too much work.11 The distress association with fatigue would thus be more likely to be presented in routine health check-up programs.
Wang et al’s study defined a cut-off point of 80 for males and 85 for females.7However, the pres-ent research has chosen 76 as the cut-off point for the following reason: although Wang et al’s subjects are citizens, they were also from a patient population, while Bultmann et al’s Masstricht cohort’s subjects were from the normal working population.8The subjects of the present study go to graduate school, which is closer to a working
population, and if we use 80 for males and 85 for females as the cut-off points, the false-negative rate might increase.
Although the relevant covariates presented in our study differed between males and females, no substantial gender difference in susceptibility to fatigue was observed after adjusting the related factors. Previous studies reported that females were more likely to show fatigue than males.12–16 The difference might be due to a relatively young and homogeneous characteristic in our study population.
This study showed that individuals with high physical activity level had less fatigue. Also, regular exercise and three meals a day are protective factors for fatigue. Our empirical results have significant clinical implications for the management of pa-tients with fatigue as their chief complaint. Accord-ing to past studies, one-fifth to one-third of fatigue cases will eventually develop into persistent fatigue,17and cases of persistent fatigue were found to have an increasing risk of developing depression and chronic fatigue syndrome in future years.18,19 Therefore, physicians should pay more attention to patients who complain of fatigue.
In addition to routine physical examinations, lifestyle information along with systematic disease or insomnia may become auxiliary criteria in ex-ploring the reasons for fatigue. However, lifestyle information is often neglected in clinical practice. If everything is normal after biochemical tests, the patient would often not consider that it is his/ her lifestyle that is causing fatigue. The individual would continue to seek further medical consulta-tion in vain. It is at this point that our educaconsulta-tion ought to be able to offer not only teaching stu-dents the techniques of sport during physical ed-ucation classes, but also to convey the message of establishing regular exercise habits.
In the original Baecke’s physical activity ques-tionnaire, there are three indicators: work, sport, and leisure time indices. As our target population comprised graduate students, the work indicator was not appropriate for our study.
This study had some limitations. Since the present study is a cross-sectional study, causal
relationships between some clinical correlates and fatigue may be difficult to disentangle. For in-stance, whether insomnia is a cause of fatigue or a consequence of fatigue cannot be clarified. Only an association was proven in this study. In addi-tion, some studies have reported that emotional status such as depressed mood and anxiety are associated with fatigue. This dimension was not considered in our study. However, it would have required more time to make such evaluations. Therefore, ongoing research should perhaps be conducted to assess the effects of depressed mood and anxiety on fatigue using a structural equation model.
In conclusion, a high prevalence rate of fatigue, as measured by the CIS-20 among graduate stu-dents, was found. The risk for fatigue was not only related to insomnia but also to irregular lifestyle habits and physical inactivity. Physicians should take care to consider lifestyle evaluation when evaluating young adults with fatigue complaints.
References
1. Lewis G, Wessely S. The epidemiology of fatigue: more questions than answers. J Epidemiol Community Health 1992;46:92–7.
2. Tiesinga LJ, Dassen TW, Halfens RJ, van den Heuvel WJ. Factors related to fatigue; priority of interventions to reduce or eliminate fatigue and the exploration of a multidiscipli-nary research model for further study of fatigue. Int J Nurs Stud 1999;36:265–80.
3. Sharpe M, Wilks D. Fatigue. BMJ 2002;325:480–3. 4. Bultmann U, Kant IJ, Kasl SV, et al. Lifestyle factors as risk
factors for fatigue and psychological distress in the working population: prospective results from the Maastricht Cohort Study. J Occup Environ Med 2002;44:116–24.
5. National Taiwan University. The 2004 Health Checkup Reports of the Newly Admitted Staff and Graduate Students at National Taiwan University. Taipei: National Taiwan University, 2004.
6. Vercoulen JH, Swanink CM, Fennis JF, et al. Dimensional assessment of chronic fatigue syndrome. J Psychosom Res 1994;38:383–92.
7. Wang CL, Huang JJ, Yang CY, Chuang HY. The evaluation of validity and reliability for the Chinese version of checklist individual strength questionnaire. Chin J Fam Med 2000; 10:192–201.
8. Bultmann U, de Vries M, Beurskens AJ, et al. Measurement of prolonged fatigue in the working population: determi-nation of a cutoff point for the checklist individual strength. J Occup Health Psychol 2000;5:411–6.
9. Baecke JA, Burema J, Frijters JE. A short questionnaire for the measurement of habitual physical activity in epidemio-logical studies. Am J Clin Nutr 1982;36:936–42. 10. McIlvenny S, DeGlume A, Elewa M, et al. Factors associated
with fatigue in a family medicine clinic in the United Arab Emirates. Fam Pract 2000;17:408–13.
11. Skapinakis P, Lewis G, Mavreas V. Cross-cultural differences in the epidemiology of unexplained fatigue syndromes in primary care. Br J Psychiatry 2003;182:205–9.
12. Valdini AF, Steinhardt SI, Jaffe AS. Demographic correlates of fatigue in a university family health centre. Fam Pract 1987;4:103–7.
13. Pawlikowska T, Chalder T, Hirsch SR, et al. Population based study of fatigue and psychological distress. BMJ 1994;308: 763–6.
14. Loge JH, Ekeberg O, Kaasa S. Fatigue in the general Norwegian population: normative data and associations. J Psychosom Res 1998;45:53–65.
15. de Rijk AE, Schreurs KM, Bensing JM. What is behind “I’m so tired?” Fatigue experiences and their relations to the quality and quantity of external stimulation. J Psychosom Res 1999;47:509–23.
16. Watt T, Groenvold M, Bjorner JB, et al. Fatigue in the Danish general population. Influence of sociodemographic factors and disease. J Epidemiol Community Health 2000;54: 827–33.
17. Skapinakis P, Lewis G, Mavreas V. One-year outcome of un-explained fatigue syndromes in primary care: results from an international study. Psychol Med 2003;33:857–66. 18. Lloyd AR. Chronic fatigue and chronic fatigue syndrome:
shifting boundaries and attributions. Am J Med 1998;105: 7S–10S.
19. Skapinakis P, Lewis G, Mavreas V. Temporal relations between unexplained fatigue and depression: longitudinal data from an international study in primary care. Psychosom Med 2004;66:330–5.