行政院國家科學委員會專題研究計畫 成果報告
企業社會責任與股票報酬─隨機優勢方法
研究成果報告(精簡版)
計 畫 類 別 : 個別型 計 畫 編 號 : NSC 99-2410-H-032-052- 執 行 期 間 : 99 年 08 月 01 日至 100 年 07 月 31 日 執 行 單 位 : 淡江大學財務金融學系 計 畫 主 持 人 : 張元 計畫參與人員: 碩士班研究生-兼任助理人員:林秉貞 處 理 方 式 : 本計畫可公開查詢中 華 民 國 100 年 10 月 21 日
此計畫已發表在 African Journal of Business Management, 5, pp. 1277-1285.
“Corporate Social Responsibility and Stock Returns-Stochastic Dominance Approach"
1. 前言、研究目的與文獻探討
Recently, the milk scandal in China, the Wall Street greed and the Madoff scandal in the US have begun to call in question whether corporate morality is decaying. At the same time, pressures apply on industry to improve business ethics through new public initiatives and laws are also increasing (e.g. higher UK road tax for higher-emission vehicles). Although the surge in interest of Corporate Social Responsibility (CSR) has been wildly accepted and put into practice by all sizes of corporations across business sectors globally, the question about whether firms with CSR get higher performance is still under ambiguity, theoretically and empirically in academics.
Theoretically, there are two major conflicting views regarding CSR impact on the financial performance of a firm. The social impact hypothesis, suggested by Cornell and Shapiro (1987) and Preston and O'Bannon (1997), stated that there is positive association between CSR and financial performance. Their arguments are (i) a CSR firm can improve its productivity through attracting high quality and loyalty workers, (ii) increase its sales and decrease the cost through higher corporate reputation, and (iii) obtain better insurance protection of brand image and financial performance during economic downturns or specific negative events.1
The other view, the shift of focus hypothesis, suggested by Becchetti et al. (2007), claimed that most of the CSR activities such as employee and community relationship, environmental protection and corporate governance are involved with a shift of focus from the maximization of stockholders’ value to the concern and interests of a wider set of stakeholders and thus increase the cost. Previous studies also argued that corporations engaged in CSR activities tends to have lower market competitiveness and worse performance due to inefficient use of resources (Friedman, 1970), product development limitation and cost-pushing non-profit activities.2 Therefore, CSR is negatively related to the financial performance.
Empirical studies also reach the mixed results. Supporters of social impact
hypothesis, such as Cochran and Wood (1984), adopted Moskowitz’s (1972) reputation
index, which rates firms into outstanding, honorable mention and worst companies, as the proxy of CSR measurement. They found CSR positively affects firms’ accounting returns. Stanwick and Stanwick (1998) Ruf et al. (2001) got similar result. Orlitzky (2001) examined the relationship between corporate social performance and firm financial performance and found that even firm size is controlled, the relationship remains positively correlated. Waddock and Graves (1997) and Tsoutsourz (2004) employed another similar reputation rating developed by Kinder et al. (1990, KLD) and found that
1 Moskowitz (1972), Parket and Eibert (1975), Bowman and Haire (1975), Alexander and Bucholtz (1978),
Solomam and Hansen (1985), Turban and Greening (1997), Tsoutsoura (2004), Werther and Chandler (2005) and Peloza (2006).
2 See Bragdon and Marlin (1972), Vance (1975), Aupperle et al. (1985), Ullmann (1985) for the view
past and current KLD ratings are positively related to the subsequent firm performance.3 Derwall et al. (2004) employed data of "eco-efficiency" scores from the Innovest rating database that only covers environmental issues of CSR for the period of 1995-2003. Under the CAPM framework and used multifactor model and incorporating industry effects, their findings supported high-scoring portfolio significantly outperforms the low-ranking one. Saleha et al. (2008) found CSR positively related to financial performance and suggested that firms achieve advanced levels of financial performance if they engage in social activities.
Alternatively, the shift of focus hypothesis also received substantial supports. Vance (1975) employed Moskowitz’s (1972) rating and found that firms with better ratings have lower stock returns. Newgren et al. (1985) found that firms with environmental assessment get inferior stock market returns. Brammer et al. (2005) examined the relationship between stock returns and CSR which is proxied by a composite indicator constructed from environment, employment and community activities. They found that scores on composite indicator are significantly negatively related to stock returns. Mahoney and Roberts (2007) found no significant relationship between a composite measure of corporate social performance and financial performance for Canadian firms. Makni et al. (2008) employed Granger causality test to assess the causal relationship between corporate social performance and financial performance by a sample of 179 publicly held Canadian firms during 2004~2005 but found no significant relationship.
Existing empirical studies about CSR and financial performance used three kinds of measures to proxy financial performance. 4 First measure is accounting-based, like ROA and ROE. The second is market-based measures like stock returns. The third method is the event studies about impact on short-run stock returns from emersion of engagement or contravention of CSR activities. As the ultimate goal of a typical firm is maximizing its profits, and the objective of a typical public company is to maximize its stockholder’s wealth, we use the market-based indicator, i.e. the stock returns, as our performance evaluation between CSR and non-CSR firms. One may concern that the essence of CSR is to care for stakeholders rather than just stockholders, but as the market of corporate control is active, CSR activities for a typical public listed company are all examined by the stock market performance. This validates our use of stock returns as performance indicator. In addition, McGuire et al. (1988) and Scholtens (2008) argued that market-based measures are less sensitive to accounting rules and managerial manipulation because they are based on evaluations and expectations of investors.
Based on the distribution of stock returns, we use stochastic dominance (SD) approach to analyze relative performance between CSR versus non-CSR firms. Hadar and Russell (1969), Hanoch and Levy (1969), Rothschild and Stiglitz (1970), and Whitmore (1970) introduced SD theory to economics research. The basic principle underlying SD is grounded in the maximization of expected utility. An advantage of this approach is that it lightens the problems that can arise if the asset returns are not normally distributed because it utilizes the whole distribution of returns. Moreover, since SD is nonparametric, SD tests do not require any specific assumptions on investors’ utility function or the returns distribution of asset and thus avoid the joint test problem inherent
3 KLD assessed the performance of multi-dimension stakeholder’s concerns among S&P 500 companies. 4 See Shen and Chang (2009) and Chang (2009) for detail.
in the standard approach. SD rankings also have direct interpretations in terms of expected utility and thus provide an appealing basis to relate investors’ revealed preferences to their risk attitudes (Fong, 2009).
The purpose of this paper is to investigate the stock performance between CSR firms and non-CSR firms in Taiwan. In May 2005, a leading Taiwan’s commercial magazine,
Global View Monthly (GMV hereafter), launches "CSR Award" to evaluate the listing
companies in the Taiwan Stock Exchange (TWSE).5 A corporation is defined as CSR firm if its aggregate rank of the evaluations is on the top 25; otherwise, it is non-CSR firm. We then analyze the stock market performance between these two groups with the SD approach.
The organization of the paper is as follows. Section 2 describes the measures of CSR and how the GMV compiles the CSR data bank. Section 3 discusses the SD approach and its application. Section 4 presents the empirical results and the last section concludes the paper.
2. 資料與研究方法
The estimation of effect of CSR activities on financial performance of firms often confronts with the problem of classifying CSR from non-CSR firms. In the early stage of research, the CSR firms are often defined by those spend a large amount of polluting control investment, expenditure on environmental recuperation and protection, prestige investigation from business school students, and social reputation ratings by leading business magazines, such as the Fortune, Times and Business Ethics.6 Recently, some research and financial institutions, like KLD and Financial Times Stock Exchange (FTSE),7 developed some widely acknowledged social responsible criteria which gradually became an international standard. For example, KLD rates firm as a CSR firm on the basis of eight criteria, i.e., community, corporate governance
,
diversity, employee relations, environment, human rights, product quality and controversial business issues. At the same time, firms included in the FTSE4GOOD Index must meet requirements in three areas: environmental, social and stakeholders, and human rights. In addition, companies whose business interests are involved in tobacco, nuclear weapons and power station and uranium are excluded from the index. Both indices have been widely employed in the literature.8
5 While there are numerous data of corporate social performance of firms around the world, like KLD,
FTSE4Good indices, Dow Jones Sustainability Group Index etc., their evaluation do not consider full TWSE-listing companies in Taiwan.
6 For example, Fortune magazine published results of an annual survey of company reputations since 1983
by asking thousands of senior executives, directors and securities analysts who responded to the survey to rate the ten largest companies in their industries on eight attributes of reputation, using a scale of zero (poor) to ten (excellent). The attributes are quality of management; quality of products or services; innovativeness; long-term investment value; financial soundness; ability to attract, develop, and keep talented people; responsibility to the community and the environment; and wise use of corporate assets. The score of a company is the mean of the ratings on the right attributes. Surveys were published in January during 1983-1990, February during 1991-1994 and March during 1995-2006. Anderson and Smith (2006) and Antunovich et al. (2000) found that stocks of companies ranked high by Fortune have higher subsequent returns than stocks that ranked low. But, Shefrin and Statman (2003) found conflicting results.
7 A jointly owned company by London Stock Exchange and Financial Times, provides financial indices. 8 Chih et al. (2008) applied FTSE4GOOD to study the relationship between the earnings management and
In Taiwan, the GVM also developed a similar framework to evaluate social responsibility of a firm from three dimensions, i.e. social participation, environmental protection and financial transparency. To be more specific, GVM refers to OEKOM, an independent research and rating agency of CSR in Germany, in designing questionnaire about engagement and effectuation of the above three aspects for 684 firms listed on the TWSE. Then, scores of each three dimensions of CSR activities are computed based on respondents’ reply. Finally, companies are ranked according to their total scores of these three aspects. One caveat is worth noting. Firms with the following infamies are eliminated from the rating: negative events challenged by government agencies like Environmental Protection Administration or Council of Labor Affairs; major controversy between the labor and capital, agro with consumers, litigation and departure restriction of CEO; and losses for years.
Once the ranks are yielded in a descending order, the top 25 firms which are elected to confer the "CSR Award" are the CSR firms in this study. We exclude 5 firms from this group which have missing observations during the sample period, making our CSR sample to be 20. Other TWSE-listing companies are defined as non-CSR firms. The first announcement of the "CSR Award" is on May 2005, which determines the starting date of our sample period from June 1, 2005 to August 31, 2009.
Levy (1992, 1998) provided an up-to-date summary of SD and its applications in economics and finance. Besides widely used in the evaluation of performance of investment funds (Levy and Sarnat, 1970; Porter, 1973; Taylor and Yoder, 1999; Kjetsaa and Kieff, 2003; Wong et al., 2008), in finance, the SD approach has been used to study option and futures (Levy, 1985; Lean et al., 2009), the small-firm effect (Seyhun, 1993), portfolio selection (Post, 2003) and anomaly (Fong et al., 2005; Lean et al., 2007; Fong et al., 2008). With the extensive empirical application of SD approach in the literature, there is no doubt that this approach is suitable in analyzing the performance of CSR and non-CSR firms. We believe this will be the first paper using SD approach with the application in CSR issue.
Let F and G be the cumulative distribution functions (CDF) and f and g are the corresponding probability density functions (PDF) of two assets Y and Z respectively with common support of [a, b]. Define
0
H = and h j
( )
x j 1( )
a
H x =
∫
H − t dt for h = f, g , H =F G, and j=1, 2, 3. (1) Essentially, the most commonly-used SD rules correspond with three broadly defined utility functions are first-, second- and third-order SD denoted by FSD, SSD and TSD respectively. Let U be a von-Neumann-Morgenstern utility function. With the assumption that all investors are non-satiation (prefer more to less) that is U'( )
x ≥0, asset Y dominates asset Z at first-order, denoted Y f1Z if and only if F1( )
x ≤G1( )
x .This is because there is less probability of lower outcomes under F than under G for all
outcomes x.
SSD assumes that investors are risk averse with utility functions U'
( )
x ≥0 and( )
0 " x ≤U . Asset Y dominates asset Z at second-order, denoted Yf2 Z if and only if
( )
( )
2 2
F x ≤G x . TSD assumes that investors are risk averse with decreasing absolute risk aversion (DARA), such that utility functions U'
( )
x ≥0, U"( )
x ≤0 and U'"( )
x ≥0(prefer positive skewness). Asset Y dominates asset Z at third-order, denoted Y f3 Z if and only if F3( )
x ≤G3( )
x for all x and Y has higher expected return than Z.If asset Y dominates asset Z at second- and third-order, investors will increase their expected utility by shifting their investments from Y to X. The existence of SD implies that the expected utility of the investor is always higher when holding the dominant asset than holding the dominated one and, consequently, the dominated asset would not be chosen. We note that hierarchical relationship exists in SD (see Levy 1992, 1998): FSD implies SSD, which in turn implies TSD. However, the reverse is not true. As such, we only report the lowest dominance order in practice.
Recent advances in SD techniques allow the statistical significance of SD to be determined. To date, the SD tests have been well developed, for example, see McFadden (1989), Klecan et al. (1991), Kaur et al. (1994), Anderson (1996, 2004), Davidson and Duclos (DD, 2000), Barrett and Donald (2003) and Linton et al. (2005). As documented by Wei and Zhang (2003), Tse and Zhang (2004) and Lean et al. (2008), DD test is powerful and less conservative in size. Moreover, DD test allows the series being examined to be dependent. Thus, we choose to use the DD test in this study.
For any two assets, Y and Z with CDFs F and G respectively and for a grid of pre-selected points x1, x2… xk, the order-j DD test statistics, Tj ( )x (j = 1, 2 and 3), is:
ˆ ˆ ( ) ( ) ( ) ˆ ( ) j j j j F x G x T x V x − = (2) and V xˆj( )=VˆYj( )x +VˆZj( ) 2x − VˆY Zj, ( ),x 1 1 1 ˆ ( ) ( ) , ( 1)! N j j i i H x x h N j − + = = − −
∑
(
)
2( 1) 2 2 1 1 1 , 2 1 1 1 ˆ ( ) ( ) ˆ ( ) , , ; , ; (( 1)!) 1 1 ˆ ˆ ( ) ( ) ˆ ( ) ( ) (( 1)!) N j j H i j i N j j j Y Z i i j j i V x x h H x H F G h y z N N j V x x y x z F x G x N N j − + = − − + + = ⎡ ⎤ = ⎢ − − ⎥ = = − ⎣ ⎦ ⎡ ⎤ = ⎢ − − − ⎥ − ⎣ ⎦∑
∑
where F and j G are defined in (1). It is empirically impossible to test the null j hypothesis for the full support of the distributions. Thus, Bishop et al. (1992) proposed to test the null hypothesis for a pre-designed finite numbers of values x. Specifically, the following hypotheses9 are tested:
9
HA is set to be exclusive of both HA1 and HA2, which means that if either HA1 or HA2 is accepted, we will not say HA
( )
( )
( )
( )
( )
( )
( )
( )
0 1 2 : ( ) ( ) for all , 1, 2,..., ; : ( ) ( ) for some ;: for all , for some ;
: for all , for some .
j i j i i A j i j i i A j i j i i j i j i i A j i j i i j i j i i H F x G x x i k H F x G x x H F x G x x F x G x x H F x G x x F x G x x = = ≠ ≤ < ≥ >
Accepting either H0 or HA implies existence of any SD relationship, non-existence of any arbitrage opportunity between these two assets and neither of these two assets are preferred to one another. However, if H or A1 HA2 of order one is accepted, a particular asset stochastically dominates another asset at first-order. In this situation, arbitrage opportunity can exist and any non-satiated investor will be better off if s/he switches from the dominated asset to the dominant one. On the other hand, if HA1 or
2
A
H is accepted for order two or three, a particular asset stochastically dominates the other at second- or third-order. In this situation, arbitrage opportunity does not exist and switching from one asset to another will only increase investors’ expected utilities, but not wealth (see Jarrow, 1986; Falk and Levy, 1989).
Under the null hypothesis, DD showed that Tj
( )
x is asymptotically distributed asthe Studentized Maximum Modulus (SMM) distribution (see Richmond, 1982) to account for joint test size. To implement the DD test, the test statistic at each grid point is computed and the null hypothesis is rejected if the test statistic is significant at any grid point. The SMM distribution with k and infinite degrees of freedom denoted byM∞k,α and
tabulated by Stoline and Ury (1979) is used to control for the probability of rejecting the overall null hypotheses.
DD test compares the return distributions at a finite number of grid points. Richmond (1982) argued that too many grids will violate the independence assumption required by the SMM distribution while Barrett and Donald (2003) noted that too few grids will miss information of the distributions between any two consecutive grids. Tse and Zhang (2004) suggested that an appropriate choice of k for a reasonably large sample ranges from 6 to
15. To make more detailed comparisons without violating the independence assumption, we follow Fong et al. (2005), Lean et al. (2007) and Wong et al. (2008) to make 10 major partitions with 10 minor partitions within any two consecutive major partitions in each comparison and to make the statistical inference based on the SMM distribution for k =10
and infinite degrees of freedom10. This allows the examination of the consistency of both magnitudes and signs of the DD statistics between any two consecutive major partitions without violating the independent assumption.
According to the GVM, 20 firms have been selected as CSR firms and we categorize
them by sector.11 Thus, there are 12 CSR firms in the electronic sector, we name it as C1,
10 Refer to Lean et al (2008) for the reasoning. Critical value is 3.254 for 5% level of significance tabulated
in Stoline and Ury (1979).
11 They are Taiwan Semiconductor Manufacturing Company, Delta Electronics, Accton Wireless
Broadband Corp, China Motor Corporation, AU Optronics Corp, Advantech, Wah Lee Industrial Corp, Sinyi Realty Inc., Uni-President Enterprises Corporation, E.SUN Financial Holding Co., Chi Mei Optoelectronics, MediaTek Inc., AverMedia Group, Phoenix Precision Technology Corporation, ZyXEL, Hotai Motor Corp, Pou Chen Group, TECO Electric & Machinery Co. and Inventec.
C2,…, C12. For comparison purpose, we choose 10 non-CSR firms with the highest mean returns and 10 non-CSR firms with the lowest standard deviation from the electronic sector. They are named as NC1, NC2, …, NC10 for the highest mean returns group and NC11, NC12, …, NC20 respectively for the lowest standard deviation group. There is only one CSR firm in the trading, finance, food and engineering sectors respectively and we name each firm as C13, C14, C15 and C16. In addition, we name the two CSR firms in the automotive sector as C17 and C18 and the two in other sector as C19 and C20. The sample period of study is from June 1, 2005 to August 31, 2009.
3. 結果與討論
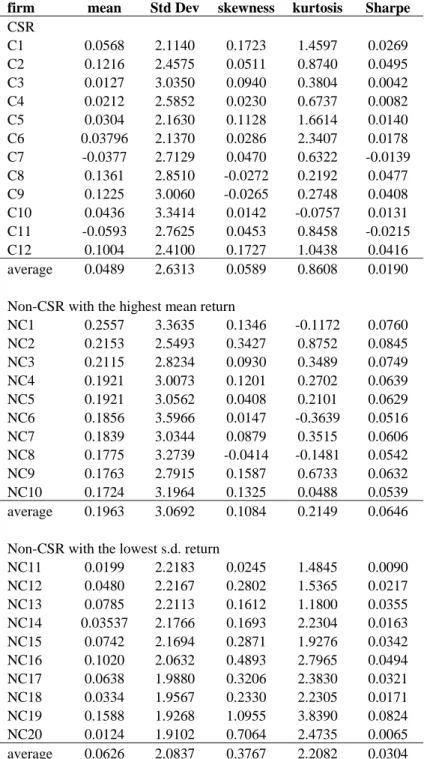
Table 1 exhibits the summary statistics of the stock returns of CSR and non-CSR firms in the electronic sector. There are two CSR firms with negative mean return but none for the selected non-CSR firms over the sample period. The average daily mean return of the CSR firms is lower than the non-CSR firms for both the highest mean and the lowest standard deviation groups whereas its average standard deviation is smaller than the highest mean group but larger than the lowest standard deviation groups. This is consistent with the literature that CSR firms have lower return and lower risk compare to the non-CSR firms. However, these CSR firms also show lower return and higher risk compare to the non-CSR firms in the lowest standard deviation group. In other words, the non-CSR firms are better off than the CSR firms in terms of mean-variance criterion. Based on the Sharpe ratio, non-CSR firms from both groups again perform better than the CSR firms in average. The 10 non-CSR firms in the lowest standard deviation group also have much larger skewness and kurtosis than the CSR firms.
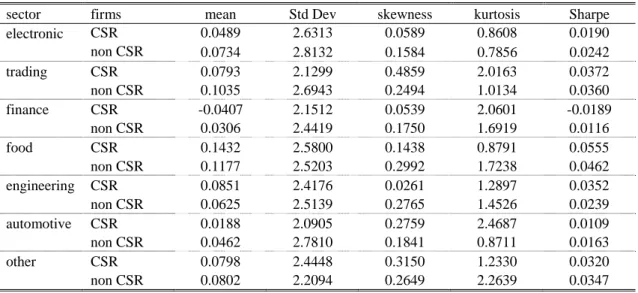
Table 2 exhibits the summary statistics of the returns of CSR and non-CSR firms in all sectors. The summary statistics are based on the average of statistics for all CSR and non-CSR firms in each particular sector. Same as the electronic sector, the average daily mean return of the CSR firms is lower than the non-CSR firms for all sectors besides the engineering and food sectors. Surprisingly the CSR firms in finance sector show negative mean returns during the period. We also find most of the non-CSR firms have higher standard deviation and Sharpe ratio than the CSR firms. Hence, we conclude that non-CSR firms are better off than the non-CSR firms from the descriptive statistics.
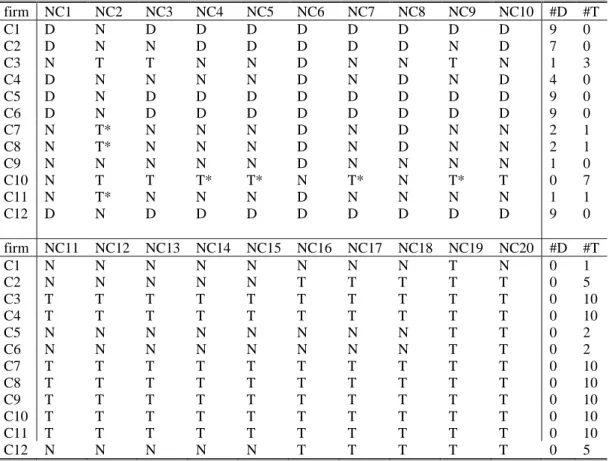
There are 12 CSR firms and 235 non-CSR firms in the electronic sector. We rank the non-CSR firms based on the largest means return and the smallest standard deviations. Then, we do the pairwise SD comparison for the each of the CSR firm with the ‘top ten’ largest means and smallest standard deviations non-CSR firms respectively. For sector other than electronic, there are only one or two CSR firms with the most 31 non-CSR firms in the sector. Thus, we do the pairwise SD comparison for all firms in the sector. Specifically, we apply Eq. (2) with the CSR firm being the first variable (F) and the non-CSR firm being the second variable (G) in the equation. If the non-CSR firm is preferred to the non-CSR firm, there will not be any significantly positive Tj but there will exist some significantly negative Tj.
The SD pairwise results for electronic sector are summarized in Table 3. For the highest mean returns group, some CSR firms dominate non-CSR firms and vice-versa. In general, cases that CSR firm dominates non-CSR firms are more than cases that CSR firm is dominated by CSR firms. An exception, firm C10 do not dominate any non-CSR firms but it is dominated by 7 non-non-CSR firms which 4 of them are FSD. For the
smallest standard deviations group, all CSR firms do not dominate any non-CSR firms but are dominated by at least one non-CSR firms. Interestingly, 7 CSR firms are dominated by all ‘top ten’ of their non-CSR counterparts. This infers that non-CSR firms in the smallest standard deviations group are better off and the risk averse investors would prefer non-CSR firms to CSR firms for maximizing their expected utility.
Table 4 presents the SD pairwise results for non electronic sectors. It is about one third of non-CSR firms dominate their respective CSR counterpart and vice-versa. We note that in the food sector and others sector, the number of non-CSR firms dominate their respective CSR counterpart is more than the number of CSR firms dominate non-CSR firms. Besides trading and automotive sectors, the percentages of dominance are less than half. Hence, the risk averse investors are indifferent between the CSR and non-CSR firms for maximizing their expected utility. Similar to C10 in the electronic sector, C14 in finance sector is dominated by a non-CSR firm at first-order.
Wong et al. (2008) argued that if FSD exists statistically, arbitrage opportunities may not exist, but investors can increase their expected wealth as well as their expected utility if they shift from holding the dominated asset to the dominant one. In general, the FSD should not last for a long period of time because market forces induce adjustments to a condition of no FSD if the market is rational and efficient. In a situation where the FSD holds for a long time and all investors increase their expected wealth by switching their asset choice, then the market is neither efficient nor rational. Another possibility for the existence of FSD to be held for a long period is that investors do not realize that such dominance exists.
The result for CSR firms’ underperformance could be explained by the inefficiency of stock market in Taiwan, that’s firms with less limpid financial information may probably boom the stock price by bluffing sales.10 More well-behaved firms with more transparent financial information does not go this direction and perform less striking performance in stock returns.
Our empirical result supports the shift of focus hypothesis which shows the negative
relationship between CSR and stock returns. We are with the group of Vance (1975), Newgren et al. (1985), Shefrin and Statman (2003), Brammer et al. (2005) and Anginer et al. (2008). We note that there are two studies on Taiwan recently which are Shen and Chang (2009) and Chang (2009). In terms of the performance measure used, this paper is different from Shen and Chang (2009) which used the accounting-based measure but is same as Chang (2009). We improve from Chang (2009) that employed the regression analysis which may suffer from the normality assumption. Besides the consistent negative relationship is found, this paper offers additional evidence for comparison of firms in different sectors.
In this paper, we employ SD approach to examine the relative stock market performance between CSR and non-CSR firms on the TWSE-listed companies. Based on our empirical result, little evidence shows outperformance of CSR firms, on the contrary, some of the non-CSR firms are stochastically dominance the CSR firms. Our empirical
10
According to Shen (2002), when the products of a company are not sold out, the company sells the products to its subsidiaries, which are not listed in the stock market and hence are not responsible to the public. The fake increase in sale of the mother company stimulates its stock price. The company then uses the high price of stock as collateral to borrow more money from banks. Revenue from the product sale is recorded as "accounts receivable" in the company’s balance sheet, but the cash will never come in. The growing sales generate no profit.
evidence of Taiwan is likely to support the shift of focus hypothesis. We may conclude that CSR is not really a matter for the risk-averse investors in Taiwan for their investment decision making.
Why CSR firms underperform the non-CSR firms in TWSE relative to the stock return? According to Chang (2009), on the average, the accounting performance indicators (such as ROA, ROE and EPS) of CSR firms are better than the non-CSR firms, but reverse in the market performance indicators. The reason behind is stock market in Taiwan does not price CSR, that is the investors are more concern about the bottom lines of a company than whether they are doing a good thing.
As this paper is just examining the stock returns without considering and analyzing the financial characteristics between two groups of firms, their systematic difference on financial profile could explain why their stock returns are different. Further research could add controls such as classical factors of Fama and French (1993) and Chan et al. (1997).
參考文獻
Alexander, G. J. and R. A. Buchholz: 1978, ‘Corporate Social Performance and Stock Market Performance’, Academy of Management Journal 21, 479-486.
Anderson, G.: 1996, ‘Nonparametric Tests of Stochastic Dominance in Income Distributions’, Econometrica 64, 1183-1193.
Anderson, G.: 2004, ‘Toward an Empirical Analysis of Polarization’, Journal of Econometrics 122, 1-26.
Anderson, J. and G. Smith: 2006, ‘A Great Company Ban be a Great Investment’,
Financial Analysts Journal July/August, 86-93.
Anginer, D., K. L. Fisher and M. Statman: 2008, ‘Stocks of Admired Companies and Despised Ones’, Working Paper.
Antunovich, P., D. Laster and S. Mitnick: 2000, ‘Are Quality Firms also High-Quality Investments?’, Current Issues in Economics and Finance 6, 1-6.
Aupperle, K., A. Carroll, and J. Hatfield: 1985, ‘An Empirical Examination of the Relationship between Corporate Social Responsibility and Profitability’, Academy of Management Journal 28, 446-463.
Barrett, G. F. and S. G. Donald: 2003, ‘Consistent Tests for Stochastic Dominance’,
Econometrica 71, 71-104.
Becchetti, L., R. Ciciretti and I. Hasan: 2007, ‘Corporate Social Responsibility and Shareholder’s Value: An Event Study Analysis’, Working Paper, Federal Reserve Bank of Atlanta.
Bishop, J. M. and P. Torr: 1992, The Stochastic Search Network, In Lingard, R., Myers, D.J., Nightingale, C.: Neural Networks for Images, Speech and Natural Language. Chapman and Hall, New York, 370-387.
Bragdon, J. and J. Marlin: 1972, "Is Pollution Profitable?’, Risk Management 19, 9-18.
Brammer, S., C. Brooks and S. Pavelin: 2005, ‘Corporate Social Performance and Stock Returns: UK Evidence from Disaggregate Measures’, Financial Management 35,
Bowman, E. H. and M. Haire: 1975, ‘A Strategic Posture toward Corporate Social Responsibility’, California Management Review 18, 49-58.
Chan, L., N. Jegadeesh and J. Lakonishok: 1997, ‘Momentum Strategies’, Journal of Finance 51, 1681-1713.
Chang, Y. (2009), ‘Corporate Social Responsibility and Financial Performance-Empirical Evidence from Taiwan’, Journal of Social Science 3, 57-120.
Chih, H. L., C. H. Shen and F. C. Kang: 2008, ‘Corporate Social Responsibility, Investor Protection, and Earnings Management: Some International Evidence’, Journal of Business Ethics 79, 179-198.
Cochran, P. L. and R. A. Wood: 1984, ‘Corporate Social Responsibility and Financial Performance’, Academy of Management Journal 27, 42–56.
Cornell, B. and A. C. Shapiro: 1987, ‘Corporate Stakeholder and Corporate Finance’,
Financial Management 16, 5-14.
Davidson, R. and J. Y. Duclos: 2000, ‘Statistical Inference for Stochastic Dominance and for the Measurement of Poverty and Inequality’, Econometrica 68, 1435-1464.
Derwall, J., N. Günster., R. Bauer and K. Koedijk: 2004, ‘The Eco-Efficiency Premium Puzzle’, Mimeo. Rotterdam School of Management, Erasmus University.
Falk, H. and H. Levy: 1989, ‘Market Reaction to Quarterly Earnings' Announcements: A Stochastic Dominance Based Test of Market Efficiency’, Management Science 35,
425-446.
Fama, E. and K. French: 1993, ‘Common Risk Factors in the Returns on Stocks and Bonds’, Journal of Financial Economics 33, 3-56.
Fong, W. M.: 2009, ‘Speculative Trading and Stock Returns: A Stochastic Dominance Analysis of the Chinese A-share market’, Journal of International Financial Markets, Institutions & Money 19, 712-727.
Fong, W. M., Wong, W. K., and H. H. Lean: 2005, ‘International momentum strategies: A stochastic dominance approach’, Journal of Financial Markets 8, 89-109.
Fong, W. M., H. H. Lean and W. K. Wong: 2008, ‘Stochastic Dominance and Behavior towards Risk: The Market for Internet Stocks’, Journal of Economic Behavior & Organization 68, 194-208.
Friedman, M.: 1970, ‘The Social Responsibility of Business Is to Increase Its Profits’,
The New York Times Magazine 13, September.
Hadar J. and W. R. Russell: 1969, ‘Rules for Ordering Uncertain Prospects’, American Economic Review 59, 25-34.
Hanoch G., H. Levy: 1969, ‘The Efficiency Analysis of Choices Involving Risk’, Review of Economic Studies 36, 335-346.
Jarrow, R.: 1986, ‘The Relationship between Arbitrage and First Order Stochastic Dominance’, Journal of Finance 41, 915-921.
Kaur, A., B. L. Rao and H. Singh: 1994, ‘Testing for Second-order Stochastic Dominance of Two Distributions’, Econometric Theory 10, 849-866.
Kjetsaa, R. and M. Kieff: 2003, ‘Stochastic Dominance Analysis of Equity Mutual Fund Performance’, American Business Review 21, 1-8.
Klecan, L., R. McFadden and D. McFadden: 1991, ‘A Robust Test for Stochastic Dominance’, Working Paper, MIT & Cornerstone Research.
Lean, H. H., R. Smyth and W. K. Wong: 2007, ‘Revisiting Calendar Anomalies in Asian Stock Markets Using a Stochastic Dominance Approach’, Journal of Multinational Financial Management 17, 125-141.
Lean, H. H., W. K. Wong and X. B. Zhang: 2008, ‘Size and Power of Some Stochastic Dominance Tests: A Monte Carlo Study for Correlated and Heteroskedastic Distributions’, Mathematics and Computers in Simulation 79, 30-48.
Lean, H. H., D. Lien and W. K. Wong: 2009, ‘Futures versus Stocks: A Stochastic Dominance Study in Malaysian Markets’, Advances in Investment Analysis and Portfolio Management, forthcoming.
Levy, H.: 1985, ‘Upper and Lower Bounds of Put and Call Option Value: Stochastic Dominance Approach’, Journal of Finance 40, 1197-1217.
Levy, H.: 1992, ‘Stochastic Dominance and Expected Utility: Survey and Analysis’,
Management Science 38, 555-593.
Levy, H.: 1998, Stochastic Dominance: Investment Decision Making under Uncertainty, Kluwer Academic Publishers, US.
Levy, H. and M. Sarnat: 1970, ‘Alternative Efficiency Criteria: An Empirical Analysis’,
Journal of Finance 25, 1153-1158.
Linton, O., E. Maasoumi and Y. J. Whang: 2005, ‘Consistent Testing for Stochastic Dominance under General Sampling Schemes’, Review of Economic Studies 72,
735-765.
McFadden, D.: 1989, ‘Testing for Stochastic Dominance’, in Fomby, T. and T. Seo (eds), Studies in the Economics of Uncertainty, Springer Verlag, New York, 113-132. Moskowitz, M. R.: (1972), ‘Choosing Socially Responsible Stocks’, Business and Society
Review 1, 71-75.
Mahoney, L. and R. W. Roberts: 2007, ‘Corporate Social Performance, and Financial Performance and Institutional Ownership in Canadian Firms’, Accounting Forum 31,
233-253.
Makni, R., C. Francoeur and F. Bellavance: 2008, ‘Causality Between Corporate Social Performance and Financial Performance: Evidence from Canadian Firms’, Journal of Business Ethics 89, 409-422.
McGuire, J.B., A. Sundgren and T. Schneeweiss: 1988, ‘Corporate social responsibility and firm financial performance. Academy of Management Journal 31, 854–872.
Newgren, K., A, Rasher., M. LaRoe and M. Szabo: 1985, ‘Environmental Assessment and Corporate Performance: A Longitudinal Analysis Using Market-Deter-mined Performance Measures’, L. E. Preston (ed.), Research in Corporate Social Performance and Policy, 7, 153-164.
Orlitzky, M.: 2001, ‘Does Organizational Size Confound the Relationship between Sorporate Social Performance and Firm Financial Performance?’, Journal of Business Ethics 33, 167-180.
Parket, I. R. and H. Eilbirt: 1975, ‘Social Responsibility: The Underlying Factors’,
Business Horizons 18, 5-10.
Peloza, J.: 2006, ‘Using Corporate Social Responsibility As Insurance for Financial Performance’, California Management Review 48, 52-72.
Porter, R.B.: 1973, ‘An Empirical Comparison of Stochastic Dominance and Mean-Variance Portfolio Choice Criteria’, Journal of Financial and Quantitative Analysis 8,
587-608.
Post, T.: 2003, ‘Empirical Tests for Stochastic Dominance Efficiency’, Journal of Finance 58, 1905-1931.
Preston, L. E. and P. O'Bannon: 1997, ‘The Corporate Social-Financial Performance Relationship’, Business and society 36, 419-429.
Richmond, J.: 1982, ‘A General Method for Constructing Simultaneous Confidence Intervals’, Journal of the American Statistical Association 77, 455-460.
Rothschild, M. and J. E. Stiglitz: 1970, ‘Increasing Risk I. A Definition’, Journal of Economic Theory 2, 225-243.
Ruf, B. M., K. Muralidhar., R. M. Brown., J. J. Janney and K. Paul: 2001, ‘An Empirical Investigation of the Relationship between Change in Corporate Social Performance and Financial Performance: A Stakeholder Theory Perspective’, Journal of Business Ethics 32, 143-156.
Saleha, M., N. Zulkifli and R. Muhamad: 2008, ‘An Empirical Examination of the Relationship between Corporate Social Responsibility Disclosure and Financial Performance in an Emerging Market’, working paper.
Scholtens, B.: 2008. ‘A note on the interaction between corporate social responsibility and financial performance’, Ecological Economics 68, 46-55.
Seyhun, H.N.: 1993. ‘Can Omitted Risk Factors Explain the January Effect? A Stochastic Dominance Approach’, Journal of Financial and Quantitative Analysis 28,195-212.
Shefrin, H. and M. Statman: 2003, ‘Style of Investment Expectation’, The Handbook of Equity and Style Management, Coggin & Fabozzi eds. New York: Wiley.
Shen, C. H.: 2002, Credit-Rationing for Bad Companies in Bad Years- Evidence from Bank Loan Transaction Data’, International Journal of Finance and Economics 7,
261-278.
Shen, C. H. and Y. Chang: 2009, ‘Ambition versus Conscience, does Corporate Social
Responsibility Pay off? - The Application of Matching Methods’, Journal of
Business Ethics 88, 133-153.
Soloman, R. and K. Hansen: 1985, ‘It’ s Good Business’, Atheneum, New York.
Stanwick, P. A. and S. D. Stanwick: 1998, ‘The Relationship between Corporate Social Performance, and Organizational Size, Financial Performance, and Environmental Performance: An Empirical Examination’, Journal of Business Ethics 17, 195-204.
Stoline, M. R. and H. A. Ury: 1979. ‘Tables of the Studentised Maximum Modulus Distribution and an Application to Multiple Comparisons among Means’,
Technometrica 21, 87-93.
Taylor, W. R. and J. A. Yoder: 1999, ‘Load and No-load Mutual Fund Dynamics during the 1987 Market Crash: A Stochastic Dominance Analysis’, Journal of Economics and Finance 23, 255-265.
Tse, Y. K. and X. Zhang: 2004, ‘A Monte Carlo Investigation of Some Tests for Stochastic Dominance’, Journal of Statistical Computation and Simulation 74,
361-378.
Tsoutsourz, M.: 2004, ‘Corporate Social Responsibility and Financial Performance’, Applied Financial Project, Berkeley, California.
Turban, D. B. and D. W. Greening: 1997, ‘Corporate Social Performance and Organizational Attractiveness to Prospective Employees’, Academy of Management Journal 40, 658-672.
Ullmann, A.: 1985, ‘Data in Search of a Theory: A Critical Examination of the Relationship among Social Performance, Social Disclosure, and Economic Performance’, Academy of Management Review 10, 540-577.
Vance, S.: 1975, ‘Are Socially Responsible Firms Good Investment Risks?’,
Management Review 64, 18-24.
Wei, S. and C. Zhang: 2003, ‘Statistical and Economic Significance of Stock Return Predictability: A Mean-Variance Analysis’, Journal of Multinational Financial Management 13, 443-463.
Whitmore, G. A.: 1970, ‘Third-degree Stochastic Dominance’, American Economic
Review 60, 457-459.
Waddock, S. and S. Graves: 1997, ‘The Corporate Social Performance-Financial Performance Link’, Strategic Management Journal 18, 303-319.
Werther, W. and D. Chandler: 2005, ‘Strategic Corporate Social Responsibility as Global Brand Insurance’, Business Horizons 48, 317-324.
Wong, W. K., K. F. Phoon and H. H. Lean: 2008, ‘Stochastic Dominance Analysis of Asian Hedge Funds’, Pacific Basin Finance Journal 16, 204-223.
Table 1 Descriptive Statistics for CSR and Non-CSR firms in the Electronic Sector
firm mean Std Dev skewness kurtosis Sharpe
CSR C1 0.0568 2.1140 0.1723 1.4597 0.0269 C2 0.1216 2.4575 0.0511 0.8740 0.0495 C3 0.0127 3.0350 0.0940 0.3804 0.0042 C4 0.0212 2.5852 0.0230 0.6737 0.0082 C5 0.0304 2.1630 0.1128 1.6614 0.0140 C6 0.03796 2.1370 0.0286 2.3407 0.0178 C7 -0.0377 2.7129 0.0470 0.6322 -0.0139 C8 0.1361 2.8510 -0.0272 0.2192 0.0477 C9 0.1225 3.0060 -0.0265 0.2748 0.0408 C10 0.0436 3.3414 0.0142 -0.0757 0.0131 C11 -0.0593 2.7625 0.0453 0.8458 -0.0215 C12 0.1004 2.4100 0.1727 1.0438 0.0416 average 0.0489 2.6313 0.0589 0.8608 0.0190
Non-CSR with the highest mean return
NC1 0.2557 3.3635 0.1346 -0.1172 0.0760 NC2 0.2153 2.5493 0.3427 0.8752 0.0845 NC3 0.2115 2.8234 0.0930 0.3489 0.0749 NC4 0.1921 3.0073 0.1201 0.2702 0.0639 NC5 0.1921 3.0562 0.0408 0.2101 0.0629 NC6 0.1856 3.5966 0.0147 -0.3639 0.0516 NC7 0.1839 3.0344 0.0879 0.3515 0.0606 NC8 0.1775 3.2739 -0.0414 -0.1481 0.0542 NC9 0.1763 2.7915 0.1587 0.6733 0.0632 NC10 0.1724 3.1964 0.1325 0.0488 0.0539 average 0.1963 3.0692 0.1084 0.2149 0.0646
Non-CSR with the lowest s.d. return
NC11 0.0199 2.2183 0.0245 1.4845 0.0090 NC12 0.0480 2.2167 0.2802 1.5365 0.0217 NC13 0.0785 2.2113 0.1612 1.1800 0.0355 NC14 0.03537 2.1766 0.1693 2.2304 0.0163 NC15 0.0742 2.1694 0.2871 1.9276 0.0342 NC16 0.1020 2.0632 0.4893 2.7965 0.0494 NC17 0.0638 1.9880 0.3206 2.3830 0.0321 NC18 0.0334 1.9567 0.2330 2.2305 0.0171 NC19 0.1588 1.9268 1.0955 3.8390 0.0824 NC20 0.0124 1.9102 0.7064 2.4735 0.0065 average 0.0626 2.0837 0.3767 2.2082 0.0304
Table 2 Summary Statistics for CSR and Non-CSR firms in All Sectors
sector firms mean Std Dev skewness kurtosis Sharpe electronic CSR 0.0489 2.6313 0.0589 0.8608 0.0190 non CSR 0.0734 2.8132 0.1584 0.7856 0.0242 trading CSR 0.0793 2.1299 0.4859 2.0163 0.0372 non CSR 0.1035 2.6943 0.2494 1.0134 0.0360 finance CSR -0.0407 2.1512 0.0539 2.0601 -0.0189 non CSR 0.0306 2.4419 0.1750 1.6919 0.0116 food CSR 0.1432 2.5800 0.1438 0.8791 0.0555 non CSR 0.1177 2.5203 0.2992 1.7238 0.0462 engineering CSR 0.0851 2.4176 0.0261 1.2897 0.0352 non CSR 0.0625 2.5139 0.2765 1.4526 0.0239 automotive CSR 0.0188 2.0905 0.2759 2.4687 0.0109 non CSR 0.0462 2.7810 0.1841 0.8711 0.0163 other CSR 0.0798 2.4448 0.3150 1.2330 0.0320 non CSR 0.0802 2.2094 0.2649 2.2639 0.0347
Table 3 SD Tests Results between CSR and Non-CSR Firms in the Electronic Sector firm NC1 NC2 NC3 NC4 NC5 NC6 NC7 NC8 NC9 NC10 #D #T C1 D N D D D D D D D D 9 0 C2 D N N D D D D D N D 7 0 C3 N T T N N D N N T N 1 3 C4 D N N N N D N D N D 4 0 C5 D N D D D D D D D D 9 0 C6 D N D D D D D D D D 9 0 C7 N T* N N N D N D N N 2 1 C8 N T* N N N D N D N N 2 1 C9 N N N N N D N N N N 1 0 C10 N T T T* T* N T* N T* T 0 7 C11 N T* N N N D N N N N 1 1 C12 D N D D D D D D D D 9 0 firm NC11 NC12 NC13 NC14 NC15 NC16 NC17 NC18 NC19 NC20 #D #T C1 N N N N N N N N T N 0 1 C2 N N N N N T T T T T 0 5 C3 T T T T T T T T T T 0 10 C4 T T T T T T T T T T 0 10 C5 N N N N N N N N T T 0 2 C6 N N N N N N N N T T 0 2 C7 T T T T T T T T T T 0 10 C8 T T T T T T T T T T 0 10 C9 T T T T T T T T T T 0 10 C10 T T T T T T T T T T 0 10 C11 T T T T T T T T T T 0 10 C12 N N N N N T T T T T 0 5 Note:
D means “dominates at second-order and order”; T means “is dominated at second-order and third-order”; N means “no stochastic dominance” and * refers to first-order dominance. For example, C1 “D” NC1 means firm C1 dominates firm NC1 at second-order and third-order; C1 “N” NC2 means there is no stochastic dominance between C1 and NC2; C3 “T” NC2 means firm C3 is dominated by firm NC2 at second-order and third-order. #D means number of non-CSR firms that is dominated by the particular CSR firm; #T means number of non-CSR firms that dominates the particular CSR firm. For example, row number one shows firm C1 dominates 11 non-CSR firms and do not dominated by any non-CSR firms.
Table 4 DD Tests Results between CSR and Non-CSR Firms in the Non-Electronic Sectors
Sector Company Number of non CSR firms in the sector #D #T trading C13 5 4 (80) 1 (20) finance C14 31 12 (39) 5* (16) food C15 15 2 (13) 5 (33) engineering C16 25 5 (20) 2 (8) automotive C17 2 1 (50) 0 (0) C18 - 2 (100) 0 (0) others C19 23 4 (17) 11 (48) C20 - 6 (26) 9 (39) Total 101 36 33 Note:
#D means number of non-CSR firms that is dominated by the particular CSR firm; #T means number of non-CSR firms that dominates the particular CSR firm. For example, row number one shows firm C1 in trading sector dominates 4 non-CSR firms and is dominated by one non-CSR firms. * shows there is a first-order dominance by one of the non-CSR firms. Figure in parenthesis is the percentage of dominance.
國科會補助計畫衍生研發成果推廣資料表
日期:2011/10/21國科會補助計畫
計畫名稱: 企業社會責任與股票報酬─隨機優勢方法 計畫主持人: 張元 計畫編號: 99-2410-H-032-052- 學門領域: 財務無研發成果推廣資料
99 年度專題研究計畫研究成果彙整表
計畫主持人:張元 計畫編號: 99-2410-H-032-052-計畫名稱:企業社會責任與股票報酬─隨機優勢方法 量化 成果項目 實際已達成 數(被接受 或已發表) 預期總達成 數(含實際 已達成數) 本計畫實 際貢獻百 分比 單位 備註(質 化 說 明:如 數 個 計 畫 共 同 成 果 、 成 果 列 為 該 期 刊 之 封 面 故 事 ... 等) 期刊論文 0 0 100% 研究報告/技術報告 0 0 100% 研討會論文 1 0 100% 篇 Corporate Social Responsibility and Stock Returns-Stochastic Dominance Approach. 發咬於第十一屆全國 實證經濟學論文研討 會,2010 年 5 月 22 日 於輔仁大學舉行. 論文著作 專書 0 0 100% 申請中件數 0 0 100% 專利 已獲得件數 0 0 100% 件 件數 0 0 100% 件 技術移轉 權利金 0 0 100% 千元 碩士生 1 0 100% 博士生 0 0 100% 博士後研究員 0 0 100% 國內 參與計畫人力 (本國籍) 專任助理 0 0 100% 人次 期刊論文 1 0 100% Corporate Social Responsibility and Stock Returns - Stochastic Dominance Approach. 發 表 於 African Journal of Business Management, 5, pp. 1277-1285. 【 SSCI 】 (NSC 99-2410-H-032-052-) 研究報告/技術報告 0 0 100% 研討會論文 0 0 100% 篇 論文著作 國外已獲得件數 0 0 100% 件數 0 0 100% 件 技術移轉 權利金 0 0 100% 千元 碩士生 0 0 100% 博士生 0 0 100% 博士後研究員 0 0 100% 參與計畫人力 (外國籍) 專任助理 0 0 100% 人次 其他成果
(
無 法 以 量 化 表 達 之 成 果 如 辦 理 學 術 活 動、獲得獎項、重要 國際合作、研究成果 國際影響力及其他協 助產業技術發展之具 體效益事項等,請以 文字敘述填列。) 無 成果項目 量化 名稱或內容性質簡述 測驗工具(含質性與量性) 0 課程/模組 0 電腦及網路系統或工具 0 教材 0 舉辦之活動/競賽 0 研討會/工作坊 0 電子報、網站 0 科 教 處 計 畫 加 填 項 目 計畫成果推廣之參與(閱聽)人數 0國科會補助專題研究計畫成果報告自評表
請就研究內容與原計畫相符程度、達成預期目標情況、研究成果之學術或應用價
值(簡要敘述成果所代表之意義、價值、影響或進一步發展之可能性)
、是否適
合在學術期刊發表或申請專利、主要發現或其他有關價值等,作一綜合評估。
1. 請就研究內容與原計畫相符程度、達成預期目標情況作一綜合評估
■達成目標
□未達成目標(請說明,以 100 字為限)
□實驗失敗
□因故實驗中斷
□其他原因
說明:
2. 研究成果在學術期刊發表或申請專利等情形:
論文:■已發表 □未發表之文稿 □撰寫中 □無
專利:□已獲得 □申請中 ■無
技轉:□已技轉 □洽談中 ■無
其他:(以 100 字為限)
3. 請依學術成就、技術創新、社會影響等方面,評估研究成果之學術或應用價
值(簡要敘述成果所代表之意義、價值、影響或進一步發展之可能性)(以
500 字為限)
本計畫利用 Davidson and Duclos (2000)所發展的隨機優勢檢定法檢驗台灣上市公司中社 會責任公司與非社會責任公司的股票報酬差異.基於每支股票的每日資料,隨機優勢方法 考量了所有股價的出象值而不需考量其統計分配,因而可以檢驗出到底社會責任公司的股 票報酬率表現是否相對優於非社會責任公司,即是否社會責任公司的股票報酬表現的累積 機率密度函數相對出現在非社會責任公司的右側.隨機優勢方法在檢驗基金報酬,特定事 件對股票報酬之影響以及企業購併對雙方股票報酬影響的研究上已被大量的應用.本研究 基於投資人財富極大的原則,採用此方法來評估投資在持有社會責任公司上的相對獲利, 來判斷是否社會責任投資,從投資人的角度來看,是一個可持續的發展.本計畫的實證分析 發現,社會責任型公司的股票報酬並未全面且顯著地優於非社會責任型公司,相反地,有部 分非社會責任型公司的股票報酬相對較優.本文的實證結果傾向支持文獻中所謂的中立假 說,即社會責任行為對公司績效的平均影響不顯著.本計畫採用的研究方法可以推廣至更 長的資料,金融機構的社會責任議題檢驗,以及社會責任基金與非社會責任基金的績效評 比上.