國立交通大學
應用化學系分子科學碩士班
碩士論文
開發「活體動物自體螢光成像技術」應用於大
鼠肝臟缺血再灌流傷害研究
Probing Hepatic Ischemia-Reperfusion of Rats
with Intravital Autofluorescence Microscopy
研究生: Hsueh-Han Lu (呂學翰)
指導教授: Dr. Ian Liau (廖奕翰 博士)
開發「活體動物自體螢光成像技術」應用於大鼠肝臟缺血再
灌流傷害研究
Probing Hepatic Ischemia-Reperfusion of Rats with Intravital
Autofluorescence Microscopy
研 究 生:呂學翰 Student:Hsueh-Han Lu
指導教授:廖奕翰 博士 Advisor:Dr. Ian Liau
國 立 交 通 大 學
應用化學系分子科學研究所
碩 士 論 文
A thesis submitted to the Institute of Molecular Science, College of Science
National Chiao Tung University
In partial fulfillment of the requirements for the Degree of Master in the Institute of Molecular Science
January 2011 Hsinchu, Taiwan
中華民國一百年一月
開發「活體動物自體螢光成像技術」應用於大鼠
肝臟缺血再灌流傷害研究
學生:呂學翰 指導教授:廖奕翰 博士 國立交通大學 應用化學系分子科學碩士班 摘要 缺血再灌流損傷 (ischemia-reperfusion injury) 是指暫時缺血的器官組織在 恢復血液供給後加劇傷害的現象。缺血再灌流損傷是腦中風、心肌梗塞或是器官 移植手術的主要併發症。利用光學顯微鏡檢查切片的病理組織是目前判斷缺血再 灌流損傷的主要方法。病理切片檢查只能提供損傷後組織傷害的嚴重程度,但無 法提供即時資訊幫助醫師或研究人員判斷缺血的器官在再灌流後不同階段的損 傷情形;此外,執行切片的過程也無可避免會造成組織額外的損傷。在此,我們 改裝雷射掃描式共軛焦顯微鏡 (confocal laser scanning microscope),開發「活體動物光學成像系統」,以大鼠為模型動物,研究肝臟的缺血再灌流傷害。我們應 用波長 445 nm 之雷射作為光源,激發並記錄肝臟組織內細胞之自體螢光訊號以 形成影像,即時觀察大鼠肝臟在缺血再灌流過程之變化。我們的結果顯示,肝臟 組織的整體螢光強度在缺血階段會快速的下降至基線值 (base line) 的 50 % ~ 60 %,而在恢復血液供給的階段,整體螢光強度會逐漸上升。螢光強度回復的速 度以及程度與缺血時間長短相關。短暫缺血 (20 分鐘) 時,螢光強度約在 10 分 鐘内逐漸上升至基線值的 90 %,組織也不會出現微血管堵塞的無復流 (no-reflow) 現象;而組織長時間缺血 (> 60 分鐘) 時,螢光強度的上升較慢,上升的趨勢也 較不規律。更重要的是在長時間缺血後,我們直接觀察到部份組織出現間歇性甚 至長時間的微血管堵塞。為釐清自體螢光的來源以及螢光在缺血再灌流傷害過程 變化的原因,我們也建立細胞的灌流系統在體外 (in vitro) 模擬缺血再灌流過 程,觀察肝細胞株在缺氧再灌流條件下之自體螢光變化。我們發現在添加黃素蛋 白 (flavoprotein) 抑制劑 (diphenyleneiodonium chloride) 與粒線體電子傳遞鏈抑
制劑 (antimycin A) 後,自體螢光約有 40 %的下降。此結果說明,在我們的實 驗條件之下,粒線體中的黃素蛋白是細胞自體螢光的主要來源。比較肝臟組織、 肝細胞以及黃素分子 (flavin) 的螢光光譜也支持此假說。根據以上結果我們更進 一步假設動物實驗觀察到的自體螢光變化是由於粒線體中黃素蛋白的黃素分子 在缺血再灌流過程,在可發螢光的氧化態與不可發螢光的還原態之間轉換所造 成。
Probing Hepatic Ischemia-Reperfusion of Rats with
Intravital Autofluorescence Microscopy
Student: Hsueh-Han Lu Advisor: Dr. Ian Liau Institute of Molecular Science National Chiao-Tung University
ABSTRACT
Ischemia-reperfusion injury refers to the increased damage occurring to the tissue during reperfusion after a period of ischemia. Ischemia-reperfusion has long been recognized as the major complication of cardiac arrest, stroke, and organ transplantation, and remains one of the most active topics in fundamental biomedical research. The ability to evaluate timely the damage of tissue caused by ischemia-reperfusion is essential to understand to the pathogenesis. The knowledge produced is also important for the development of interventions to prevent or cure ischemia-reperfusion injury. By far, post-reperfusion histopathological examination remains a commonly employed method to assess ischemia-reperfusion injury. We have developed a minimally invasive, label-free, and real-time means to assess ischemia-reperfusion injury. By using an intravital microscope, we have obtained time-lapse autofluorescence images of rat liver during ischemia and reperfusion. We found the autofluorescence of the liver tissue decreased by 40-50 % rapidly during ischemia, but restored gradually during reperfusion. The rate and extent of recovery of the autofluorescence intensity during reperfusion depended strongly on the duration of ischemia. The autofluorescence intensity recovered to 90 % of the base line asymptotically and rapidly (<10 min) for short ischemia (20 min). In contrast, the recovery of the autofluorescence images exhibited heterogeneous patterns and the rate of recovery was significantly slower for long ischemic time (> 60 min). Moreover, we observed occasional or long-lasting no-reflow in some regions of this tissue. To
elucidate the origin of the autofluorescence and to account the observation, we employed control experiments with inhibitors of mitochondria and flavin, and the results strongly suggested that the autofluorescence was produced from flavin bound to mitochondrial proteins. Based on the results, we further hypothesized that the spatiotemporal variation of autofluorescence images observed during ischemic-reperfusion was attributed to the conversion of flavin between the non-fluorescent reduced state and fluorescent oxidized state.
Acknowledgements
During the two years of my postgraduate study, I am very glad to work with many people, to share different points of view in various kinds of knowledge, and to have chances to study subjects of novelty. Although things did not always proceed smoothly, fortunately, I have learned to think widely, to plan comprehensively, and to manage tasks carefully so that I was able to conquer difficulties.
Here, I would like to deeply appreciate my advisor, Prof. Ian Liau, for training me to analyze problems, to solve difficulties systematically and efficiently, teaching me what a right attitude towards things should be, taking much patience to discuss with me, and helping me in my research work.
Also, I am very grateful to all lab mates, Hung-Lung Lin, Hsin-Lan Yen, Hung-Che Chen, Jhen-Wei Jhan, Huei-Jen Lin, Yi-Cyun Yang, Wan-Yu Tai, Chia-Jen Chang, Shih-Hao Huang, Yi-Ling Cheng, David Yu, Aungtinee Kittiravechote, Kai-Ho Wang, Shao-Kang Huang, Hsin-Chun Huang, Cho-Yen Chou, Tzu-Chen Kuo, Yun-Tsai Li, Yu-Cheng Lai, Yen-Ting Li, Shih-Hung Chuang, I-Lin Li, Mei-Fang Chen, Yu-Chia Chang, Yu-Chun Chang, Chun-Yen Liao, Chun-Chieh Wang, Sung-Yi Weng, Yu-Hsiang Wang, Hung-Te Cho, Shao-Chun Wang, and Yi-Fang Wu for their assistance and discussion, selfless sharing, and accompanying. And I want to thank Chia-Chi Chen for her professional and selfless assistance in animal experiments.
Furthermore, I want to appreciate the committee members of my thesis defense, Prof. Hsin-Yun Hsu, Dr. Yao-Ming Wu, and Dr. Wei-Tien Chang, for their invaluable advice and suggestions on my master work.
Finally, I would like to specially appreciate my family and my girl friend, Emma Li, in full support, not only in materials but also in spirit. Their kind and warm support comprises the main driving force that pushes me to move forward without any
much apprehension and hesitation.
The aforementioned great supports and assistances which I earned during my postgraduate study have helped me to see more and to walk further in the past, and will definitely do the same in the future.
Table of Contents
Page
Abstract (Chinese) ... i
Abstract (English) ... iii
Acknowledgement ... v
Table of Contents ... vii
List of Figures ... ix
1 Introduction ... 1
1.1 Ischemia-reperfusion injury ... 1
1.2 Autofluorescence ... 3
1.3 Literature review ... 5
1.4 Motivation and objectives ... 7
2 Materials and Methods ... 11
2.1 Reagents ... 11
2.2 Animals and feeding protocols ... 11
2.3 Rat model of hepatic ischemia and reperfusion ... 11
2.4 Culturing of mouse hepatocytes ... 12
2.5 Simulated ischemia and reperfusion of mouse hepatocytes ... 12
2.6 Inhibitory assays of mitochondrial electron transport chain and flavoproteins ... 13
2.7 Isolation of mitochondria from rat liver ... 13
2.8 Intravital autofluorescence imaging and spectroscopy ... 13
2.9 Image analysis ... 15
2.10 Statistical methods ... 15
3 Results and Discussion ... 21
ischemia and reperfusion ... 21 3.2 Time-lapse autofluorescence images of mouse hepatocytes subject to
simulated ischemia-reperfusion ... 23 3.3 The source of change of cellular fluorescence during ischemia and
reperfusion ... 25
4 Conclusions ... 42 References ... 43
List of Figures
Page Figure 1.1 Figure 1.2 Figure 2.1 Figure 2.2 Figure 2.3 Figure 2.4 Figure 2.5 Figure 3.1 Figure 3.2 Figure 3.3 Figure 3.4 Figure 3.5 Figure 3.6 Figure 3.7 Figure 3.8Schematic of ischemia-reperfusion injury. ... 9
The change of main structure of flavin in the redox reaction. ... 10
Changes in rat liver before and after ischemia. ... 16
The actual situation of the rat during experiment process. ... 17
Installation of homemade perfusion chamber. ... 18
Schematic of the experimental apparatus for autofluorescence and bright-field imaging, and measurements of emission spectra of living animals and the hepatocytes. ... 19
Correction of the photobleaching induced decrease of hepatic autofluorescence intensity. ... 20
Autofluorescence spectrum of rat liver under 445 nm excitation. ... 29
Autofluorescence image of rat liver under 445 nm excitation. ... 30
Changes of autofluorescence images of rat liver during ischemia and reperfusion. ... 31
Changes of autofluorescence intensity of rat liver during ischemia and reperfusion. ... 32
Microscopy images of mouse hepatocytes (FL83B). ... 33
Changes of hepatocellular autofluorescence images during simulated ischemia and reperfusion. ... 34
Changes of hepatocellular autofluorescence intensity during simulated ischemia and reperfusion. ... 35
The variation of oxygen concentration of F12 medium during bubbling with nitrogen. ... 36
Figure 3.9 Figure 3.10 Figure 3.11 Figure 3.12
The range of excitation and emission of intrinsic molecules. ... 37 Emission spectra of autofluorescence under 445 nm excitation. ... 38 Changes of autofluorescence intensity after treated with inhibitors. .... 39 Schematic of the possibly origin of the change of autofluorescence in the period of ischemia and reperfusion. ... 40
Chapter 1
Introduction
1.1 Ischemia-reperfusion injury
When an organ lacks sufficient blood supply during trauma, diseases, cardiac arrest, stroke, surgery, or organ transplantation, dysfunction and damage may occur to the ischemic organ as a result of lacking nutrition and oxygen. Nevertheless, the damage caused by ischemia does not necessarily cease, and, in contrast to intuition, may even increase after the blood flow restores. The increased damage occurring to the tissue during reperfusion after a period of ischemia is termed ischemia-reperfusion
injury, or reperfusion injury. Ischemia-reperfusion injury is the major complication of
trauma, diseases, cardiac arrest, stroke, surgeries, and organ transplantation, and a determinant factor causing mortality. Owing to its severe outcome and prevalence, ischemia-reperfusion injury has attracted much research effort.
Since the phenomenon of ischemia-reperfusion injury has initial introduced by Jennings et al. in 1960,1 the understanding of fundamental mechanisms of ischemia-reperfusion injury has grown significantly. The injury of tissue during ischemia may be caused by the lack of nutrition, oxygen and other necessary substances, or acidosis resulted from alterations of ion homeostasis and metabolisms.2 During the following reperfusion, as described by Menger et al.,3 the mechanisms of injury can be categorized into two kinds, reoxygenation-associated phenomena termed "reflow-paradox", and the failure of capillary perfusion termed "no-reflow", which are illustrated in the cartoon shown in Figure 1.1.
For reflow-paradox, the injury involves complex mechanisms including pH,4 calcium ion,5 oxygen,6 and activated leukocytes.7 Specifically, the restoration of pH during reperfusion may promote a variety of pH-dependent processes. They include
the exchange between Na+ and H+, the homeostasis between Na+ and Ca2+, and the resultant overload of intracellular Ca2+.8 Moreover, the resupplying of oxygen during reperfusion and the accumulation of metabolites during ischemia may promote metabolism processes such as the production of energy in the mitochondrial electron transport chain and the metabolism of hypoxanthine to uric acid by xanthine oxidase. These metabolic processes can further cause the excessive production of injurious reactive oxygen species (ROS) such as superoxide radical (O2¯), hydrogen peroxide
(H2O2), and hydroxyl radical (.OH). In the mean time, the NADPH oxidase in
leukocytes (such as neutrophils) can be activated and produce ROS and inducible nitric oxide synthase (iNOS). The latter can promote the production of reactive nitrogen species (RNS) such as nitric oxide (.NO), nitrogen dioxide (.NO2), and
peroxynitrite anion (ONOO¯).9 The Ca2+ overload and the excessive production of ROS and RNS may result in depletion of adenosine triphosphate (ATP), an increase of the membrane permeability of mitochondria, ultrastructural damage of mitochondria, and destruction of DNA, proteins, and lipids. All these events occurred during the early phase of reperfusion can lead to cellular necrosis or apoptosis causing more severe cellular injury.9, 10
As of no-reflow, factors such as intravascular hemoconcentration and thrombosis, leukocyte plugging, endothelial cell swelling, vasomotor dysfunction, and formation of interstitial edema can contribute dysfunction of capillaries in some ischemic areas and result in ischemia even after reperfusion.11 The dysfunction of microcirculation can lead to the lack oxygen, nutrition, and other substances necessary to maintain the survival of cells, and alter the ion homeostasis, metabolisms, and acidosis.
Many approaches have been made aiming to develop effective intervention to prevent or to reduce ischemia-reperfusion injury. They include ischemia preconditioning, adding antioxidants to scavenge ROS, inhibition of the activity of
leukocytes.12, 13 Unfortunately, the outcome is still far from unsatisfactory. This is at least in part owing to the lack of reliable assessment that enables one to predict the outcome of reperfusion injury during the stage of ischemia. By far, post-reperfusion histopathological examination of biopsy tissues remains the most commonly employed method to assess ischemia-reperfusion injury for humans in the clinical setting, or for model animals in fundamental research. However, the injury would have had occurred at that stage and no kinetic information is available. Moreover, tissue biopsy necessitated by histological examination almost inevitably introduce additional trauma to the organ; specimen preparation such as fixation, staining, and sectioning may also complicate interpretation of the result. As such, an alternative approach that can reveal the molecular change at different stages of ischemia-reperfusion with high spatiotemporal resolution would be highly expected.
1.2 Autofluorescence
Organism is an assembly of many molecules, some of those molecules in organism can emit fluorescence by absorbing specific wavelength of light, and we call the fluorescence which emitted form those endogenous molecules as autofluorescence. The endogenous fluorescent compounds such as aromatic amino acids, nicotinamide adenine dinucleotide (NADH), nicotinamide adenine dinucleotide phosphate (NADPH), riboflavin, flavin mononucleotide (FMN), flavin adenine dinucleotide (FAD), porphyrins, collagen, elastin, and lipo-pigments are involved in the structural matrix of tissues or cellular metabolic processes in living organisms.14, 15
Autofluorescence is relatively weak in comparison with emission produced from exogenous labeling stains, and is commonly regarded as unwanted background that may reduce the contrast of fluorescent images of cells or animals. Despite of the intrinsic limitation, the spectroscopy or imaging based on autofluorescence which does not require employment of staining agents such as fluorescent dyes and thus
entirely eliminate the concerns of potential biological toxicity introduced by the exogenous reagents. As a result, autofluorescence spectroscopy or imaging is an ideal method for intravital assessment with minimal invasiveness while with no need to introduce labeling agents. Recently, the autofluorescence signals have been widely employed for both fundamental and clinical researches, and for diagnostic purposes16 such as the examination of mitochondrial functions,17 metabolism,18 apoptosis,19, 20 necrosis,21, 22 phagocytosis,23, 24 oxidative injury,25-27 neuronal activation,28 oncology,29-32 connective tissue diseases,33 and age-related macular degeneration.34
Based on autofluorescence, it provides a powerful tool to study various basic researches and diagnostic purpose with the advantages such as label-free, minimal invasive, real-time, and easy to use. In this work, we also apply this powerful tool to probe ischemia-reperfusion injury.
In most of endogenous fluorescent compounds, flavins such as FMN and FAD play an important role in biochemical reactions. Flavins play as electron carrier in many reactions such as energy production of mitochondrial electron transport chain,35 oxidation of hypoxanthine to uric acid of xanthine oxidase,36 production of reactive species by NADPH oxidase to eliminate invaders,37 etc. Flavin accepts electrons to switch to reduced form and then passing the electrons to the other electron acceptor to switch to oxidized form during the biochemical reactions. The switch between reduced form and oxidized form causes the change of fluorescence of flavins such as the reduced form serves as a non-fluorescent form, on the contrary, the oxidized serves as a fluorescent form such as shown in Figure 1.2.15 The change of fluorescence caused by the redox state of flavins may provide a useful target to track the state of biochemical reactions. In the case of ischemia-reperfusion, mitochondrial electron transport chain is affected directly by the hypoxia and reoxygenation event during ischemia-reperfusion. Because the flavins may be a rate-limiting in
mitochondrial electron transport chain,38 and the redox of flavins which involving in the production of energy of mitochondrial electron transport chain may be also affected by the hypoxia and reoxygenation event during ischemia-reperfusion. If the redox state of flavins is changed, the change of redox state of flavins may show in the change of autofluorescence.39 On the other hand, mitochondria has been recognized as one of the major cellular generators of reactive oxygen species and the flavins also involve in the production of ROS in mitochondria,40 it may be a target to probe the oxidative burst during ischemia-reperfusion. Based on these assumptions, we want to use the autofluorescence of flavins to probe ischemia-reperfusion.
1.3 Literature review
Ischemia-reperfusion injury has been an import issue in clinical research, but unfortunately, the traditional invasive histopathological examinations just offer the information of post-reperfusion injury, it is less help to prevent or to reduce the injury which induced during ischemia and reperfusion. How to probe the injury in real-time with minimal invasive way to prevent or to reduce the injury induced by ischemia and reperfusion is an important work for clinical application.
A minimally invasive assessment that allows real-time monitoring of organs during ischemia and reperfusion can not only shed light to the underlying pathogenesis but also provide clues to predict prognosis of the organ after reperfusion. Different minimally invasive approaches have been attempted and developed to assess intact organs subject to ischemia and reperfusion. Optical methods such as laser-Doppler flowmetry has employed to monitor the blood flow of rat liver during hepatic ischemia-reperfusion,41 scanning laser-Doppler technique has been developed to provide both an image and quantitative information about perfusion of the superficial tissue after ischemia-reperfusion,42 diffuse optical tomography (DOT) has been applied to assess blood flow, oxygenation, and metabolism of tissue during
cerebral ischemia-reperfusion,43 optical coherence tomography (OCT) has been used to detect the retinal changes induced by ischemia-reperfusion in rats qualitatively and quantitatively,44 infrared (IR) imaging has used to image local temperature in real-time to assess the perfusion of tissue to provide whole tissue assessment of ischemia-reperfusion injury,45 intravital fluorescence microscopy with dye-staining has been used to assess changes of microvascular perfusion, pH, and cellular membrane integrity to study the causative role of ischemia-reperfusion induced microcirculatory disturbance on the manifestation of ischemia-reperfusion injury and the index of reversible and irreversible damage,46-49 the autofluorescence spectroscopy or imaging has been used to assess and to monitor the cellular energy metabolism, tissue oxygenation degree of ischemia-reperfusion injury of organs in real-time.50-54 two-photon images has been employed to real-time monitor mitochondrial function during ischemia-reperfusion,55 and fluorescence lifetime has been used to discriminate ischemic or necrotic tissues by noninvasive.56 Non-optical methods such as electromechanical wave imaging (WMI) has been utilized to localize and quantify graded ischemia,57 diffusion tensor imaging (DTI) has also been employed to probe
the dynamics of pathological changes of ischemia-reperfusion,58 and
diffusion-weighted magnetic resonance imaging has been to identify irreversible or reversible ischemic brain damage.59 Most of these detection methods provide information of ischemia-reperfusion with minimally invasive, label-free, and real-time way to help us not only to assess ischemia-reperfusion injury but also to understand the pathogenesis and to prevent or to reduce the injury. Although these methods can provide minimally invasive and real-time detection of ischemia-reperfusion, but they usually provide the total change of intact organ or information of single point for organic ischemia-reperfusion. The overall situation or single point information of organ of ischemia-reperfusion is less help to understand the subcellular changes
during ischemia-reperfusion. Also, the extreme range of detection may lose some important spatial information to assess the injury. The limitations of these methods restrict the application in the assessment of ischemia-reperfusion injury.
Remarkably, one of those detection methods is as similar as what we want to do in this work, the methods which based on autofluorescence had been developed to assess the ischemia-reperfusion injury.49-54 Those previous works usually based on the autofluorescence of reduced pyridine nucleotides such as NADH because their high quantum yield and it also involve in the metabolic process which can be affected by ischemia-reperfusion.52 The previous works show the changes of autofluorescence spectra, intensity, or intact organ image of NADH autofluorescence during ischemia-reperfusion under ultraviolet excitation and trying to relate the changes to ischemia-reperfusion injury, but it is still restricted by the limitations that we have mentioned before. Also, the range of wavelength of exciting light may be absorbed by other molecules to emit additional autofluorescence and the harmful wavelength of exciting light is a problem need to solve to reduce the additional damage. On the other hand, the involving of aerobic and anaerobic respiration of NADH and the inconsistent change between difference measurements53 may make it more complex to assess the injury.
1.4 Motivation and objectives
Although there are many studies tried to explain the mechanism of ischemia-reperfusion injury and perform real-time detection to assess the degree of organ damage by different ways during ischemia and reperfusion periods, but most of those methods provide just only spatial or temporal information at a time. It still lacks sufficient spatial and temporal information of ischemia-reperfusion injury at the same time to evaluate the state of organ damage.
organ ischemia-reperfusion in real-time to provide spatial and temporal information at same time to help understanding and assessing the damage events during ischemia and reperfusion. For this purpose, rat liver and mouse hepatocytes were used for in
vivo and in vitro studies to develop a novel method to detect ischemia-reperfusion
injury in real-time. We used a bulldog clamp to interrupt blood flow to induce ischemia-reperfusion of rat liver and a homemade perfusion chamber with hypoxia or normoxia medium to simulate ischemia-reperfusion of mouse hepatocytes. Both of them were excited by 445 nm laser with suitable power which induced minimum negative effect in control group to pursue the change of autofluorescence images during ischemia-reperfusion. Furthermore, the fluorescent spectra and inhibitors of flavoproteins and electron transport chain were employed to illustrate the change of autofluorescence was attributed to the change of the redox states of flavin molecules in mitochondria. All of these results indicate that the autofluorescence of flavins can be employed in detection of ischemia-reperfusion injury and may provide subcellular information to assess the degree of damage.
Parenchymal cell Endothelial cell Oxygenated erythrocyte Deoxygenated erythrocyte Leukocyte Reactive species Normal
Normal IschemiaIschemia ReperfusionReperfusion
No
No--reflow areareflow area
Parenchymal cell Endothelial cell Oxygenated erythrocyte Deoxygenated erythrocyte Leukocyte Reactive species Normal
Normal IschemiaIschemia ReperfusionReperfusion
No
No--reflow areareflow area No
No--reflow areareflow area
Figure 1.1: Schematic of ischemia-reperfusion injury.
During ischemia, the interruption of blood flow induces lacking of necessary substances to maintain cell survival and alterations of ion homeostasis to narrow capillaries by cell swelling. In the following reperfusion, the blood reflow area is damaged by reflow-paradox and the no-reflow area is damaged by continuous ischemic injury.
N N NH N C H3 C H3 R O O N N NH N C H3 C H3 R O O H H 2H+, 2e
-Fluorescent form Non-fluorescent form
N N NH N C H3 C H3 R O O N N NH N C H3 C H3 R O O H H 2H+, 2e
-Fluorescent form Non-fluorescent form
Figure 1.2: The change of main structure of flavin in the redox
reaction.
In the redox reaction, flavin will switch between fluorescent oxidized form and non-fluorescent reduced form.
Chapter 2
Materials and Methods
2.1 Reagents
Sucrose, Tris, EGTA, antimycin A, diphenyleneiodonium chloride (DPI), dimethyl sulfoxide(DMSO), and flavin adenine dinucleotide (FAD) were purchased (Sigma Aldrich, U.S.A.).
2.2 Animals and feeding protocols
This study was approved by the Animal Investigation Committee of the National Chiao Tung University. Three male Wistar rats (The Animal Center of the National Taiwan University College of Medicine, Taiwan) aged between 7 and 9 weeks and weighing 200-250 g were used in this study. Throughout the study, all animals had free access to laboratory rodent diet (MF-18, Oriental Yeast Co., Japan) and water, and were maintained at room temperature under a cycle with 12 h light, 12 h dark.
2.3 Rat model of hepatic ischemia and reperfusion
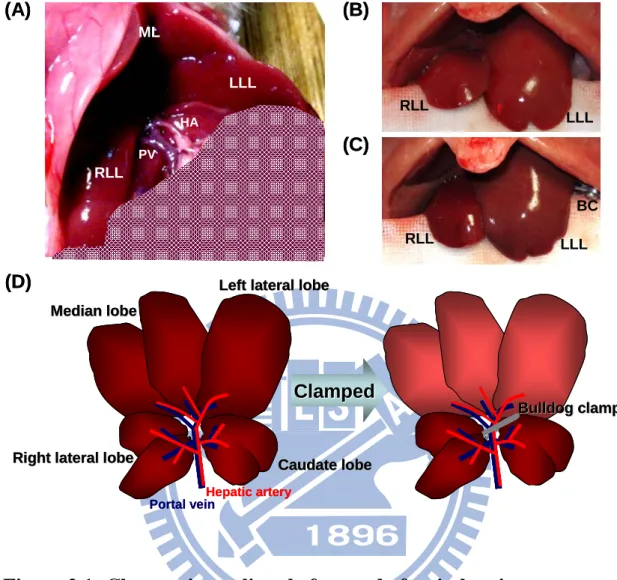
The ischemia and reperfusion process was revised from the method reported by Abe et al.60 All animals were fasted for 24 h before anesthetized by intraperitoneal injection with 2.5 % pentothal (70 mg/kg body wt, Abbott, Italy). After anesthesia, a midline laparotomy was performed to dissect the abdominal wall and all ligamentous attachments between liver and the diaphragm in order to expose the liver. To induce hepatic ischemia, the hepatic artery and portal vein were clamped by a bulldog clamp for designated durations of time as illustrated in the cartoon in Figure 2.1(D). After ischemia, the appearance of the liver changes from blood red to grey red as clearly shown in the two photographs displayed in Figure 2.1(B) and Figure 2.1(C). After a designated duration of time (20, 60, or 120 min) of ischemia, the bulldog clamp was removed to follow reperfusion. Throughout the experiments, the abdominal cavity of
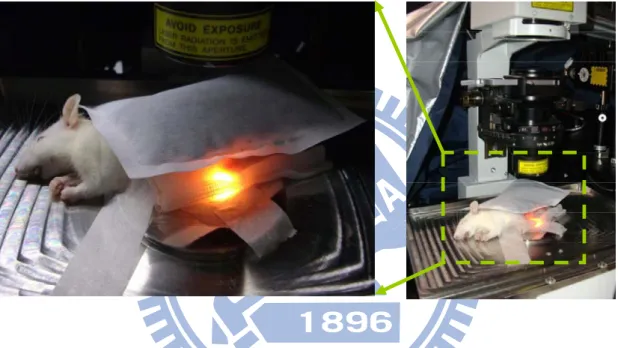
the animal was covered with moisturized gauze rinsed with saline to prevent drying, and the animal was placed in a side lying position with heating pads to maintain body temperature. For microscopy experiments, the rat was placed on a home-made sample stage of an inverted optical microscope with the left lobe of the liver positioned on a glass window as shown in the photograph displayed in Figure 2.2. At the end of the experiments, the rat was euthanized by injection of excessive pentothal.
2.4 Culturing of mouse hepatocytes
Mouse hepatocytes (FL83B) were grown in F12 medium supplemented with thermally inactivated fetal bovine serum (10 %, Invitrogen, USA) and penicillin/streptomycin mixture (100 U/mL, Invitrogen, USA) at 37 °C and 5 % CO2.
Cells were grown to 80-90 % confluence and were split 1:4 every two days to maintain healthy. Cells were plated in glass-bottomed Petri dishes and cultured for another two days before further measurements.
2.5 Simulated ischemia and reperfusion of mouse hepatocytes
For simulated ischemia-reperfusion experiments on hepatocytes, the Petri dish that contained cells was mounted in a homemade, air-tight perfusion chamber as shown in the photograph displayed in Figure 2.3. Flow of the medium through the perfusion chamber was controlled by a peristaltic pump (MP-1000, EYELA, Japan). To simulate an ischemic condition on cells, the chamber was filled and perfused with a hypoxia F12 medium with the concentration of O2 below 1 %. The hypoxia medium
was prepared by continuously bubbling of the medium with N2 for over 30 min to
ensure the concentration of O2 in the medium reached below 1 %. During the process
of bubbling, we used the dissolved oxygen meter (OM-51, Horiba, Japan) to measure the concentration of O2. Restoration from the ischemic condition was achieved by
perfusing the chamber with a normoxia F12 medium. The control sham group was perfused with a normoxia F12 medium at different stages.
2.6 Inhibitory assays of mitochondrial electron transport chain and
flavoproteins
To inhibit the mitochondrial electron transport chain, cells were incubated in the medium that contained antimycin A (10 μg/mL, in 0.5 % DMSO). To inhibit flavoproteins, cells were incubated in the medium that contained DPI (50 μM, in 0.5 % DMSO). The control groups were incubated in the medium mixed with 0.5 % DMSO. The incubation time was 60 min for treatments.
2.7 Isolation of mitochondria from rat liver
Mitochondria of rat liver were isolated with isolation buffer (250 mM Sucrose, 5 mM Tris, 1 mM EGTA, pH 7.4) by differential centrifugation from the livers of male Wistar rats weighing 200-250 g. All subsequent procedures were performed at 4 °C. The liver was minced and homogenized by Dounce homogenizer (Kontes Glass Co., USA) with ice-cold isolation buffer. And then the homogenized liver was centrifuged with ice-cold isolation buffer at 1000 × g 10 min to remove the chunks and at 12000 × g 15 min twice to collect the mitochondria.
2.8 Intravital autofluorescence imaging and spectroscopy
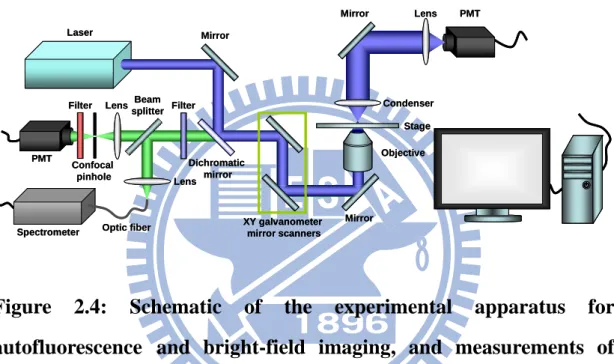
The experimental setup employed in this study was modified from a confocal laser scanning optical microscope (FV300, Olympus, Japan) to allow autofluorescence and bright-field imaging of living animals and the hepatocytes, and measurements of emission spectra at selected regions of liver tissues, hepatocytes, mitochondria of liver, and FAD such as shown in Figure 2.4.
To image living animals and the hepatocytes, a 445-nm diode laser (PhoxX445, Omicron, Germany) was employed as excitation and the autofluorescence emission was detected between 458 and 630 nm by employing a 458 nm long-wave pass edge filter (LP02-458RS-25, Semrock, U.S.A.) and a 630 long-wave pass dichroic mirror (DM630, Olympus, Japan) in front of the photomultiplier tube (PMT) detector
(R3896, HAMAMATSU, Japan). For the experiments of ischemia-reperfusion of rat liver, the image was acquired at 512 × 512 pixels (707.1 × 707.1 μm) of scan area with a laser power about 10 μW which measured before entering the microscope and the scan time per image was about 2.71 s. The autofluorescence emission was collected by a 20X objective (N.A. 0.75, UPLSAPO, Olympus, Japan), passed through a 150 μm confocal pinhole and then detected by PMT. For the experiments of simulated ischemia-reperfusion of hepatocytes, the parameters was modified to scan area of 512 × 512 pixels (157.1 × 157.1 μm), time interval of images of 5.42 s with 2 frame Kalman filter, and the autofluorescence emission was collected by a 60X water-immersion objective (N.A. 1.20, UPLSAPO, Olympus, Japan) then passed through a 300 μm confocal pinhole. For the experiments of inhibitory assays, the parameters was modified to scan area of 512 × 512 pixels (235.7 × 235.7 μm), laser power of 50 μW, and the autofluorescence emission was collected by a 60X water-immersion objective (N.A. 1.20, UPLSAPO, Olympus, Japan) then passed through a 100 μm confocal pinhole. The transmitted light was collected by a long working distance universal condenser (IX2-LWUCD, N.A. 0.55, Olympus, Japan) and then directed to the PMT (R7400U-02, HAMAMATSU, Japan), The signal detected by PMT was transmitted to Fluoview program (Olympus, Japan) to form autofluorescence images and bright-field images.
To measure spectra of autofluorescence produced from FAD, hepatocytes, mitochondria of liver, or liver tissues under 445 nm laser excitation, a spectrometer (Shamrock SR-303i, Andor Technology, U.K.) that equipped with a grating (300 groves/mm), the silt width of 100 μm, and a thermoelectrically cooled CCD detector (iXon; Andor, U.K.) was employed. The laser power used in this experiment was 1 mW and the fluorescence emission was collected by a 60X water-immersion objective (N.A. 1.20, UPLSAPO, Olympus, Japan) then directed to the spectrometer with the
detection range between 483 nm to 764 nm and an exposure time of 0.0005 s, 5 s, 10 s, and 5 s for FAD, hepatocytes, mitochondria of liver, and liver tissues, respectively.
2.9 Image analysis
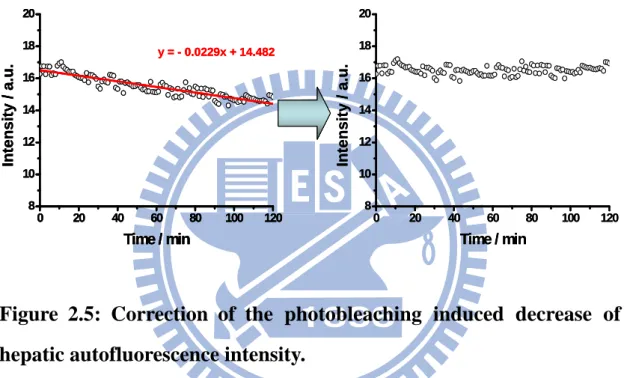
All autofluorescence images were analyzed with ImageJ program (Rasband, U.S.A.). The intensity of each image of animal was obtained by summing the intensity of each pixel after subtracting background and averaging over pixels with intensity exceeding the background. To remove the effect of photobleaching caused by laser, we fitted the decrease function of photobleaching of control group to find a correction function. Herein, we used the function: I = R + 0.0229t to correct the decrease of photobleaching of raw data and normalized by each control group such as shown in Figure 2.5, where I is the new intensity, R is the raw intensity, and t is the time from the start of laser exposure. The intensity of hepatocytes was obtained by removing the area of nucleus and subtracting background.
2.10 Statistical methods
Data were expressed as mean ± SEM. Comparison between the means of two groups was made using the two-tailed Student’s t test. The levels of statistical significance were set at P < 0.05, P < 0.01, and P < 0.001, respectively.
(D)
Clamped
Clamped
Left lateral lobe Left lateral lobe Median lobe
Median lobe
Right lateral lobe Right lateral lobe
Caudate lobe Caudate lobe
Portal vein Hepatic artery
Bulldog clamp Bulldog clamp (B) (A) LLL RLL BC (C) PV HA LLL RLL ML LLL RLL (D) Clamped Clamped
Left lateral lobe Left lateral lobe Median lobe
Median lobe
Right lateral lobe Right lateral lobe
Caudate lobe Caudate lobe
Portal vein Hepatic artery
Bulldog clamp Bulldog clamp (B) (A) LLL RLL BC (C) PV HA LLL RLL ML LLL RLL
Figure 2.1: Changes in rat liver before and after ischemia.
(A) The normal rat liver with the median and left lateral lobe was reflected back to expose the hepatic artery and portal vein after laparotomy. (B, C) The change of rat liver before (B) and after (C) hepatic artery and portal vein were clamped by bulldog clamp. (D) Schematic of the ventral view of the rat liver before and after ischemia induced by bulldog clamp. After the hepatic artery and portal vein was clamped by bulldog clamp, the median and left lateral lobe was ischemic and the color of the median and left lateral lobe was from blood red to grey red. LLL: left lateral lobe, ML: median lobe, RLL: right lateral lobe, HA: hepatic artery, PV: portal vein, BC: bulldog clamp.
Figure 2.2: The actual situation of the rat during experiment process.
In the experiment, the rat was placed in a sidelying position with heating pads on the microscopy, the abdominal cavity was covered with moist gauze with saline, and the left lateral lobe of liver was placed on glass slide for measurement.
Figure 2.3: Installation of homemade perfusion chamber.
The Petri dish was mounted in the perfusion chamber and the perfused medium flowed trough the flexible tube which connected with the peristaltic pump. The direction of the arrow is the flow direction of perfusion medium.
XY galvanometer mirror scanners Dichromatic mirror Mirror Mirror Lens Condenser Stage Objective PMT Laser Mirror Lens Confocal pinhole Filter PMT Spectrometer Lens Filter Optic fiber Beam splitter XY galvanometer mirror scanners Dichromatic mirror Mirror Mirror Lens Condenser Stage Objective PMT Laser Mirror Lens Confocal pinhole Filter PMT Spectrometer Lens Filter Optic fiber Beam splitter
Figure 2.4: Schematic of the experimental apparatus for
autofluorescence and bright-field imaging, and measurements of
emission spectra of living animals and the hepatocytes.
The autofluorescence which emitted from sample was acquired by PMT or spectrometer with suitable filters to obtain images or spectra.
0 20 40 60 80 100 120 8 10 12 14 16 18 20 Inte ns it y / a .u. Time / min 0 20 40 60 80 100 120 8 10 12 14 16 18 20 Inte ns it y / a .u. Time / min y = - 0.0229x + 14.482 0 20 40 60 80 100 120 8 10 12 14 16 18 20 Inte ns it y / a .u. Time / min 0 20 40 60 80 100 120 8 10 12 14 16 18 20 Inte ns it y / a .u. Time / min y = - 0.0229x + 14.482 0 20 40 60 80 100 120 8 10 12 14 16 18 20 Inte ns it y / a .u. Time / min y = - 0.0229x + 14.482
Figure 2.5: Correction of the photobleaching induced decrease of
hepatic autofluorescence intensity.
The raw data (left) was fitted for the decrease function of photobleaching (red) to get the correction function: I = R + 0.0229t, and then corrected by the correction function to get a corrected data (right).
Chapter 3
Results and Discussion
In this study, we want to develop a label free method to do real-time observation for the change and damage of organ during ischemia and reperfusion period. To achieve this goal, we tried to use the fluorescence which emitted from intrinsic organelle of hepatocytes to observe the change of rat liver during ischemia and reperfusion period. As mentioned earlier, we tried to use flavins as a target to probe ischemia-reperfusion, so we chose 445 nm laser to be a source of excitation in this work. Figure 3.1 shows clearly that the range of fluorescence spectrum of rat liver is between 450 nm and 700 nm under 445 nm excitation. According to the spectral range of rat live, we acquired fluorescent images between 458 nm and 630 nm with excitation at 445 nm such as shown in Figure 3.2.
3.1 Time-lapse autofluorescence images of rat liver during rat hepatic
warm ischemia and reperfusion
Before performing ischemia and reperfusion, we used the 445 nm laser with 10 μW of power to observe the effect of laser on normal liver of rat during 120 min measurement. The morphology, autofluorescence images, and statistics of autofluorescence intensity of normal rat liver shown in Figure 3.3(A) and Figure 3.4(A) did not have any intense change during 120 min measurement. It may mean that the laser power we used make a minimal influence and harm to the rat liver during long measurement time. Figure 3.3(B), Figure 3.3(C), and Figure 3.3(D) show the immediate change of autofluorescence. In the period of 20 min, 60 min, and 120 min ischemia, the autofluorescence images had been dimmer at first few minutes and kept stable in the following time. In the period of following reperfusion, all autofluorescence images showed a little uneven at the end of reperfusion and they
showed different behavior and phenomena between different ischemic times during following reperfusion. After 20 min ischemia, the autofluorescence had a rapid and overall restoration at first 10 min of reperfusion and kept steady in the following 80 min. On the contrary, the autofluorescence images of following reperfusion after 60 min ischemia showed a suddenly brightening on different area and then became dimmer quickly at first few minutes, but it still showed a restoration on autofluorescence images during reperfusion. The changes of autofluorescence images of following reperfusion after 120 min ischemia also showed similar behavior as after 60 min ischemia, but it showed a more serious no-reflow phenomenon on some area, it made that area look darker than the other area which had blood reflow. On the other hand, the intensity statistics of these autofluorescence images such as shown in Figure 3.4(B), Figure 3.4(C), and Figure 3.4(D), it exhibited that the autofluorescence intensity had rapid decrease about 40-50 % compared to control group at first 10 min and then kept stably in following time at all ischemic time. But during reperfusion, although not only short time ischemia (20 min) but also long time ischemia (60 min and 120 min) showed a gradual restoration of autofluorescence intensity, but the rate of restoration and the final intensity of autofluorescence was lower as the ischemic time was longer such as shown in Figure 3.4(E). The changes of autofluorescence is similar to some optical spectroscopy methods measured during ischemia and reperfusion period,39, 53, 61 the intensity of autofluorescence had suddenly increase or decrease in the periods of organic ischemia and reperfusion. But in those studies, it just provided overall or single point change on the observation area. On the contrary, according to the autofluorescence images that we acquired, we can provide not only overall change but also the regional change on the observation area. The difference between control, short ischemic time, and long ischemic time may based on the degree of lacking of nutrition, oxygen, and other necessary substances, alterations of
ion homeostasis and metabolisms, acidosis during ischemia, and the degree of blood reflow, reoxygenation, oxidative burst, and changes in physiological conditions after reperfusion, all of these adversely factors during ischemia and reperfusion induce different degree of cell damage to show a different response on autofluorescence images.
3.2 Time-lapse autofluorescence images of mouse hepatocytes subject
to simulated ischemia-reperfusion
In the experiment of rat liver ischemia-reperfusion, it showed clearly that the autofluorescence change over time. To confer the origin of autofluorescence and to learn how the origin of autofluorescence varying with ischemia and reperfusion, we choose the normal mouse hepatocytes cell line FL83B for this study, not hepatocellular carcinoma cell line such as Hep G2 to prevent from the possible change of metabolic characteristics caused by carcinogenesis.62
Under excitation by 445 nm laser with 10 μW of power and detection between 458 nm and 630 nm, the autofluorescence was appearing in the cytoplasm except for nucleus such as shown in Figure 3.5.
To understand whether it has same behavior as rat liver on cellular level during hypoxia and reoxygenation, we designed a perfusion chamber and a process to simulate the condition of ischemia and reperfusion. Before simulated ischemia and reperfusion was performed with hypoxia medium, the sham process was done with normoxia medium to simulate the process of ischemia and reperfusion to prevent from any acute changes to influence the observation during the perfusion process of medium in simulated ischemia and reperfusion period. The change of hepatocellular autofluorescence images during the period of 20 min sham ischemia and following 60 min reperfusion is shown in Figure 3.6(A). Such as shown as the hepatocellular autofluorescence images, the morphology and autofluorescence images did not have
radical and obvious change in a short time after perfusing with normoxia medium at different stages. Figure 3.7(A) shows the variation of hepatocellular autofluorescence intensity during the period of 20 min sham ischemia and following 60 min reperfusion, it also did not show obvious change after perfusing with normoxia medium in sham simulated ischemia and following reperfusion, it meant that the laser power we used did not influence and harm the cell during long measurement time.
To produce the hypoxia medium, we used nitrogen to bubble the F12 medium to remove the oxygen from medium and tested how long it can keep in low oxygen concentration when it was exposed to air after bubbled. As shown in Figure 3.8, the concentration of O2 dropped rapidly and reached below 1 % within 3 min after
bubbling with N2, and the concentration of O2 remained below 1 % for over 1h even
after exposing the medium to air owing to the relatively low desolation rate of O2 in
medium. The rate of reoxygenation was slow enough for us to transfer the medium to work. Figure 3.6(B) shows the variation of hepatocellular autofluorescence images with the advance of time during the period of 20 min simulated ischemia and following 60 min reperfusion. After perfusing with hypoxia medium which was bubbled with nitrogen more than 30 min to simulate 20 min ischemia, the hepatocellular autofluorescence had been dimmer. But in the following period of reperfusion which perfused with normoxia medium, the autofluorescence had a rapid restoration. In the statistics of autofluorescence intensity such as shown in Figure 3.7(B), it showed a rapid decrease at the first 10 min after perfusing with hypoxia medium and kept about 70 % of the original intensity stably in the following 10 min. In the following reperfusion, the intensity of autofluorescence increased rapidly at the first few minutes and then the increase rate of autofluorescence intensity has been slow down in the following observation. The final autofluorescence intensity at the end of observation was about 10 % increase compared with the initial intensity which
before ischemia. To compare the variation during simulated ischemia-reperfusion with the variation during sham simulated ischemia-reperfusion under the same experimental condition, they showed very different response to the stage of ischemia and reperfusion. The intensity of hepatocellular autofluorescence kept stable for the sham group which only perfused with normoxia medium at different stage, but for the simulated ischemia-reperfusion, it had a radical decrease in ischemic stage which perfused with hypoxia medium and had radical increase in following stage of reperfusion which perfused with normoxia medium. Despite the intensity of hepatocellular autofluorescence had a little perturbation in sham simulated ischemia and reperfusion, but the perturbation which may caused by fluctuation of focus was less than the variation during simulated ischemia and reperfusion, it did not affect our observation. In other words, the effects of perfusion or perturbation do not influence to observe the change caused by the different concentration of oxygen during simulated ischemia and reperfusion. The radical decrease or increase of autofluorescence of hepatocytes during ischemia and reperfusion show that the intrinsic fluorescence is affected by oxygen concentration and a consistent change as the response of organ level.
3.3 The source of change of cellular fluorescence during ischemia and
reperfusion
In cell, there are many fluorescent compounds which may be the origin of autofluorescence such as aromatic amino acid, reduced pyridine nucleotides (NADH and NADPH), oxidized flavins (riboflavin, FMN, and FAD), collagen, elastin, pyridoxine, porphyrins, and lipo-pigments. Those compounds can be excited by specific wavelength of light and emitting different wavelength of fluorescence such as shown in Figure 3.9. But according to our experiment design, under 445 nm laser excitation and detection between 458 nm and 630 nm, most of fluorescent compounds
such as aromatic amino acid, reduced pyridine nucleotides, pyridoxine, and porphyrins which are excited at the wavelength that shorter than 445 nm and emission shorter than 458 nm or longer than 630 nm can be ruled out at first.
To determine what is the fluorescent compound and where does it locate, we obtained the autofluorescence spectra of rat liver, mouse hepatocytes (FL83B), mitochondria of rat liver, and flavin adenine dinucleotide (FAD) under 445 nm excitation at first such as shown in Figure 3.10. According to the fluorescence spectra and the variation of cellular autofluorescence during ischemia and reperfusion that we acquired from rat hepatic ischemia-reperfusion and cellular stimulated ischemia-reperfusion, the fluorescent compound is possible to be flavins (riboflavin, FMN, and FAD).39, 63 Flavins are one kind of redox cofactor involved in several important bioreactions in metabolism such as in NADH dehydrogenase, succinate dehydrogenase, xanthine oxidase, NADPH oxidase, etc. and most of these flavoproteins are considered to be the source of reactive oxygen species during ischemia-reperfusion.9 During the redox reaction of metabolism of flavoproteins, the flavins are switched between fluorescent oxidized and non-fluorescent reduced forms. The oxidized form of flavins can be maximum excited around 450 nm and emission between 500 nm and 700 nm such as shown in Figure 3.9. To confer whether the flavoproteins are the main origin of autofluorescence, the cell were incubated with a flavoprotein inhibitor DPI which selectively and permanently inactivates flavoproteins64 to observe the change of autofluorescence. On the other hand, because the hypoxia is related to mitochondria directly and the flavoproteins also involve in mitochondria function, we also treated the cells with electron transport chain inhibitor antimycin A which binds to complex III to block the electron flow65 to understand the relationship between mitochondria and the autofluorescence. Figure 3.11 shows the change of autofluorescence after treated with DPI or antimycin A. The
autofluorescence intensity had about 40 % decrease (P = 2.10 × 10⁻¹⁷) after inhibited flavoproteins with DPI, it means that over 40 % autofluorescence come from flavoproteins. And the autofluorescence intensity had about 40 % (P = 1.26 × 10⁻¹²) decrease after inhibited electron transport chain of mitochondria with antimycin A, it may elaborate that the electron transport chain was blocked by antimycin A to induce the flavins in mitochondria were converted to non-fluorescent reduced form. Combined the result of cells treating with DPI and antimycin A, it shows that over 40 % autofluorescence may come from the flavoproteins of mitochondria such as NADH dehydrogenase and succinate dehydrogenase, and it can affect by the degree of oxygen. The other sources of autofluorescence may be the free flavin, lipo-pigments, or the other fluorescent compounds which do not affect by degree of oxygen in cell.
According to all results we got, we provide a hypothesis for the variation of autofluorescence during ischemia and reperfusion such as shown in Figure 3.12. Under the normal oxygen supply, the redox reaction of flavins in mitochondria keeps balance and the autofluorescence intensity keeps stably. But in the period of ischemia, the supply of oxygen is blocked and the overall reaction of electron transport can not work, it induces most flavins converting to non-fluorescent reduced form and reflecting to the image is darker and darker until the switch between non-fluorescent reduced form and fluorescent oxidized form is saturation. And in the period of following reperfusion, the suddenly supply of oxygen and accumulation of metabolites and ions such as ADP, NADH, H+, and Ca2+ promote the electron transport chain restart and work much faster than normal. At the same time, the accumulated non-fluorescent reduced form of flavins is converted to fluorescent oxidized form and produces a lot of reactive oxygen species at relative reaction. And reflecting to the image is brighter and brighter, and then keeping stably when the overall reaction reaches balance after reperfusion.
According to the mechanism and the variation of autofluorescence images during the period of ischemia and reperfusion, we can get not only the information of cellular oxygenation and cell damage intuitively but also the restoration of blood flow after reperfusion and the possible area of oxidative burst by the switch between non-fluorescent reduced form and fluorescent oxidized form of flavins indirectly.
500 550 600 650 700 750 0.0 0.2 0.4 0.6 0.8 1.0
Normali
zed intensity
Wavelength / nm
Figure 3.1: Autofluorescence spectrum of rat liver under 445 nm
excitation.
The emission spectrum of intrinsic fluorescence of rat liver under 445 nm excitation shows that the range of autofluorescence is between 450 nm and 700 nm and has a maximum emission around 525 nm.
Depth Depth 200 μm Depth Depth 200 μm 200 μm
Figure 3.2: Autofluorescence image of rat liver under 445 nm
excitation.
The autofluorescence images of rat liver which acquired under 445 excitation can show different depth and cell level information by using z-scanning and different magnification of objective.
(B) (C) (D) (A) 7 10 15 20 Reperfusion 90 min 0 5 10 15 20 55 90
Control Ischemia 20 min
Reperfusion 90 min
10 20 30 40 50 60
Control Ischemia 60 min
0 5 10 15 20 55 90
Reperfusion 150 min
7 20 40 60 80 100 120
Control Ischemia 120 min
0 1 5 10 15 20 55 150 Normal 120 min 0 20 40 60 80 100 120 (B) (C) (D) (A) 7 10 15 20 Reperfusion 90 min 0 5 10 15 20 55 90
Control Ischemia 20 min
7 10 15 20
Reperfusion 90 min
0 5 10 15 20 55 90
Reperfusion 90 min
0 5 10 15 20 55 90
Control Ischemia 20 min
Reperfusion 90 min
10 20 30 40 50 60
Control Ischemia 60 min
0 5 10 15 20 55 90
Reperfusion 90 min
10 20 30 40 50 60
Control Ischemia 60 min
0 5 10 15 20 55 90 0 5 10 15 20 55 90
Reperfusion 150 min
7 20 40 60 80 100 120
Control Ischemia 120 min
0 1 5 10 15 20 55 150
Reperfusion 150 min
7 20 40 60 80 100 120
Control Ischemia 120 min
0 1 5 10 15 20 55 150
Normal 120 min
0 20 40 60 80 100 120
Normal 120 min
0 20 40 60 80 100 120
Figure 3.3: Changes of autofluorescence images of rat liver during
ischemia and reperfusion.
(A, B, C, D) In vivo real-time tracking autofluorescence images of rat liver during different ischemia time and the following reperfusion: (A) normal. (B) 20 min ischemia and following 90 min reperfusion. (C) 60 min ischemia and following 90 min reperfusion. (D) 120 min ischemia and following 150 min reperfusion. The control image was acquired before ischemia. Image size: 707.1 μm × 707.1 μm.
(A) 0 20 40 60 80 100 120 0.5 0.6 0.7 0.8 0.9 1.0 1.1 N o rm alized intensity Time / min 0 20 40 60 80 100 120 0.5 0.6 0.7 0.8 0.9 1.0 1.1 N o rm alized intensity Time / min I: Ischemia R: Reperfusion I R (C) 0 40 80 120 160 200 240 0.5 0.6 0.7 0.8 0.9 1.0 1.1 Nor m aliz ed intens ity Time / min I: Ischemia R: Reperfusion I R (D) (B) I: Ischemia R: Reperfusion I R 0 20 40 60 80 100 0.5 0.6 0.7 0.8 0.9 1.0 1.1 Norm aliz ed intens ity Time / min (E) 0.5 0.6 0.7 0.8 0.9 1.0 1.1 Time Normali zed i n tensity Ischemia Reperfusion 20 min ischemia 60 min ischemia 120 min ischemia (A) 0 20 40 60 80 100 120 0.5 0.6 0.7 0.8 0.9 1.0 1.1 N orm alized intensity Time / min 0 20 40 60 80 100 120 0.5 0.6 0.7 0.8 0.9 1.0 1.1 N o rm alized intensity Time / min I: Ischemia R: Reperfusion I R (C) 0 40 80 120 160 200 240 0.5 0.6 0.7 0.8 0.9 1.0 1.1 Nor m aliz ed intens ity Time / min I: Ischemia R: Reperfusion I R (D) (B) I: Ischemia R: Reperfusion I R 0 20 40 60 80 100 0.5 0.6 0.7 0.8 0.9 1.0 1.1 Norm aliz ed intens ity Time / min (E) 0.5 0.6 0.7 0.8 0.9 1.0 1.1 Time Normali zed i n tensity Ischemia Reperfusion 20 min ischemia 60 min ischemia 120 min ischemia 20 min ischemia 60 min ischemia 120 min ischemia
Figure 3.4: Changes of autofluorescence intensity of rat liver during
ischemia and reperfusion.
(A, B, C, D) Variations of autofluorescence intensity of Fig. 3.3. (A) normal. (B) 20 min ischemia and following 90 min reperfusion. (C) 60 min ischemia and following 90 min reperfusion. (D) 120 min ischemia and following 150 min reperfusion. (E) The merged graph of (B), (C), and (D) at the same event. All intensities were normalized by the intensity of control image which acquired before ischemia.
(A)
(B)
(A)
(B)
Figure 3.5: Microscopy images of mouse hepatocytes (FL83B).
(A) Bright-field and (B) autofluorescence images of mouse hepatocytes under 445 nm excitation. The origin of fluorescence was from intrinsic organelle without any labeling. Image size: 101.9 μm × 101.9 μm.
(A)
Control Sham ischemia 20 min
Sham reperfusion 60 min
0 10 20 30 40 50 60 0 4 8 12 16 20
0 4 8 12 16 20 (B)
Control Ischemia 20 min
Reperfusion 60 min
0 10 20 30 40 50 60 (A)
Control Sham ischemia 20 min
Sham reperfusion 60 min
0 10 20 30 40 50 60 0 4 8 12 16 20
(A)
Control Sham ischemia 20 min
Sham reperfusion 60 min
0 10 20 30 40 50 60 0 4 8 12 16 20
0 4 8 12 16 20 (B)
Control Ischemia 20 min
Reperfusion 60 min
0 10 20 30 40 50 60 0 4 8 12 16 20
(B)
Control Ischemia 20 min
Reperfusion 60 min
0 10 20 30 40 50 60
Figure 3.6: Changes of hepatocellular autofluorescence images during
simulated ischemia and reperfusion.
(A, B) In vivo real-time tracking autofluorescence images of normal, simulated ischemia, and reperfusion stages with different oxygen concentration of perfusion medium: (A) 20 min sham simulated ischemia and following 60 min reperfusion with normoxia F12 medium. (B) 20 min simulated ischemia with hypoxia F12 medium (O2
concentration < 1 %) and following 60 min reperfusion with normoxia F12 medium for. Image size: 157.1 μm × 157.1 μm.
0 10 20 30 40 50 60 70 80 0.6 0.7 0.8 0.9 1.0 1.1 1.2 1.3 Nor m alize d intensity Time / min N: Normal SI: Sham Ischemia SR: Sham Reperfusion N SI SR (A) 0 10 20 30 40 50 60 70 80 0.6 0.7 0.8 0.9 1.0 1.1 1.2 1.3 N o rm alized intensity Time / min N: Normal I: Ischemia R: Reperfusion N I R (B) 0 10 20 30 40 50 60 70 80 0.6 0.7 0.8 0.9 1.0 1.1 1.2 1.3 N o rm alize d intensity Time / min N: Normal SI: Sham Ischemia SR: Sham Reperfusion N SI SR (A) 0 10 20 30 40 50 60 70 80 0.6 0.7 0.8 0.9 1.0 1.1 1.2 1.3 N o rm alize d intensity Time / min N: Normal SI: Sham Ischemia SR: Sham Reperfusion N SI SR (A) 0 10 20 30 40 50 60 70 80 0.6 0.7 0.8 0.9 1.0 1.1 1.2 1.3 N o rm alized intensity Time / min N: Normal I: Ischemia R: Reperfusion N I R (B) 0 10 20 30 40 50 60 70 80 0.6 0.7 0.8 0.9 1.0 1.1 1.2 1.3 N o rm alized intensity Time / min N: Normal I: Ischemia R: Reperfusion N I R (B)
Figure 3.7: Changes of hepatocellular autofluorescence intensity
during simulated ischemia and reperfusion.
(A, B) Variations of autofluorescence intensity of Figure 3.6. (A) 20 min sham simulated ischemia and following 60 min reperfusion (n = 16). (B) 20 min simulated ischemia and following 60 min reperfusion (n = 21). All intensities were normalized by initial intensity.
0
10
20
30
40
50
60
70
80
90
0
2
4
6
8
10
12
% O
2Time / min
B
N
S
0.9%
N: Normal B: Bubbled with N2 S: Stopped bubbling0
10
20
30
40
50
60
70
80
90
0
2
4
6
8
10
12
% O
2Time / min
B
N
S
0.9%
N: Normal B: Bubbled with N2 S: Stopped bubblingFigure 3.8: The variation of oxygen concentration of F12 medium
during bubbling with nitrogen.
The F12 medium was bubbled with nitrogen for 20 min to remove oxygen from medium, and then stopped bubbling to observe the change of oxygen concentration in the medium which re-exposed to air at following 65 min.
200
200 250250 300300 350350 400400 450450 500500 550550 600600 650650 700700
Porphyrins
Porphyrins
Lipo
Lipo--pigmentspigments Aromatic amino acid
Aromatic amino acid
P
Pyridine nucleotides yridine nucleotides
(Reduced) (Reduced) Pyridoxine Pyridoxine Collagen Collagen Elastin Elastin Flavins Flavins (O (Oxidizedxidized) ) Wavelength / nm Wavelength / nm * * * * * * * * Excitation Excitation Emission Emission
* Maximum EmissionMaximum Emission
200 200200 250250 300300 350350 400400 450450 500500 550550 600600 650650 700700 200 250250 300300 350350 400400 450450 500500 550550 600600 650650 700700 Porphyrins Porphyrins Lipo
Lipo--pigmentspigments Aromatic amino acid
Aromatic amino acid
P
Pyridine nucleotides yridine nucleotides
(Reduced) (Reduced) Pyridoxine Pyridoxine Collagen Collagen Elastin Elastin Flavins Flavins (O (Oxidizedxidized) ) Wavelength / nm Wavelength / nm * * * * * * * * Excitation Excitation Emission Emission
* Maximum EmissionMaximum Emission
Figure 3.9: The range of excitation and emission of intrinsic
molecules.
This figure shows the range of excitation and emission of aromatic amino acid, reduced pyridine nucleotides (NADH and NADPH), pyridoxine, collagen, elastin, lipo-pigments, oxidized flavins (riboflavin, FMN, and FAD), and porphyrins.