Pattern masking investigations of the second-order visual mechanisms
Pi-Chun Huang and Chien-Chung Chen
Psychology Department, National Taiwan University, Taiwan
ABSTRACT
Human visual system is sensitive to both the first-order and the second-order variations in an image. The latter one is especially important for the digital image processing as it allows human observers to perceive the envelope of the pixel intensities as smooth surface instead of the discrete pixels. Here we used pattern masking paradigm to measure the detection threshold of contrast modulated (CM) stimuli, which comprise the modulation of the contrast of horizontal gratings by a vertical Gabor function, under different modulation depth of the CM stimuli. The threshold function showed a typical dipper shape: the threshold decreased with modulation depth (facilitation) at low pedestal depth modulations and then increased (suppression) at high pedestal modulation. The data was well explained by a modified divisive inhibition model that operated both on depth modulation and carrier contrast in the input images. Hence the divisive inhibition, determined by both the first- and the second-order information in the stimuli, is necessary to explain the discrimination between two second-order stimuli.
Keywords: Pattern masking, second-order, contrast-modulated, TvC function, divisive inhibition.
INTRODUCTION
It is well documented that the visual system is sensitive to both the first-order and the second-order variations in an image. The first-order information usually refers to the spatiotemporal modulation in luminance or chromaticity. Such modulation has a corresponding energy in the Fourier domain and is detectable by a linear operator whose receptive field contains excitatory and inhibitory regions similar to that of neurons in the primary visual cortex. On the other hand, the second-order information, or the modulation of the first-order information in an image, has no corresponding energy in Fourier domain and is not detectable by a simple linear receptive field. For example, a contrast-modulated (CM) image can be constructed by multiplying a high spatial frequency sinusoidal grating (carrier) by a low spatial frequency one (envelope). A Fourier transform of this CM image found energy at frequencies that are either the sum or the difference of the carrier and the envelope frequencies. There is no energy at the envelope frequency in the power spectrum of the CM stimulus. Yet, a human observer has no problem in perceiving the envelope of CM stimuli. Therefore, extra information processing beyond the linear operators would be needed to extract the envelope information from an image.
The second-order information plays an important role in image analysis. Most images of nature scenes contain both the first- and the second-order information. While the first-order information, can be used to extract information, such as luminance- or chromaticity-defined edges, from an image, they may be unreliable under certain illumination conditions. For instance, a system that analyzes only the first-order information may erroneously take an edge of a shadow on a surface as the boundary between two objects. On the other hand, the second-order information does not change with illumination and thus provides relatively stable constraints for image analysis. In digital images,
Human Vision and Electronic Imaging XIV, edited by Bernice E. Rogowitz, Thrasyvoulos N. Pappas, Proc. of SPIE-IS&T Electronic Imaging, SPIE Vol. 7240, 724016
© 2009 SPIE-IS&T · CCC code: 0277-786X/09/$18 · doi: 10.1117/12.805817 SPIE-IS&T/ Vol. 7240 724016-1
the visual processing of the second-order information is even more important. Digital images consist of discrete pixels. However, a human observer would perceive smooth surfaces from these discrete pixels. Such effect is more pronounced when an image is displayed on a large screen. Due to the limit of screen resolution and pixel size, an image on a large display is actually like a mosaic of disks or squares. However, our visual system can ignore the discrete information and derive the envelope information to form the percept of smooth surfaces. To achieve this, the visual system needs to ignore the high spatial frequency information at the border of the pixels and then interpolate the structure information from the pixels themselves.
Psychophysical studies suggest that, in the human visual system, the analysis of the first- and the second-order stimulus may involve different mechanisms [1]. In order to compare the first- and the second-order mechanisms under equal circumstances, researchers usually use CM patterns, which is constructed by multiplying a high spatial frequency carrier or a white noise carrier by a low spatial frequency envelope as the second-order stimuli and luminance-modulated pattern (LM), which is constructed by adding the carrier and the envelope, as the first-order stimuli. It has been shown that the detectability of the first-order stimuli did not change when a near threshold second-order stimulus was presented and vise versa [1]. In other words, there is no subthreshold summation between the first- and the second-order stimuli. The detectability of the envelope improved with carrier contrast for the second-order patterns but degraded for the first-order patterns [1,2]. These results suggested different mechanisms for the first- and the second-order processes. In addition to psychophysics evidence, there were electrophysiological studies showing that neurons in the cat’s area 17 and 18 had different spatial frequency and orientation tuning for the first- and second-order stimuli[3,4], and visually evoked potential studies showing that response latency for CM stimuli was longer than that for LM stimuli [5]. All the studies came to the same conclusions that the first-order and second-order vision involves different mechanisms.
In the literature, linear-nonlinear-linear (LNL) models are commonly used to explain the visual process of the second-order stimuli [6-10]. This model contains several stages: the first stage involves a band of linear filters that is responsive to the carrier wave. The responses of the linear filters are then undergoing a nonlinear transform before sending to the second-stage linear filters which extract to the envelope [11,12]. The nonlinear transform between the first- and the second-stage filters is not well understood. Most researchers used rectification for its simplicity. One of the purposes of this study is to characterize this nonlinear transform.
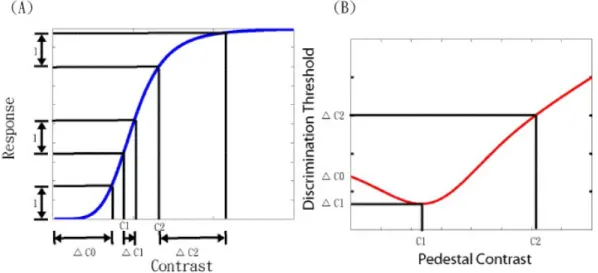
The pattern masking paradigm had been widely used in estimating the non-linear properties of the first-order visual mechanisms [13-19,27]. Here, we applied this paradigm to estimate the nonlinear properties of the second-order mechanisms. In a typical pattern masking experiment, the experimenter presents a pattern (mask) with intensity C in the dimension of interests and a combination of the same mask and a target pattern with ∆C to an observer. The task of the observer is to determine whether he/she can tell the difference between the mask alone and the target plus the mask. The detection threshold, or the just-noticeable difference, between the target and the reference is defined as the target intensity ΔC that allows the observer to tell the difference between the mask and the target with certain percentage of correctness. A typical result of the experiments is plotted the detection threshold of the target (∆C ) against the mask intensity (C) and it showed the "dipper" shaped target threshold vs. mask intensity (TvC) function[20,21,22]. That is, as mask intensity increases, the target threshold first decreases (facilitation) and then increases (suppression) as shown in Figure 1(B). The TvC function reflects the response characteristics in the visual system. As shown in Figure
SPIE-IS&T/ Vol. 7240 724016-2
(A) 'I co .ci .:.(:2 Contrast (B) PedestM Contrast
1(A), in order for an observer to detect the target, the target intensity ΔC has to be large enough to exceed the response evoked by the mask pattern by a certain amount, defined as one unit. Suppose that the response function is accelerating near a mask intensity (e.g., C1 in Figure 1A), it would require less intensity (ΔC1) to increase the response by one unit than the absolute threshold (C0, the threshold measured when the mask has zero intensity). On the other hand, when the response function is decelerating near a mask intensity (e.g., C2 in Figure 1), it would take greater intensity (ΔC2) to evoke the same amount of response. Thus, the detection threshold at a certain mask intensity is inversely proportional to the slope of the response function at that mask intensity. Therefore, with a systematic measurement of detection threshold at various mask intensities, we can estimate the slope of the response function and in turn the response function itself to a scale constant.
Figure 1. The relationship between the contrast response function (A) and TvC function (B).
While this pattern masking approach has been widely used in the study of the first-order visual mechanisms, to the best of our knowledge, there is no systematic investigation of the response function of the second-order mechanisms. Here, we used the pattern masking methods to systematically measure the threshold functions for the second-order pattern vision that is equivalent to the TvC function of the first-order pattern vision. That is, we measured the target threshold versus pedestal modulation depth (TvM) function for the CM patterns. Furthermore, we investigated how the carrier contrast influenced the TvM function. Such information will allow us to estimate the nonlinearity between the first- and the second-order linear filters.
Method
Participants
Two observers (CWC and PCH) with corrected to normal vision participated in this study. PCH was one of the authors and CWC was paid naïve to the purpose of the experiment.
Apparatus
The stimuli were presented on two 17 inches View Sonic Monitors (Professional series p75f+) which were driven by a Macintosh computer running the OS 9 operating system. The lights from the two monitors were combined with a beam splitter placed at 5 cm in front of the right eye of observers. A
SPIE-IS&T/ Vol. 7240 724016-3
Radeon graphic card was used to provide 10 bits DAC depth for each gun. The resolution of the monitor was 800×600 pixels with 72 Hz refresh rate. At the viewing distance of 120 cm, the size of a pixel was 1’. The computer program for experimental control was written in Matlab with Psychophysics Toolbox [23]. The input voltage-output intensity function for each monitor was measured by a LightMouse photometer [24] and the information was used to compute the linear look-up table to correct the non-linear properties of the monitor and to equalize the mean luminance of the two monitors.
Stimulus
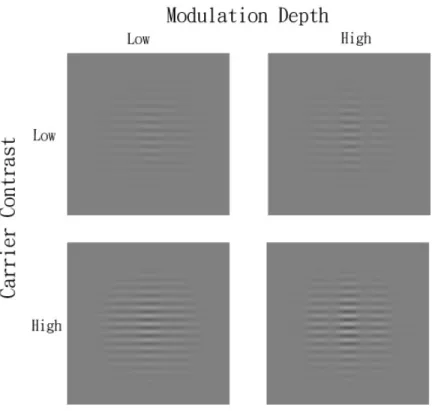
The stimuli were contrast modulated (CM) patterns (see Figure 2 for the demonstration of the used stimuli), which comprised the modulation of the contrast of horizontal gratings by a vertical Gabor function and it can be described by the following equation,
)] , ( 1 ( ) , ( 1 [ ) , (x y L0 cC x y mG x y L = + × + (1) where I0 is the mean luminance, C (x,y) is the function for the carrier, c the contrast of the carrier, G(x,y) the function for the envelope and m the contrast of the envelope, The carrier, a horizontal grating C (x,y), is described as followed:
) 2 cos( ) , (x y f y C = π c (2) where fc is the spatial frequency of the carrier wave, 8 cpd. The envelope is a vertical grating,
) 2 cos( ) , (x y f x G = π e (3) where fe is the spatial frequency of the envelope wave 2 cpd. Then the L(x,y) is multiplied by a Gaussian envelope with σe of 1.72 deg with 120 cm viewing distance.
Equation (1) can be rewritten as followed: )] , ( ) , ( ) , ( 1 [ ) , (x y L0 cC x y cC x y mG x y L = + + × (4) The advantage of this equation is that it separates the carrier image from its sideband image(C (x,y) × G(x,y)). Therefore, stimulus was constructed by presenting the carrier and the sideband on different monitor. Thus the modulation depth of the CM can be varied by simply changing the look-up tables of the sideband image. The modulation depth of the CM stimuli was defined as the contrast ratio between sideband images and carrier images. Two contrast levels of the carrier were used: -8 dB and -16dB.
Procedures
A temporal two-alternative force choice paradigm was used to measure the detection threshold of the target. In each trial, the mask was presented at both intervals and the target was presented randomly at either of the interval. The subjects were required to determine which interval contained the target pattern that produced a higher modulation depth. The constant stimuli method with feedback was used to measure the detection threshold. The psychometric function was fitted by the cumulated Gaussian function which is described as followed:
)) 2 ( 1 ( 2 1 5 . 0 ) ( σ μ − + + = Φ x erf x (5) SPIE-IS&T/ Vol. 7240 724016-4
Low
Modulation Depth
Low High
Iii gh
a
Figure 2. The demonstration of the stimuli used.
where the μ represents the mean and the σ the standard deviation of the Gaussian function and the value of 0.5 is the guessing rate for the 2AFC paradigm . A bootstrapping method was used to estimate μ and σ free parameters [25, 26]. The detection threshold was defined as the target depth modulation that produces 75% correct level and the standard deviation of the detection threshold was estimated by bootstrapping method. The target contrast threshold was measured at several mask contrast (modulation depth), sequence of which was randomized. For each run, 7 target contrast levels with 10 trials were measured. Each target threshold measure was the sum of at least 4 repeats for each observer, which means 280 trials for one psychometric function.
RESULTS
The TvM function for the second-order stimuli are shown in Figure 3. The open circles represent the contrast modulation threshold for the low carrier contrast condition (-16dB) and the closed circles represent the threshold for the high carrier contrast condition (-8dB). The smooth curves represent the best fit of the divisive inhibition model which will be discussed in the next section. The TvM functions all showed a typical dipper shape. That is, the threshold first decreased (facilitation) and then increased (suppression) with pedestal modulation depth. The greatest facilitation occurs at the modulation depth near the threshold of the pedestal itself. Such dipper shape was commonly observed in TvC functions for the first-order pattern masking. This implies that the nonlinear properties of the second-order visual pattern mechanisms are similar to those of the first-order mechanisms. When there was no pedestal (-∞ pedestal contrast), the detection threshold for lower carrier contrast was about twice (6dB) as high as that for high carrier contrast. This result was consistent with Schofield and Georgesons [1]. Such difference in threshold demised as the pedestal modulation depth increased thus the two TvM functions merged at high modulation depth.
SPIE-IS&T/ Vol. 7240 724016-5
0 -10 -a 0 -20 -25 (A) o low carrier cnt
high carrier cot
30 30
-Inf -20 -10 0 -Ird -20 -10
Pedestal Modulation Depth (dB)
(B)
O low carrier cnt high carriercnt
Pedestal Modulation Depth (dB)
Figure 3. The TvC function on the second-order stimuli for two subjects (A) CWC, and (B) PCH. The smooth curves are the fit of the divisive inhibition model. The white circles and gray line represent the condition for the low carrier contrast (-16dB) and the black circles and line represent the condition for the high carrier contrast (-8dB).
DISCUSSION
Basic Model
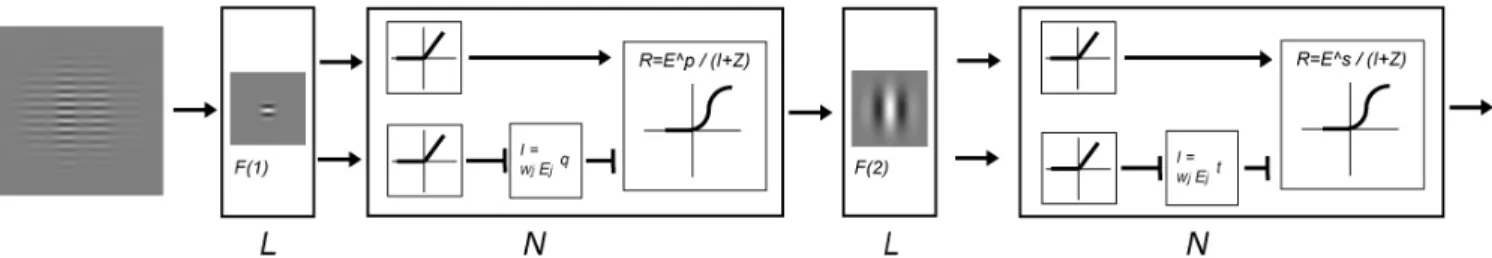
We expand a divisive inhibition model [27, 28] to account for the TvM function by incorporating elements of LNL models [11, 12]. Figure 4 shows the diagram of the model. This model contained several stages. At the first stage, the CM stimuli L(x,y) were convolved with a linear filter whose sensitivity profile f(x,y) was defined by a Gabor function and whose spatial frequency and orientation is the same as that of the carrier. The result of the convolution is the excitation of an array of neurons whose receptive field matches the sensitivity profile of the linear filter:
) , ( ' ' ' ) ' ,' ( ) ' ,' ( ) , ( 1cmL x y k dy dx y y x x f y x L y x E = − − • =
∫∫
(6) where k1 is a constant, c is the carrier contrast, m is the modulation depth and L’(x,y) has a form of a two-dimensional Gabor function. According to the divisive inhibition model [27, 28], the nonlinear response of the first-order filter, R, has the form:z y x I y x E y x R p + = ) , ( ) , ( ) , ( (7)
where I is the divisive inhibition input, p is an exponent parameter and z is an additive constant. Notice that I(x,y) is normal a nonlinear combination of all relevant E(x,y)’s and thus has the form of (k2cmL’(x,y))q where k2 is a constant and q is an exponent parameter[21]. In our experiment, the
lowest carrier contrast c is about 10 times the detection threshold. At this contrast range, compared with I, the size of z is negligible. Hence, the response is Eq. (7) can be approximated by
SPIE-IS&T/ Vol. 7240 724016-6
L
-N L NI
F(2)p
+
+ -1
R-Ep/(J Z)/
-i
+
+
R Es/(I Z)/
Figure 4. The diagram of divisive inhibition model used to derive response function for the second-order stimuli (see text for the details). q p q p p y x L m c k y x L m c k y x L m c k y x I y x E y x R = × × × − × × × × × × = ≅ [ '( , )] )] , ( ' [ )] , ( ' [ ) , ( ) , ( ) , ( 2 1 (8) where k = (k1/k2)p-q is a constant. This nonlinear response, according to the LNL models, is the input to the second-order filter. Figure 5(A) showed a simulated result on how this response changes with carrier contrast and modulation depth when the value of p-q is 4. The excitation of the second-order linear filter can be written as followed,
' ' ) ' ,' ( ) ' ,' ( ) , ( ' x y R x y f x x y y dx dy E =
∫∫
• − − (9) Since our experiment is to measure the discrimination threshold for the CM stimuli, we make the assumption that the threshold is determined by the mechanism showing the greatest response difference between the pedestal alone and the target plus the pedestal intervals. Hence, the second-order excitation should have the formq p q p m c Se y x E'( , )=( × − )× − (10) in which Se is a constant called the excitatory sensitivity of the second-stage linear filter. From the Eq. (10), the gain of modulation depth depends on two factors: (1) the sensitivity constant that is determined by the stimuli and the sensitivity profiles of the first- and the second-order linear filters; and (2) the carrier contrast and the first-order nonlinearity. The first factor is a constant in our experiment. The carrier contrast is systematically manipulated in our experiment. Hence, from the ratio of the gains to the modulation depth (Fig 5(B)), we can derive the nonlinearity of the first-order nonlinearity. The excitatory outputs of the linear filters are the half-wave rectified product of the sensitivity. That is ) 0 , max( ' j j E E = (11) and the magnitude of modulation in the stimulus raised to a power s. Each component of the stimulus (e.g. pedestal and target) produces both the excitatory and inhibitory inputs. The inhibition input (I) went through similar process except that inhibitory terms corresponding to the different component are raised to a power t before summed together. The response of the j-th mechanisms is the rectified excitation raised to a power s and then divided by a sum of a divisive inhibitory input I and an additive constant z'. That is,
' z I E j s i i = + Υ (12) SPIE-IS&T/ Vol. 7240 724016-7
Modulation Depth 100 16 14 12 10 0 8 18
(')
6 2 2 3 p-q valueSuppose the decision making for the pattern masking experiment is based on the greatest difference between the mask alone and the mask plus target condition. The threshold is reached when the difference in response, m t m Y Y D= + − (13) reaches a unity.
As mentioned in Eq. (10) and (12) that the excitatory outputs of the second-stage linear filter depend on the carrier contrast and the first-order nonlinearity. The output ratio between low and high carrier contrast can be re-written as below:
u l u h s q p q p l s q p q p h l h m Se m Se m c Se m c Se y x E y x E × × = × × × × = −− −− ) ( ) ( ) , ( ) , ( (14) We can replace (Se× chp-q)to Seh and (p-q)s to u. The same procedure is used for the inhibitory
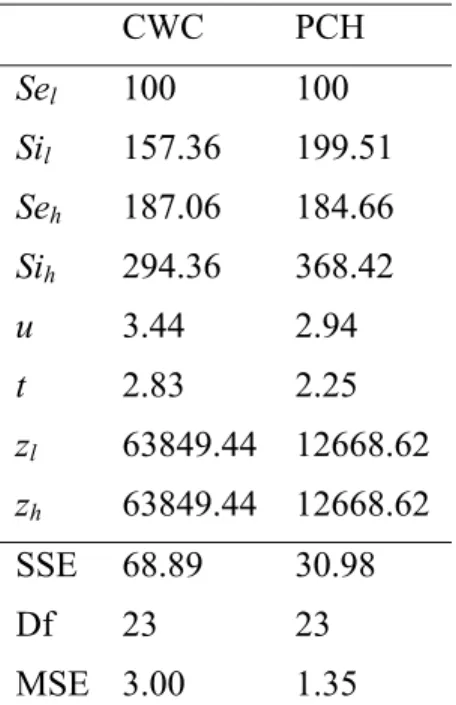
output. In addition, we assume that the ratio κ between Se and Si is fixed when the carrier contrast is varied. Thus in our model, 7 free parameters are used (Seh, Sel, Sih, κ, u, t, and z’).
Figure5. (A) The simulation results for the output of the second-stage linear filter when the non-linear process was assumed value of p-q is 4. (B) The simulation results for the output ratios between low (-16dB) and high (-8dB) carrier contrast at varied values of p-q.
The performance of the model
The parameters for this model are shown in the Table 1. As shown in Figure 3, the model fit the data very well. The RMSE was 1.73 for CWC and 1.16 for PCH. This is similar to the mean standard error of measurement 1.57 for CWC and 1.46 for PCH. The ratio between Seh and Sel was 1.87 and
1.85 for CWC and PCH respectively. From Eq. (14) and the carrier contrast we used (-8 and -16 dB), we derived the value of (p-q) as 0.68, 0.67 for CWC and PCH respectively. This first-order approximation of (p-q) was consistent with the previous findings using pattern masking paradigm to estimate the non-linear properties of the first-order visual mechanisms. More carrier contrast levels are needed to determine the exact values of p and q separately. The power parameter u was around 3.44 and 2.94 for CWC and PCH, respectively. According to Eq. (14), the raised powers for the excitatory second-order inputs were 5.04, 4.38 for CWC and PCH respectively. These values are
SPIE-IS&T/ Vol. 7240 724016-8
significant deviated from 1. That is, the rectification itself cannot explain our result. The value of u is larger than that of t (2.83, 2.25 for CWC and PCH respectively), suggesting that the inhibitory pooling is weaker than the facilitation for the second-order pattern mechanism which is similar to the first-order pattern mechanism. In addition, the value of Si is larger than Se, suggesting the inhibition is stronger than the facilitation, which is different from that reported for the first-order pattern vision27, 28. One possible explanation is that the carrier is not only a modulator but also a mask for the second-order pattern. Thus the inhibition is stronger than facilitation. The fit value of the additive z' is much larger than its counterpart for the first-order pattern mechanism. This greater additive constant balanced the increased power for both excitatory and inhibitory inputs to the second-order responses.
Table 1. Parameter values for the Model.
CWC PCH Sel 100 100 Sil 157.36 199.51 Seh 187.06 184.66 Sih 294.36 368.42 u 3.44 2.94 t 2.83 2.25 zl 63849.44 12668.62 zh 63849.44 12668.62 SSE 68.89 30.98 Df 23 23 MSE 3.00 1.35
The contamination of luminance artifact
One might argue that our results could be explained by the first-order mechanism. However, it is not the case. First, to complete the task, it needs to discriminate the modulation depth between (mask + carrier) and (mask + CM). Both of the combinations have the same contrast energy. Therefore, in order to discriminate the difference, the modulation depth would be the only criteria to do it. Second, it is known that overall r.m.s. contrast of the modulated carrier increases with modulation depth, even though the mean contrast does not. The changes follow the equation below,
2 / 1 2 . . . n m Crms = + (15) in which n is the carrier contrast, m is the modulation depth. We measured the discrimination threshold for the carrier at -16 dB and -8dB and it showed that the contrast needed to be raised to the value (∆n+n) to 1.23n and 1.17n for -16 and -8 dB respectively. From the equation mentioned above, a detectable r.m.s. contrast by modulation depth m > 1, 0.86 for low and high carrier contrast respectively. Our experimental results did not use such high modulation depth; therefore, our results
SPIE-IS&T/ Vol. 7240 724016-9
can not be explained by r.m.s. contrast changes. In conclusion, our data is explained by the second-order mechanism.
Conclusions
Our results showed a typical TvC function for the second-order stimuli and we expand a divisive inhibition model to account for the TvM function by incorporating elements of LNL models and it can describe the results very well. First, u and t values are significant deviated from 1, meaning the rectification only cannot explain our results. It suggests a change in the divisive inhibition to the second-order mechanisms. Second, we find Si values are larger when carrier contrast is high, suggesting a carrier may involve the masking effect. Furthermore, we found p-q values are consistent with previous findings by using first-order pattern masking paradigm, indicating the involvement of the non-linear processing between the first- and second-stage linear filter. Hence, we conclude that (1) divisive inhibition is necessary to explain the discrimination between two second-order stimuli and (2) the divisive inhibition is determined by both the first- and the second -order information in the stimuli.
REFERENCES
[1] Schofield, A.J. and Georgeson, M.A., “Sensitivity to modulations of luminance and contrast in visual white noise:
separate mechanisms with similar behaviour,” Vision Res 39, 2697-2716 (1999).
[2] Schofield, A.J. and Georgeson, M.A., “Sensitivity to contrast modulation: the spatial frequency dependence of
second-order vision,” Vision Res 43, 243-259 (2003).
[3] Mareschal, I. and Baker, C.L. Jr., “Temporal and spatial response to second-order stimuli in cat area 18,” J
Neurophysiol 80, 2811-2823 (1998).
[4] Baker, C.L., Jr. and Mareschal, I., “Processing of second-order stimuli in the visual cortex,” Prog Brain Res 134,
171-191 (2001).
[5] Calvert, J., et al., “Human cortical responses to contrast modulations of visual noise,” Vision Res 45, 2218-2230
(2005).
[6] Wilson, H., “The role of second-order motion signals in coherence and transparency,” Ciba Found Symp 227-237;
discussion 238-244, 269-271(1994).
[7] Graham, N. and Sutter, A., “Effect of spatial scale and background luminance on the intensive and spatial
nonlinearities in texture segregation,” Vision Res 36, 1371-1390 (1996).
[8] Graham, N. and Sutter, A., “Spatial summation in simple (fourier) and complex (non-fourier) texture channels,”
Vision Res 38, 231-257 (1998).
[9] Graham, N. and Sutter, A., “Normalization: Contrast-gain control in simple (fourier) and complex (non-fourier)
pathways of pattern vision,” Vision Res 40, 2737-2761 (2000).
[10] Sutter, A. and Graham, N., “Investigating simple and complex mechanisms in texture segregation using the
speed-accuracy tradeoff method,” Vision Res 35, 2825-2843(1995).
[11] Cavanagh, P. and Mather, G., “Motion: the long and short of it,” Spat Vis 4, 103-129(1989).
[12] Chubb, C. and Sperling G., “Drift-balanced random stimuli: a general basis for studying non-Fourier motion
perception,” J Opt Soc Am A 5, 1986-2007 (1988).
[13] Nachmias, J. and Rogowitz, B. E., “Masking by spatially-modulated gratings,” Vision Res 23, 1621-1629. (1983). [14] Klein, S. A., “Separating transducer non-linearities and multiplicative noise in contrast discrimination,” Vision Res
46, 4279-4293 (2006).
[15] Ross, J. and Speed, H. D., “Contrast adaptation and contrast masking in human vision,” Proc Biol Sci 246, 61-69
(1991).
[16] Chen, C., Foley, J. M., and Brainard, D. H., “Detection of chromoluminance patterns on chromoluminance pedestals
i: Threshold measurements,” Vision Res 40, 773-788 (2000).
SPIE-IS&T/ Vol. 7240 724016-10
[17] Chen, C., Foley, J. M., and Brainard, D. H., “Detection of chromoluminance patterns on chromoluminance pedestals
ii: Model,” Vision Res 40, 789-803 (2000).
[18] Chen, C. C., and Tyler, C. W., “Lateral sensitivity modulation explains the flanker effect in contrast discrimination,”
Proc Biol Sci 268, 509-516 (2001).
[19] Chen, C. C. and Tyler, C. W., “Excitatory and inhibitory interaction fields of flankers revealed by contrast-masking
functions,” J Vis 8, 1011-1014. (2008).
[20] Legge, G. E. and Foley, J. M., “Contrast masking in human vision,” Journal of the Optical Society of America 70,
1458-1470 (1980).
[21] Chen, C. C. and Foley, J. M., “Pattern detection: Interactions between oriented and concentric patterns,” Vision Res
42, 915-924 (2004).
[22] Kontsevich, L. L. and Tyler, C. W., “Nonlinearity of near-threshold contrast transduction,” Vision Res 39,
1869-1880 (1999).
[23] Brainard, D. H., “The psychophysics toolbox,” Spat Vis 10, 433-436 (1997).
[24] Tyler, C. W. and McBride, B., “The Morphonome image psychophysics software and a calibrator for Macintosh
systems,” Spat Vis 10, 479-484 (1997).
[25] Wichmann, F.A. and Hill, N.J., “The psychometric function: II. Bootstrap-based confidence intervals and sampling,”
Percept Psychophys 63, 1314-1329 (2001).
[26] Wichmann, F.A. and Hill, N.J., ” The psychometric function: I. Fitting, sampling, and goodness of fit,” Percept
Psychophys 63, 1293-1313 (2001).
[27] Foley, J. M., “Human luminance pattern-vision mechanisms: Masking experiments require a new model,” Journal of
the Optical Society of America A 11, 1710-1719 (1994).
[28] Foley, J. M., and Chen, C. C., ”Analysis of the effect of pattern adaptation on pattern pedestal effects: A two-process
model,” Vision Res 37, 2779-2788 (1997).
SPIE-IS&T/ Vol. 7240 724016-11