行政院國家科學委員會專題研究計畫 成果報告
高速 DPSK 訊號在光纖通信系統的傳輸(2/2)
計畫類別: 個別型計畫 計畫編號: NSC93-2213-E-002-061- 執行期間: 93 年 08 月 01 日至 94 年 07 月 31 日 執行單位: 國立臺灣大學電信工程學研究所 計畫主持人: 何鏡波 報告類型: 完整報告 處理方式: 本計畫可公開查詢中 華 民 國 94 年 11 月 3 日
行政院國家科學委員會專題研究計畫成果報告
高速 DPSK 訊號在光纖通信系統的傳輸(2/2)
High-Speed Transmission of DPSK Signals in Lightwave Systems
計畫編號: 93-2213-E-002-061-
執行期限: 93 年 8 月 1 日 至 94 年 7 月 31 日
主持人:何鏡波 副教授 國立台灣大學電信工程學研究所
1. 中文摘要 (關鍵字: 差分相位鍵移, 非線性相位雜訊, Kerr 效應, 光纖非線性效應) 本計劃研究以實驗驗證前期計畫非線性相 位雜訊的統計分析,利用現有儀器設備建立 理論模型驗證方法,並藉此相互驗證發現理 論模型與實驗量測結果非常吻合。為簡化分 析並減少非線性相位雜訊以外因素影響,本 實驗僅採用一組光纖及光放大器。在此系統 架構下,理論與實驗結果在訊雜比小於 1.5 dB 以內的量測誤差小於正負 0.15 dB,根據 理論及實驗結果皆顯示,在訊雜比小於 1 dB 的條件下,平均非線性相位偏移應小於 0.33 弧度。 Abstract:(Keywords: DPSK, Nonlinear phase noise, Kerr effect, Fiber nonlinearities.)
To simplify the analysis, the performance of
DPSK signals with nonlinear phase noise is calculated for receiver with an optical matched filter. With a particular single-span experimental setup isolating the contribution from nonlinear phase noise, the measured signal-to-noise ratio (SNR) penalty is within
0.15 dB of the theoretical results in a range of SNR penalty less than 1.5 dB. For a SNR penalty less than 1 dB, both theory and experiment indicate that the mean nonlinear phase shift should be less than 0.33 rad.
±
2. Introduction
Recently, differential phase-shift-keying (DPSK) signal is widely used for long-haul and spectrally efficient transmission systems [1]-[6]. DPSK signals have 3-dB better receiver sensitivity with balance detection and possess larger tolerance to fiber nonlinearities such as self- and cross-phase modulation (SPM and XPM) than on-off keying [6].
When optical amplifiers are used periodically to compensate for fiber loss, nonlinear phase noise is induced by the interaction of amplifier noises and the fiber Kerr effect. Nonlinear phase noise is often called the Gordon- Mollenauer effect [7], or more precisely, SPM-induced nonlinear phase noise. The nonlinear phase noise is found to be non-Gaussian distributed both experimentally [8] and theoretically [9][10]. Recently, we also showed that nonlinear phase noise is the dominant noise and is far larger than intrachannel four-wave-mixing (IFWM) [11]. An accurate model is required to evaluate the performance of a DPSK signal with nonlinear phase noise, especially in the quasilinear regime.
Early works found the error probability of DPSK signals with large number (over 32) of fiber spans [12], [13]. For experimental verification, those complicated systems are difficult to control and the impact of nonlinear
DPSK Tx.
EDFA Gain Controlled EDFA
photodiode
( )t i
Interferometer
Fig 1. The system diagram of the experiment
phase noise to the signals is also difficult to isolate. Recently, taking into account the dependence between amplifier noises and nonlinear phase noise, the exact error probability of DPSK signals with nonlinear phase noise is derived for small number of fiber spans [14]. The model of [14] facilitates simple experimental verification. To isolate the impact of nonlinear phase noise and simplify the comparison, a single-span DPSK system is used here to compare the theoretical results with experimental measurements.
Currently, the performance of DPSK signals with nonlinear phase noise is evaluated for a system with optical matched filter for its quantum-limited performance [12]-[14]. However, typical DPSK receiver is worse than the quantum-limited sensitivity of 20 photons/bit (3.5 dB worse in [15]). We find experimentally that the signal-to-noise ratio (SNR) penalty from the simplified matched-filter based analysis is applicable to more general receivers. Typically used in the analysis of digital communication systems, matched-filter based analysis is not commonly used in lightwave systems.
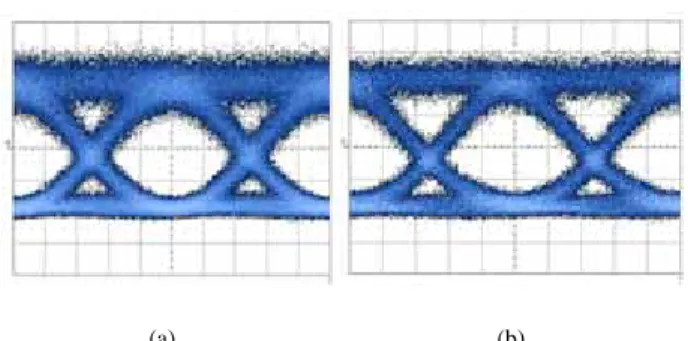
(a) (b)
Fig. 2. Eye diagram of the demodulated signal at the photoreceiver output for an error probability of 10-9. (a) back–to-back transmission (b) a mean nonlinear phase shift of 0.5 rad. The SNR of (b) is about 3.7 dB better than that of (a).
3. Experiment and Results
Fig. 1 is the experimental setup to measure the impact of nonlinear phase noise to DPSK signals. The design of the experiment of Fig. 1 is aimed to isolate the impact of nonlinear phase noise to the signal and minimize the
number of system parameters. Fig. 1 has only a single fiber span and a transmitted signal as the summation of the signal and noise of EG0+nG, both in teams of electric field. The nonlinear phase noise is [7], [10], [14]
2 NL γLeff E0 n
Φ = G +G , (1) where γ = 1.24 rad/km/W is the fiber nonlinear coefficient and Leff = 13.1 km is the effective
nonlinear length for a fiber length of 20 km and loss coefficient of 0.2 dB/km. For a simplified analysis to reduce uncertainty, no pre-amplifier is used in the receiver such that the SNR at the beginning and end of the fiber link is the same. Only a fiber length of 20 km is used such that chromatic dispersion does not induce a large degradation to the signal and dispersion management is not required. The experiment of Fig. 1 is the minimal setup to study the impact of nonlinear phase noise to an optical signal.
Non-return-to-zero (NRZ) DPSK signal with bit rate 10-Gb/ is used in Fig. 1. With very small relative-intensity noise, the wavelength of the optical carrier is 1553.3 nm. The DPSK transmitter is driven by a 10-Gb/s NRZ 27 – 1 or 231 – 1 pseudo-random bit sequence (PRBS),
modulated to a single-drive zero-chirp push-pull Mach-Zehnder modulator (MZM). The MZM is biased at the minimum transmission point and modulated with a peak-to-peak voltage of 2Vπ. The usage of a MZM effectively as a phase modulator has been discussed in [1]-[3] and [6].
The optical variable attenuator after the DPSK transmitter is used to reduce the signal power and followed by an Erbium-doped fiber amplifier (EDFA). The combination of attenuator and EDFA adjusts the SNR of the lunched signal. An optical filter with a bandwidth of about 0.9 nm is used to reject the out-of-band amplified spontaneous emission (ASE) because the current experiment studies only SPM-induced nonlinear phase noise. The out-of-band ASE may also saturate the EDFA afterward. The optical power after the optical filter varies with the SNR but is typically around 3 to 4 dBm. A gain-controlled EDFA amplifies the filtered signal to control the mean nonlinear phase shift of
2 NL γLeff E0
Φ ≈ G .
A 20-km standard single-mode fiber is used to generate the nonlinear phase noise. The fiber loss is about 4 dB. The overall loss of the fiber must be small such that no EDFA is required in the receiver to give additional ASE source. The SNR of launched signal and received signal is identical where the error probability of the DPSK signal can be found using a very simple model of [14] with a single fiber span.
0 0.1 0.2 0.3 0.4 0.5 0 0.5 1 1.5 2 2.5
Mean Nonlinear Phase Shift <ΦNL> (rad)
SNR Penalty (dB)
: Exact : Approximation : 27 − 1 PRBS : 231 − 1 PRBS
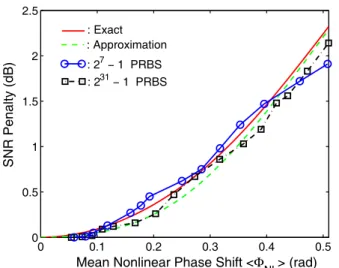
Fig. 3. The SNR penalty as a function of mean nonlinear phase shift. Both theoretical and experimental results are shown for comparison.
Followed another narrowband optical filter having a bandwidth of about 0.35 nm, the direct-detection DPSK receiver consists of an asymmetric Mach-Zehnder interferometer and a single-end photoreceiver. The interferometer converts a DPSK signal to an equivalent on-off keying signal. The single-end receiver has a receiver sensitivity of about –19 dBm for 10-Gb/s on-off keying signal. An optical attenuator is used to fix the received power at –12 dBm to reduce the impact of thermal noise. Single-end and balanced receivers have 3-dB difference for DPSK signals.
Fig. 2(a) shows the eye-diagram at the output of the receiver for back-to-back transmission. Using 231 – 1 PRBS, the SNR is about 21.0 dB for an error probability of 10-9. Fig. 2(b) is the eye-diagram for a mean nonlinear phase shift of 0.5 rad with a SNR about 24.7 dB. With larger SNR, the eye-diagram after transmission looks better than that for back-to-back transmission for the same error probability. The error probability of Fig. 2(b) is the same as that of Fig. 2(a) due to nonlinear phase noise. The SNR is measured over a signal bandwidth of 10 GHz for a single polarization, the same as the definition in [7] and [11]-[14] for theoretical analysis.
Fig. 3 shows the measured SNR penalty as a function of mean nonlinear phase shift for error
probability of 10-9. Using 27 – 1 or 231 – 1 PRBS, the SNR penalty of Fig. 3 is with respect to 21.4 and 22.7 dB, respectively, when the mean nonlinear phase shift is equal to about 0.05 rad, the lowest launched power to maintain –12 dBm at the photoreceiver. For 231 – 1 PRBS, the receiver of Fig. 1 is about 9.7 dB worse than an ideal DPSK receiver with the quantum-limited sensitivity of 13 dB (or 20 photon/bit). The single-end receiver is 3.0 dB worse than a balanced receiver. Additional degradation includes about 1.7 dB (231 – 1 PRBS) for the penalty due to the 20-km fiber link, the extra 5.0 dB degradation is larger than that in [15] but comparable to that in [16]. The 5-dB penalty may constitute 0.4 dB due to noise from orthogonal polarization, 0.7 dB due to thermal noise from the receiver, about 1.2 dB due to the wide optical filter bandwidth, and 2.7 dB due to other signal imperfections. After the fiber, the receiver has a degradation of 1.3 dB due to long PRBS pattern. For back-to-back measurement, the degradation due to long pattern is only 0.4 dB. Among the 2.7 dB, 1.3 dB may be attributed to the long PRBS pattern. The remaining 1.4 dB may be due to the phase ripples of the transmitted signal, the frequency response ripples of the receiver, phase error of the interferometer, and other imperfections.
With only a single noise source at the transmitter, the received signal is
(
0)
exp( )r
E =κ EG +nG jΦNL , (2) where κ is a constant factor for the fiber loss, and the nonlinear phase noise of ΦNL is given
by (1). To a certain extend, the experimental setup of Fig. 1 is especially designed for the received signal of (2) for its simplicity. For a system with optical matched filter, the system performance is analyzed in both [14] and [17]
for the signal of (2). The nonlinear phase noise of ΦNL of (1) has a chi-squared distribution
with a characteristic function of that in [10] with a single fiber span. When the nonlinear phase noise of ΦNL is assumed to be
independent of the phase of the signal of n
EG0+G, the error probability of the signal was studied in [16] as an approximated model. When dependence between the nonlinear phase noise of ΦNL and the phase of E n
G G
+
0 is taken into account, the error probability of the signal was given in [14]. Both [14] and [17] are for systems with balanced detection instead of the single-end detection of Fig. 1. Further numerical calculations show that other than about 3 dB more penalty, the usage of single-end receiver does not change the results of Fig. 3 in the range of SNR penalty less than 2 dB. If the nonlinear phase noise difference between two consecutive symbols is outside the angles of ±π/2, the error probability for both single-end and balanced receivers is independent of SNR and larger than 1/2. With very large nonlinear phase noise, single-end and balanced receivers may perform similarly but the SNR penalty is far larger than 2 dB [8] and outside the interested region.
Fig. 3 also shows the SNR penalty calculated by the approximated [16] and exact [14] models as dashed and solid lines, respectively. In terms of SNR penalty and for DPSK signals, the difference between the approximated and exact models is less than 0.12 dB for the single-span signal of (2). The measured SNR penalty is very close to the theoretical SNR penalty. The difference between theoretical and experimental results is less than 0.15 dB for SNR penalty less than 1.5 dB. The discrepancy is larger for SNR penalty larger than 1.5 dB. For practical system design, the range of SNR
penalty around 1 dB is very important and usually gives optimal system performance. With some measurement uncertainty, the SNR penalty from both 27 – 1 and 231 – 1 matches well with the theoretical SNR penalty.
4. Conclusion
Designed specially to verify the simplest case of [14], for a single-span system with nonlinear phase noise, 10-Gb/s NRZ-DPSK signals have a SNR penalty close to the theoretical prediction. We validate the simplified theory for a receiver with optical matched filter. The difference between theoretical and experimental results is within
0.15 dB. For 1-dB SNR penalty, the DPSK signal can tolerate about 0.33 rad of the mean nonlinear phase shift for the single-span system.
±
References
[1] A. H. Gnauck et al., OFC '02, postdeadline paper FC2.
[2] C. Rasmussen et al., OFC '03, postdeadline paper PD18.
[3] J.-X. Cai et al., OFC '04, postdeadline paper PDP34. [4] P. S. Cho et al., IEEE Photon. Technol. Lett., 15, 473
(2003).
[5] N. Yoshikane and I. Morita, OFC '04, postdeadline paper PDP38.
[6] A. H. Gnauck and P. J. Winzer, J. Lightwave Technol., 23, 115 (2005).
[7] J. P. Gordon and L. F. Mollenauer, Opt. Lett., 15, 1351 (1990).
[8] H. Kim and A. H. Gnauck, IEEE Photon. Technol. Lett., 15, 320 (2003).
[9] K.-P. Ho, Opt. Lett., 28, 1350 (2003).
[10] K.-P. Ho, J. Opt. Soc. Am. B, 20, 1875 (2003). [11] K.-P. Ho and H.-C. Wang, IEEE Photon. Technol.
Lett., 17, 1426 (2005).
[12] A. Mecozzi, J. Lightwave Technol., 12, 1993 (1994). [13] K.-P. Ho, IEEE Photon. Technol. Lett., 16, 1403
(2004).
[14] K.-P. Ho, 2004 IEEE/LEOS Workshop on Advanced Modulation Formats, San Francisco, CA, ThC4. [15] A. H. Gnauck, S. Chandrasekhar, J. Leuthold, and L.
Stulz, IEEE Photon. Technol. Lett., 15, 99 (2003). [16] E. A. Swanson, J. C. Livas, and R. S. Bondurant,
IEEE Photon. Technol. Lett., 6, 263 (1994).
[17] K.-P. Ho, IEEE Photon. Technol. Lett., 15, 1216 (2003).