AN AUTOMATIC METHOD FOR SELECTING THE PARAMETER OF THE RBF KERNEL
FUNCTION TO SUPPORT VECTOR MACHINES
Cheng-Hsuan Li
1, 2Chin-Teng
Lin
1Bor-Chen
Kuo
2Hui-Shan
Chu
2[email protected]
[email protected]
[email protected]
[email protected]
1
Institute of Electrical Control Engineering, National Chiao Tung University, Hsinchu, Taiwan, R.O.C.
2Graduate Institute of Educational Measurement and Statistics, National Taichung University,
Taichung, Taiwan, R.O.C.
ABSTRACT
Support vector machine (SVM) is one of the most powerful techniques for supervised classification. However, the performances of SVMs are based on choosing the proper kernel functions or proper parameters of a kernel function. It is extremely time consuming by applying the k-fold cross-validation (CV) to choose the almost best parameter. Nevertheless, the searching range and fineness of the grid method should be determined in advance. In this paper, an automatic method for selecting the parameter of the RBF kernel function is proposed. In the experimental results, it costs very little time than k-fold cross-validation for selecting the parameter by our proposed method. Moreover, the corresponding SVMs can obtain more accurate or at least equal performance than SVMs by applying k-fold cross-validation to determine the parameter.
Index Terms— Support vector machine, kernel method, optimal kernel
1. INTRODUCTION
In the recent years, support vector machines (SVMs) are widely and successfully used in several remote sensing studies. In many studies, they performed more accurately than other classifiers or performed at least equally well [1]-[6], since SVMs have three properties: 1) they can handle large input spaces efficiently; 2) they are robust for dealing with noisy samples; and 3) they can produce sparse solutions [3].
However, the performances of SVMs are based on choosing the proper kernel functions or proper parameters of a kernel function [6]-[9]. In generally, a “grid-search” on parameters of SVMs with the k-fold cross-validation (CV) is used for choosing the parameter and prevents the overfitting problem [6]-[7]. Nevertheless, it is time consuming. Furthermore, before doing a grid-search, a better region and fineness on the grid should be determined in advance.
In this paper, we will propose an automatic method for selecting the parameter of the RBF kernel function. The experimental results indicate that the searching efficiency is much improved and the corresponding performance is almost as good as the SVM with grid-search. The paper is organized as following. The review of SVM is introduced in Section 2. The proposed search method will be introduced in section 3. The experiments on hyperspectral image datasets are designed to evaluate the performances of the proposed method in section 4 and the experimental results are also reported in this section. Section 5 contains comments and conclusions.
2. SOFT-MARGIN SUPPORT VECTOR MACHINE SVM is to find a hyperplane in the feature space, a Hilbert space , in the middle of the most separated margins between two classes, and this hyperplane can be applied for classifying the new testing samples [1]-[7]. Let
and be a set of training samples and the corresponding label set, respectively. The soft-margin SVM algorithm is performed by the following constrained minimization optimal problem:
where is a vector normal to the hyperplane, is a constant such that represents the distance of hyperplane from the origin space, is a nonlinear mapping function, ’s are slack variables to control the training errors, and is a penalty parameter that permits to tune the generalization capability. In general, an equivalent dual representation by using the Lagrange optimization is used to find the optimizer. The corresponding dual Lagrange function is defined as:
836
where artificial variable ’s are Lagrange multipliers. According to the Mercer’s theorem, the can be replaced by a kernel function which is used to implicitly map samples from original space to a feature space without knowing the function .
The Gaussian radial basis function (RBF) kernel,
is one of the most popular kernel functions with convincing performance and is a reasonable first choice [7], where
is the parameter. Different value of the parameter indicates that different corresponding mapping
and the corresponding feature space is adopted. Once the ’s are determined, any new test pattern
is associated with a forecasting label ,
where is chosen so that
for any with .
There are two parameters, and , for soft-margin SVM with the RBF kernel. Which are the best for a given problem is unknown beforehand. To identify good and so that the classifier can accurately predict unknown samples is the main goal. A “grid-search” on and of SVMs with the k-fold cross-validation (CV) is often used and prevents the overfitting problem [6]-[7]. However, this approach is extremely time-consuming, especially for the large training data set situation or the high-dimensional dataset situation. Moreover, the range and fineness of the grid could also affect the quality of the selected parameter value. Hence, in the next section, an automatic way for determining the value of is proposed for solving this parameter selection problem.
3. AUTOMATIC RBF PARAMETER SELECTION Suppose is the set of training samples in class ,
. There are two important properties of the
RBF kernel function: (1) , ,
i.e., the norm of every sample in the feature space is 1 and
(2) , , i.e., the cosine
value of two training samples and in the feature space can be computed by and it determines the similarity between these two samples.
Based on the above two observations and the concepts, two properties are desired and described as follows. (1) The samples in the same class should be mapped into the same area in the feature space and (2) the samples in the different classes should be mapped into the different areas. We want to find a proper parameter such that
(1) and
(2)
In this paper, two criterions are proposed for measuring these properties. First one is the mean of values applied by the RBF kernel function on the samples in the same class:
,
where is the number of training samples in class . The parameter should be determined such that closes to 1. Second one is the mean of values applied by the RBF kernel function on the samples in the different classes:
.
So should be determined also such that closes to 0. It
is easy to find that and . Hence,
the optimal can be obtained by solving the following optimization problem:
.
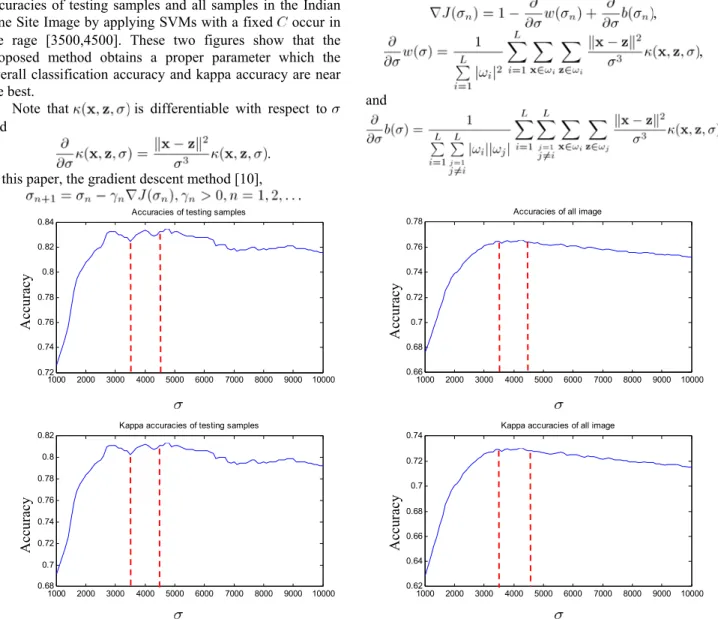
Fig. 1. vs. . The optimizer locates in the range [3500,4000]. The shape of the function by using the Indian Pine Site dataset which details will be described in the next section is shown in Figure 1. The horizontal and vertical axes are the values of the parameter and the corresponding , respectively. This graph indicates that has only one minimum value which is the desired selected value of in the proposed method. Figure 2 shows the accuracies and kappa accuracies of testing samples and all samples in the Indian Pine Site Image at different by applying soft-margin SVMs with a fixed . One can note that the minimum of in Fig. 1 locates in the range 0 0.2 0.4 0.6 0.8 1 1.2 1.4 1.6 1.8 2 x 10⁵ 0.65 0.7 0.75 0.8 0.85 0.9 0.95 1 837
[3500,4000] and the near optimal overall and kappa accuracies of testing samples and all samples in the Indian Pine Site Image by applying SVMs with a fixed occur in the rage [3500,4500]. These two figures show that the proposed method obtains a proper parameter which the overall classification accuracy and kappa accuracy are near the best.
Note that is differentiable with respect to and
. In this paper, the gradient descent method [10],
is used to solve the proposed optimization problem, where ,
, and
Fig. 2. There are accuracies and kappa accuracies of testing samples and all samples in the Indian Pine Site Image at different by applying SVMs with a fixed . The near optimal performances occur in the rage [3500,4500].
4. EXPERIMENTS
In this study, for investigating the influences of training sample sizes to the dimension, three distinct cases,
(case 1), (case 2), and (case 3), will be discussed. The MultiSpec [11] was used to select training and testing samples (100 testing samples per class) in our experiments which is the same method in [11], [12], and [13].
Two real data sets are applied to compare the performances. They are the Indian Pine, a mixed forest/agricultural site in Indiana, and the Washington, DC Mall hyperspectral image [11] as an urban site. The first one
of these data sets was gathered by a sensor known as the Airborne Visible/Infrared Imaging Spectrometer (AVIRIS). The Indian Pine image, mounted from an aircraft flown at 65000 ft altitude and operated by the NASA/Jet Propulsion Laboratory, with the size of 145 × 145 pixels has 220 spectral bands measuring approximately 20 m across on the ground. Since the size of samples in some classes are too small to retain enough disjoint samples for training and testing, only eight classes, Cornmin, Corn-notill, Soybean-clean, Grass/Pasture, Soybeans-min, Hay-windrowed, Soybeans-notill, andWoods, were selected for the experiments.
The other data set, Washington, DC Mall from an urban area, is a Hyperspectral Digital Imagery Collection
1000 2000 3000 4000 5000 6000 7000 8000 9000 10000 0.72 0.74 0.76 0.78 0.8 0.82 0.84
Accuracies of testing samples
1000 2000 3000 4000 5000 6000 7000 8000 9000 10000 0.66 0.68 0.7 0.72 0.74 0.76 0.78
Accuracies of all image
1000 2000 3000 4000 5000 6000 7000 8000 9000 10000 0.68 0.7 0.72 0.74 0.76 0.78 0.8 0.82
Kappa accuracies of testing samples
1000 2000 3000 4000 5000 6000 7000 8000 9000 10000 0.62 0.64 0.66 0.68 0.7 0.72 0.74
Kappa accuracies of all image
Accu racy Accur acy Accu racy Accu racy 838
Experiment airborne hyperspectral data flight line over the Washington, DC Mall. Two hundred and ten bands were collected in the 0.4–2.4 m region of the visible and infrared spectrum. Some water-absorption channels are discarded, resulting in 191 channels [11]. There are seven information classes, roofs, roads, trails, grass, trees, water, and shadows, in the data set.
The purpose of this experiment is to compare the multiclass classification performances of the soft-margin SVMs with the RBF kernel function by applying the proposed method (OP) and the 5-fold cross-validation (CV) to find the best within the given set of parameters. Both the parameters of OP and CV should still be selected via grid-search on the set .
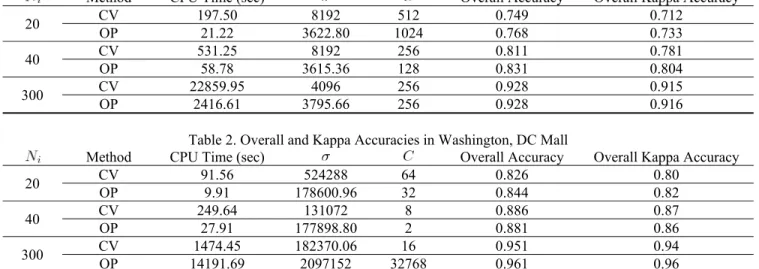
Table 1 and 2 are the overall and kappa accuracies in Indian Pine dataset and Washington, DC dataset,
respectively. One can find that the cost of time for proposed method is less 9 times than the 5-fold cross-validation on both two datasets. Moreover, the classification results show that the soft-margin SVMs with RBF kernel function using OP to find the parameter can obtain more accurate in the small sample size.
4. CONCLUSION
In this paper, an automatic method for selecting the parameter of the RBF kernel was proposed, and we have compared it and k-fold cross-validation experimentally. The experimental results of two hyperspectral images show that the cost of the proposed method is less 9 times. Furthermore, we will try to develop the framework to other kernel functions
Table 1. Overall and Kappa Accuracies in Indian Pine Dataset
Method CPU Time (sec) Overall Accuracy Overall Kappa Accuracy
20 CV 197.50 8192 512 0.749 0.712 OP 21.22 3622.80 1024 0.768 0.733 40 CV 531.25 8192 256 0.811 0.781 OP 58.78 3615.36 128 0.831 0.804 300 CV 22859.95 4096 256 0.928 0.915 OP 2416.61 3795.66 256 0.928 0.916
Table 2. Overall and Kappa Accuracies in Washington, DC Mall
Method CPU Time (sec) Overall Accuracy Overall Kappa Accuracy
20 CV 91.56 524288 64 0.826 0.80 OP 9.91 178600.96 32 0.844 0.82 40 CV 249.64 131072 8 0.886 0.87 OP 27.91 177898.80 2 0.881 0.86 300 CV 1474.45 OP 14191.69 182370.06 2097152 32768 0.961 16 0.951 0.94 0.96 11. REFERENCES
[1] S. T. John and C. Nello, Kernel Methods for Pattern Analysis. Cambridge, U.K.: Cambridge Univ. Press, 2004.
[2] F.Melgani and L. Bruzzone, “Classification of hyperspectral remote sensing images with support vector machines,” IEEE Trans. Geosci. Remote Sens., vol. 42, no. 8, pp. 1778–1790, Aug. 2004. [3] G. Camps-Valls and L. Bruzzone, “Kernel-based methods for hyperspectral image classification,” IEEE Trans. Geosci. Remote Sens., vol. 43, no. 6, pp. 1351–1362, Jun. 2005.
[4] G. Camps-Valls, L. Gomez-Chova, J. Munoz-Mari, J. L. Rojo-Alvarez, and M. Martinez-Ramon, “Kernel-based framework for multitemporal and multisource remote sensing data classification and change detection,” IEEE Trans. Geosci. Remote Sens., vol. 46, no. 6, pp. 1822–1835, Mar. 2008.
[5] G. Camps-Valls and L. Bruzzone, Kernel Methods for Remote Sensing Data Analysis. John Wiley & Sons, Ltd, 2009.
[6] G. Camps-Valls, L. Gómez-Chova, J. Calpe, E. Soria, J. D. Martín, L. Alonso, and J. Moreno, “Robust support vector method for hyperspectral data classification and knowledge discovery,” IEEE Trans. Geosci. Remote Sens., vol. 42, no. 7, pp. 1530–1542, Jul. 2004.
[7] C.C. Chang and C.J. Lin, LIBSVM: A Library for Support Vector Machines, 2001. Software available at
http://www.csie.ntu.edu.tw/~cjlin/libsvm
[8] H.L. Xiong, M.N.S. Swamy, M. Omair Ahmad, “Optimizing the kernel in the empirical feature space,” IEEE Trans. Neural Networks 16 (2) (2005) 460–474.
[9] B. Chen, H. Liu, and Z. Bao, “Optimizing the data-dependent kernel under a unified kernel optimization framework,” Pattern Recognition, vol. 41, pp. 2107-2119, 2007.
[10] E.K.P. Chong and S.H. Zak, An Introduction to Optimization, 3rd edition, John Wiley & Sons, Inc., New York, NY, USA, 2008. [11] D.A. Landgrebe, Signal Theory Methods in Multispectral Remote Sensing. Hoboken, NJ: Wiley, 2003.
[12] J.A. Benediktsson, J.A. Palmason, and J.R. Sveinsson, “Classification of hyperspectral data from urban areas based on extended morphological profiles,” IEEE Trans. Geosci. Remote Sens., vol. 43, no. 3, pp. 480–491, Mar. 2005.
[13] B.S. Sebastiano and M. Gabriele, “Extraction of spectral channels from hyperspectral images for classification purposes,” IEEE Trans. Geosci. Remote Sens., vol. 45, no. 2, pp. 484–495, Feb. 2007.