行政院國家科學委員會專題研究計畫 成果報告
臺灣死亡現象之地理差異
計畫類別: 個別型計畫 計畫編號: NSC91-2320-B-002-165- 執行期間: 91 年 08 月 01 日至 92 年 07 月 31 日 執行單位: 國立臺灣大學公共衛生學院衛生政策與管理研究所 計畫主持人: 江東亮 報告類型: 精簡報告 處理方式: 本計畫可公開查詢中 華 民 國 92 年 10 月 31 日
臺灣死亡現象之地理差異
Geographic disparity of mortality in Taiwan
計畫編號:NSC-91-2320-B-002-165 執行期限:91 年 8 月 1 日至 92 年 7 月 31 日 主持人:江東亮 國立臺灣大學公共衛生學院 一、 中文摘要 本研究旨在探討 1976-2000 年臺灣死 亡現象的地理差異趨勢,尤其是醫療網計 畫與全民健康保險對地理差異的作用。資 料來源包括:台閩地區人口統計、死亡登 記資料檔、家庭收支調查,以及戶口及住 宅普查報告。首先,我們發現:5-64 歲年 齡標準化全死因死亡率以及醫療可避免死 亡率分別由 1976 年的 3.3‰和 1.0‰下降至 2000 年的 2.8‰和 0.4‰。複迴歸分析結果 顯示: 無論縣市層級或鄉鎮市區層級全死 因及醫療可避免死亡率皆與剝奪程度息息 相關;以及雖然醫療可避免死亡率地理差 異則在全民健保實施後即不再惡化,但全 死因死亡率的地理差異卻繼續擴大。因 此,未來應深入探討造成臺灣死亡現象地 理差異惡化的機轉。 關鍵字:醫療可避免死亡、地理差異、臺 灣 二、 英文摘要
The study aimed to examine the trends in the geographic disparity of mortality in Taiwan, 1976-2000, with a focus on the
impact of the medical care regionalization program and the national health insurance. Data for the analysis came from the demographic fact books, the death certificate database, the family income and expenditure survey, and the population census report. We found that, for the population aged 5-64, age-standardized all-cause mortality and medically avoidable mortality had declined from 3.3‰ and 1.0‰ in 1976 to 2.8‰ and 4‰ in 2000, respectively. The results of multiple regression analysis indicated that area deprivation has been significantly associated with all-cause mortality and medically avoidable mortality, and that, although the geographic disparity of medically avoidable mortality has no longer worsen after the introduction of national health insurance, the geographic disparity of all-cause mortality has continued widening. Future research should be directed to understand mechanisms linking area deprivation to the widening geographic disparity of all-cause mortality in Taiwan.
Keywords: medically avoidable mortality,
三、 緣起與目的 臺灣不但創造經濟奇蹟,而且也創造 了健康奇蹟。2000 年,臺灣男女兩性的平 均壽命已分別高達 72.6 歲與 78.3 歲 [1]。 然而,不同縣市或鄉鎮市區並沒有得到同 樣的改善,健康狀況的地理差異仍然十分 嚴重。例如,2000 年以台北市的年齡標準 化死亡率最低,祇有 4.2‰,而台東縣則高 達 7.5‰ [2]。遺憾的是,在全球普遍重視 健康不平等之際 [3-4],臺灣對本身的健康 狀況地理差異卻不甚關心。有鑑於此,本 研究擬檢視與解讀 1976-2000 年臺灣死亡 現象的地理差異趨勢,尤其是醫療網計畫 與全民健康保險對地理差異的作用。 四、 材料與方法 資料來源 本研究的觀察期間為 1976-2000 年; 分析單位為縣市及鄉鎮市區;收集資料包 括:人口、死亡,以及社經狀況等三類。 人口資料來自歷年內政部出版之台閩地區 人口統計;死亡資料則來自行政院衛生署 之死亡登記資料檔。依據戶籍法,所有死 亡案件必須於死亡後 15 日內,由申請人向 地方戶政事務所登記,而地方衛生所則必 須例行收集死亡登記上向呈報,輸入衛生 署 死 亡 登 記 資 料 檔 。 關 於 死 因 分 類 , 1971-1980 年採第八版國際死因及疾病分 類 (ICD-8),1981 年之後則根據第九版國 際死因及疾病分類 (ICD-9)。為了分析醫 療對死亡趨勢的影響,我們參考 Rutstein 等 [5],Charlton 等 [6],以及 Holland 等 [7] 研 究 後 , 列 舉 醫 療 可 避 免 死 因 (medically avoidable causes of death),詳如 表 1。我們計算 5-64 歲全死因死亡率和醫 療可避免死亡率。排除 65 歲以上人口係計 算可避免死亡率之慣例;排除 5 歲以下人 口則是為避免受臺灣早期死亡登記不完整 的影響。 地區之社經狀況資料來自行政院主計 處每年舉辦之「家庭收支調查」及每十年 舉辦之「戶口及住宅普查 (簡稱戶口普 查)」。就縣市層級而言,我們先合併新竹 縣市為新竹縣以及嘉義縣市為嘉義縣,然 後以 1980 年平均家庭所得高低定義剝奪 程度,將臺灣二十一縣市均分為三組;家 庭所得越高,剝奪程度越低。就鄉鎮市區 層級而言,我們先配合行政區域劃分變遷 歸併部分鄉鎮市區,然後利用 1980 年戶口 普查資料發展剝奪指數,將歸併後 355 個 鄉鎮市區等分為高、中、低剝奪三組。 剝奪指數的建立過程如下:首先,綜 合分析各類可能符合剝奪意義的指標變項 後,然後選取初級行業人口比例以及 15-17 歲不在學率為測量指標。接著,我們將各 指標值標準化為 Z 值(平均值為 0;標準差 為 1),並且將兩指標的 Z 值相加為剝奪指 數值;指數值越高,剝奪程度亦越高。1980 年,鄉鎮市區剝奪指數值介於+4.54 (屏東
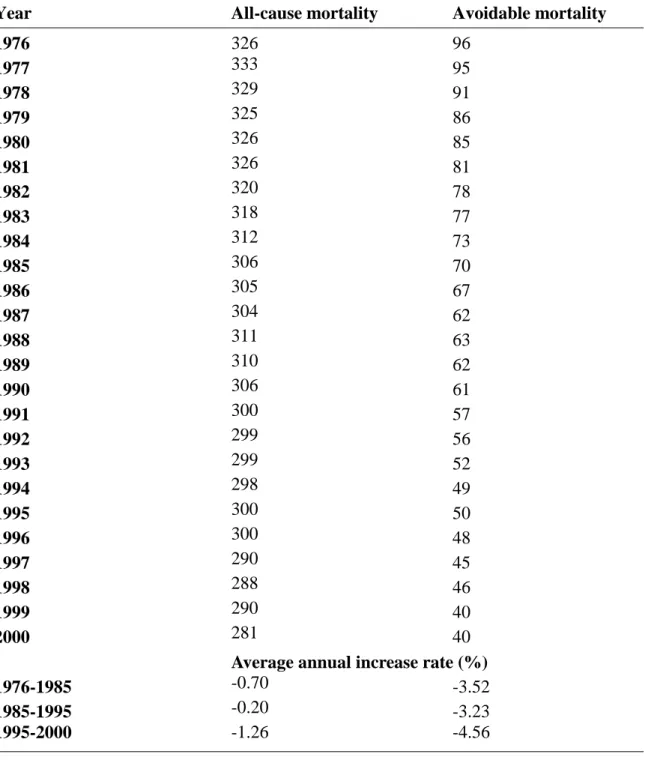
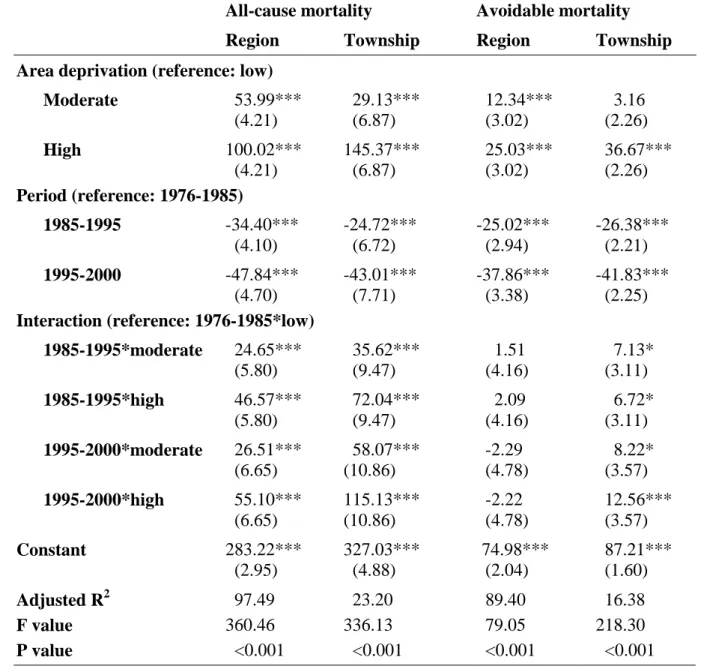
縣春日鄉)與-4.03 (台南市中區) 之間。 統計分析 為了避免人口年齡結構不同與改變對 死亡率的影響,我們以 1976 年世界人口為 標準人口,調整縣市別及鄉鎮市區別全死 因死亡率及醫療可避免死亡率。其次,由 於臺灣於 1985 年和 1995 年分別實施醫療 網計畫與開辦全民健康保險,我們將觀察 期間分成三段:1976-1984,1985-1994, 及 1995-2000,並且以 1976-1984 為參考 組,建立兩個時間虛擬變項。最後,我們 利用複迴歸分析,觀察剝奪程度與時間虛 擬變項之間的交互作用,以分析醫療網計 畫與全民健康保險開辦對醫療可避免死亡 率地理差異的影響。 五、 結果 死亡現象的變化 表二說明 1976 年以來臺灣死亡現象 的變化。就全死因而言,5-64 歲年齡標準 化死亡率由 1976 年的 3.3‰下降至 2000 年的 2.8‰,平均年下降率為-0.6%。就醫 療可避免死因而言,5-64 歲年齡標準化死 亡率下降速度更快,由 1976 年的 1.0‰降 至 2000 年的 0.4‰, 平 均年 下降 率 為 -3.6%。值得注意的是,全民健保開辦後, 全死因與醫療可避免死因的死亡率都有加 速下降的現象。 死亡現象的地區社經差異 表三說明高剝奪地區與低剝奪地區兩 組平均年齡標準化死亡率比的變化趨勢。 就縣市層級而言,標準化全死因死亡率的 社經差異,由 1976 年的 1.30 倍逐年上升 為 1995 年的 1.74 倍,再略降為 2000 年的 1.60 倍,但標準化醫療可避免死因死亡率 的社經差異,則由 1976 年的 1.33 倍逐年 上升為 1995 年的 1.65 倍,然後在 1.70 倍 上下擺蕩。 就鄉鎮市區層級而言,標準化全死因 死亡率的地理差異,由 1976 年的 1.35 倍 一路攀升至 1995 年的 1.86 倍,然後維持 在 1.90 倍上下,但醫療可避免死因而言, 標準化可避免死因死亡率的地理差異,則 由 1976 年的 1.42 倍增加為 1995 年的 1.81 倍,然後在在 2.00 倍上下徘徊。 值得注意的是,隨著分析層級的改 變,標準化死亡率地理差異的趨勢明顯不 同。就縣市層級而言,無論全死因或醫療 可避免死因,標準死亡率的地理差異增加 速度逐年趨緩,但是就鄉鎮市區層級而 言,標準死亡率之地理差異在 1985 年醫療 網計畫實施後卻不斷加速擴大,直至 1995 年全民健保開辦後才趨緩下來。 迴歸分析 我們進一步利用複迴歸分析檢定縣 市層級與鄉鎮市區層標準化死亡率的地理
差異變化,結果如表四。就縣市層級而言, 全死因迴歸之剝奪程度與時間虛擬變項交 互作用達統計顯著水準 (P<0.001),顯示 標準化全死因死亡率的地理差異仍不斷擴 大,但醫療可避免死因迴歸之剝奪程度與 時間虛擬變項的交互作用則未達統計顯著 水準 (P>0.05),顯示標準化醫療可避免死 亡率的地理差異至少沒有惡化的跡象。 就鄉鎮市區層級而言,全死因迴歸與 醫療可避免因迴歸之剝奪程度與時間虛擬 變項交互作用都達統計顯著水準 (至少達 P<0.05),無論標準化全死因死亡率或標準 化醫療可避免死亡率的地理差異,特別是 全民健保實施後仍不斷擴大。惟醫療可避 免死因的剝奪程度與時間虛擬變項交互作 用,不似全死因顯著,顯示相對而言,醫 療可避免死亡率的地理差異惡化現象已減 弱。 六、 結論 本研究結果顯示:無論縣市層級或鄉 鎮市區層級,全死因與醫療可避免死因死 亡率與地區剝奪程度息息相關,且全民健 保開辦後,雖然醫療可避免死因率地理差 異不再惡化,但全死因死亡率的地理差距 仍繼續擴大。 七、 結果自評 全民健保後開辦以後,我們曾分析全 民健保對保障醫療人權的貢獻 [8],現在 則進一步發現全民健保有助於縮小死亡現 象的地理差異,這是曾經參與全民健保規 劃的人所樂於見到的結論。但是,我們也 同時發現地區剝奪對國民健康更重要,未 來將深入探討相關死亡率地理差異惡化的 機轉及解決方案。 八、 參考文獻 1. 行政院衛生署:中華民國八十九年衛 生統計,一、公務統計。台北:行政 院衛生署,2001。 2. 行政院衛生署:台灣地區縣市別死亡 概況 (http://www.doh.gov.tw/lane/ statist/89/CITY89-.xls accessed 02/15/2002)。
3. World Health Organization. Health for all in the 21st century. Geneva: World Health Organization, 1988 (document WHA 51/5).
4. Leon DA, Walt G, Gilson L. International perspectives on health inequalities and policy. BMJ
2001;322:591-4.
5. Rutstein DD, Berenberg W, Chalmers TC, et al. Measuring the quality of medical care – a clinical method. N Eng J Med 1976;294:582-8.
6. Charlton JRH, Hartley RM, Silver R, et al. Geographical variation in mortality from conditions amenable to medical intervention in England and Wales. Lancet 1983;I:691-6.
7. Holland WW and EC Working Group on Health Services and ‘Avoidable Deaths’. European community atlas of ‘avoidable death’ (2nd Ed). Oxford: Oxford University Press, 1991.
8. Chiang TL. Taiwan’s 1995 health care reform. Health Policy 1997;
Table 1. Medically avoidable causes of death in the analysis
ICD-8 ICD-9 1976-1980 1981-2000
Infectious and parasitic diseases 000-136 001-139
Cervical cancer 180 180
Hodgkin's disease 201 201
Chronic rheumatic heart disease 393-398 393-398 Hypertensive disease 400-404 401-405 Cerebrovascular disease 430-438 430-438 All diseases of respiratory system 460-519 460-519
Appendicitis 540-543 540-543
Abdominal hernia 550-553 550-553
Cholelithiasis and Cholecystitis 574-575 574-575.1
Table 2. Trend in age-adjusted premature mortality rates (1/100,000) in Taiwan, 1976-2000
Year All-cause mortality Avoidable mortality 1976 326 96 1977 333 95 1978 329 91 1979 325 86 1980 326 85 1981 326 81 1982 320 78 1983 318 77 1984 312 73 1985 306 70 1986 305 67 1987 304 62 1988 311 63 1989 310 62 1990 306 61 1991 300 57 1992 299 56 1993 299 52 1994 298 49 1995 300 50 1996 300 48 1997 290 45 1998 288 46 1999 290 40 2000 281 40
Average annual increase rate (%)
1976-1985 -0.70 -3.52
1985-1995 -0.20 -3.23
Table 3: Trends in ratio of mean age-adjusted premature mortality rates between high- and low-deprivation regions/townships in Taiwan, 1976-2000
All-cause mortality Medically avoidable mortality Region Township Region Township 1976 1.30 1.35 1.33 1.42 1977 1.31 1.33 1.32 1.29 1978 1.35 1.35 1.33 1.36 1979 1.39 1.43 1.37 1.36 1980 1.42 1.48 1.39 1.37 1981 1.43 1.49 1.43 1.43 1982 1.48 1.54 1.51 1.63 1983 1.52 1.51 1.53 1.54 1984 1.52 1.54 1.54 1.45 1985 1.55 1.54 1.49 1.44 1986 1.59 1.60 1.62 1.65 1987 1.55 1.63 1.60 1.55 1988 1.51 1.67 1.47 1.60 1989 1.59 1.69 1.47 1.80 1990 1.66 1.77 1.56 1.62 1991 1.67 1.75 1.66 1.77 1992 1.68 1.83 1.72 1.85 1993 1.68 1.82 1.72 2.01 1994 1.74 1.89 1.67 2.05 1995 1.74 1.86 1.65 1.81 1996 1.72 1.97 1.75 2.13 1997 1.72 1.92 1.90 2.45 1998 1.68 1.90 1.62 1.97 1999 1.69 1.97 1.80 2.22 2000 1.60 1.89 1.57 2.00
Average annual increase rate (%)
1976-1985 1.90 1.46 1.28 0.20
1985-1995 1.22 1.90 1.06 2.31 1995-2000 -1.70 0.30 -1.05 1.99
Table 4: Region-level and township-level multiple regression models of all-cause mortality and medically avoidable mortality in Taiwan, 1976-2000 (numbers in parentheses are standard error)
All-cause mortality Avoidable mortality
Region Township Region Township Area deprivation (reference: low)
Moderate 53.99*** 29.13*** 12.34*** 3.16 (4.21) (6.87) (3.02) (2.26) High 100.02*** 145.37*** 25.03*** 36.67*** (4.21) (6.87) (3.02) (2.26) Period (reference: 1976-1985) 1985-1995 -34.40*** -24.72*** -25.02*** -26.38*** (4.10) (6.72) (2.94) (2.21) 1995-2000 -47.84*** -43.01*** -37.86*** -41.83*** (4.70) (7.71) (3.38) (2.25)
Interaction (reference: 1976-1985*low)
1985-1995*moderate 24.65*** 35.62*** 1.51 7.13* (5.80) (9.47) (4.16) (3.11) 1985-1995*high 46.57*** 72.04*** 2.09 6.72* (5.80) (9.47) (4.16) (3.11) 1995-2000*moderate 26.51*** 58.07*** -2.29 8.22* (6.65) (10.86) (4.78) (3.57) 1995-2000*high 55.10*** 115.13*** -2.22 12.56*** (6.65) (10.86) (4.78) (3.57) Constant 283.22*** 327.03*** 74.98*** 87.21*** (2.95) (4.88) (2.04) (1.60) Adjusted R2 97.49 23.20 89.40 16.38 F value 360.46 336.13 79.05 218.30 P value <0.001 <0.001 <0.001 <0.001 * P<0.05; ** P<0.01; *** P<0.001.