JOURNAL OF
CHROMATOGRAPHY A ELSEVIER Journal of Chromatography A, 731 (19%) 217-224
Quantification
of toxic hydrocarbon target compounds in
engine exhaust and air by aluminum oxide porous-layer open-
tubular capillary gas chromatography-mass
spectrometry using
isotopically labeled internal standards
Cheng-Chiech Huanga, Yunn-Chyi Chen”, Guor-Rong Hera’*, Chang-Chuan Chanb
“Department of Chemistry, National Taiwan University, Taipei, Taiwan
hlnstitute of Occupational Medicine and Industrial Hygiene, College of Public Health, National Taiwan University, Taipei, Taiwan
First received 20 July 1995; revised manuscript received 17 October 1995; accepted 20 October 1995
Abstract
A method for the determination of 13-butadiene, benzene and toluene in ambient air and engine exhaust is
described. Air was sampled with a canister and then analysed by A&O,-coated porous-layer open-tubular (PLOT)
capillary gas chromatography-mass spectrometry. The PLOT column provides better resolution for light hydro-
carbons and also alleviates the need of using a sub-ambient oven temperature. While the retention times might change owing to the adsorption of moisture, the use of mass spectrometry for detection and isotopically labeled
analytes as the internal standards greatly improved the confidence of identification. The heating of solid deuterated
butadiene sulfone provides a convenient method for the preparation of deuterated butadiene standard gas. To
couple a wide-bore PLOT column with a bench-top mass spectrometer, a pressure gradient and open split interface
were used in order to maintain the chromatographic resolution and limit the running time within a reasonable range.
Keywords: Environmental analysis; Air analysis; Sample handling; 1,3-Butadiene; Benzene; Toluene; Hydro- carbons; Volatile organic compounds
1. Introduction
Many air contaminants are of great environ- mental concern because of their implications for human health [1,2]. In urban area, automobile exhaust has been identified as one of the most important sources of toxic hydrocarbons [3,4].
* Corresponding author.
An analytical method of high sensitivity and high
accuracy is needed not only for assessing health risks but also for developing control technology and setting standards for automobile emissions. Conventional gas-liquid capillary columns such as the DB-1 column are often used in the analysis of volatile organic compounds. Recently, the aluminum bxide-coated fused-silica porous- layer open-tubular (PLOT) capillary column has 0021-9673/96/$015.00 0 19% Elsevier Science B.V. All rights reserved
218 C.-C. Huang et al. I J. Chromatogr. A 731 (1996) 217-224
gained popularity in the analysis of hydrocarbons (HCs) [5-lo]. The resolving power of the PLOT column is superior to that of conventional col- umns for light hydrocarbons [ll-131. Moreover, because the separation process with a PLOT column is based on adsorption chromatography, the elution temperatures are much higher than with conventional columns, thus eliminating the need to use an initial sub-ambient oven tempera- ture [14].
Although the PLOT column has the advan- tages of a better resolving power for light hydro- carbons and avoidance of using an initial sub- ambient oven temperature, the retention time may change owing to the adsorption of polar molecules such as water and methanol on the active aluminum oxide layer. In the analysis of field samples, the continuous change in retention times owing to the progressive adsorption of water increases the uncertainty in the identifica- tion of target compounds [9,15]. To circumvent this problem, the PLOT column was coupled with a bench top gas chromatography-mass spectrometry (GC-MS) system and isotopically labeled internal standards were used. We report in this paper the application of this approach to the analysis of toxic hydrocarbons.
2. Experimental
2.1. Chemicals and standards
C-C, hydrocarbon standard gases were pur- chased form Scott Specialty Gases (Durham, NC, USA). Benzene, toluene, ethylbenzene, p-xylene and o-xylene were obtained from Sigma (St. Louis, MO, USA). Gas standards were prepared by injection of gases from Scatty cans (or liquid for BTEX) into a 2-l dilution bottle. These standards were diluted subsequently to the de- sired concentrations with zero air.
2.2. Isotopically labeled internal standards
Isotopically labeled internal standards, [‘HJbenzene and [‘HJtoluene, were purchased from Sigma and had a minimum isotopic purity
of 99.0% of deuterium. [1,1,4,4-‘H,]Butadiene was prepared from [2,2,5,5-*H,]butadiene sul- fone [16] obtained from Aldrich (Milwaukee, WI, USA). The deuterium compound was weighed into a static dilution bottle (SDB), evacuated to 1.3 kPa by a vacuum pump and then heated at 120°C for 15 h. After the reaction, the bottle was filled with zero air to 101.3 kPa. The yield of the reaction was quantified by GC-flame ionization detection (FID) with pure 1,3-butadiene stan- dard.
2.3. Sampling
Summa electropolished stainless-steel canisters (6 1) were purchased from Andersen Samplers (Atlanta, GA, USA). Before use, the canisters were heated to 90°C and then cleaned with repetitive evacuation and refilling with humidified zero air. The cleaned canisters were checked with GC-MS for the blank level before sampling. Through a filter (pore size 5 pm), air sample was drawn into the canister by vacuum. To obtain an average concentration in samples of volatile organic compounds (VOCs) from the roadways of Taipei city, it was found that with the sampler evacuated to 6.7 Pa, a calibrated metering valve could provide a relatively con- stant flow of 50 ml/min (within 20% ) within a 50-min sampling period.
The sampling of tail-pipe exhausts was con- ducted by standard emission testing procedures in a dynamometer. European Community Emis- sion (ECE) and Federal Test Procedures (FTP) driving cycles were used for motorcycles and automobiles, respectively. The sampling points were all located at the three-way valve prior to the analyzers of the regulated criteria pollutants. The cleaned ,and evacuated canisters were at- tached to the three-way valve and 6 1 of tail-pipe exhaust were collected within 1 min.
After the sampling, zero air was discharged into the canister until the canister pressure reached 110.3 kPa. This step is necessary for providing a positive pressure for the injection of air samples into the modified Model 6000 Aero Trap Desorber (Tekmar, Cincinnati, OH, USA).
C.-C. Huang et al. I J. Chromatogr. A 731 (19%) 217-224 219
2.4. Sample introduction
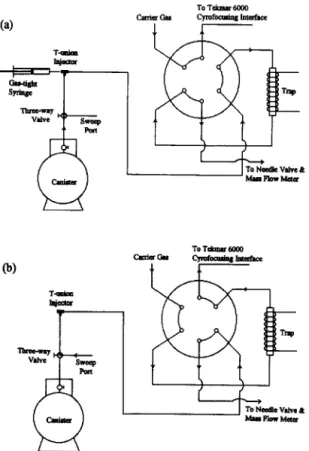
The Tekmar 6000 Therm0 Desorber, which was designed for the analysis of VOCs adsorbed in an adsorption tube, was modified for the introduction of whole air into the system as shown in Fig. 1. The canister was attached to a heated (ca. WC) 1.6 mm O.D. stainless-steel transfer line. The transfer line and helium purge gas were connected to a three-way valve on the desorber with a low-dead-volume T-union (Swagelok) injector. Deuterium-labeled internal standards were injected into the T-union injector by a gas-tight syringe when real sample was carried from the canister. The vent port of the desorber was connected to a needle valve and a mass flow meter (Aalborg Instruments & Con- trols, Monsey, NY, USA). The output of the flow meter was recorded with a microcomputer and
Fig. 1. Modified Tekmar 6000 Therm0 Desorber. (a) Sample introduction mode; (b) desorption mode.
then integrated to calculate the total injection volume. VOCs concentrated in the cryotrap were desorbed at 200°C for 6 min at a flow-rate of 10 ml/min. The desorbed sample was refocused on to the cryogenic interface of a capillary column, which was cooled with liquid nitrogen to -180°C and then rapidly desorbed to 200°C within 1 min.
In this modified cryotrap system, samples and internal standard were introduced into the instru- ment separately. The validity of this arrangement was checked by comparison with a method of premixing samples and internal standard before the analysis. By determining butadiene standard in Summa canisters, the results of these two different approaches were found to be very similar (7% with triplicate analysis).
2.5. GC-MS analysis
Separation and identification were performed on an MD 800 benchtop GC-MS system (Fisons, Rodano, Italy). The separation capillary column was a 50 m x 0.32 mm I.D. PLOT column coated with aluminum oxide and deactivated with potas- sium chloride (Chrompack, Middelburg, Nether- lands). The pressure applied to the separation column was controlled by a GC-17A GC system (Shimadzu, Tokyo, Japan) with the capability of pressure programming. The mass spectrometer was operated in the selected-ion monitoring (SIM) mode for optimum sensitivity.
3. Results and discussion
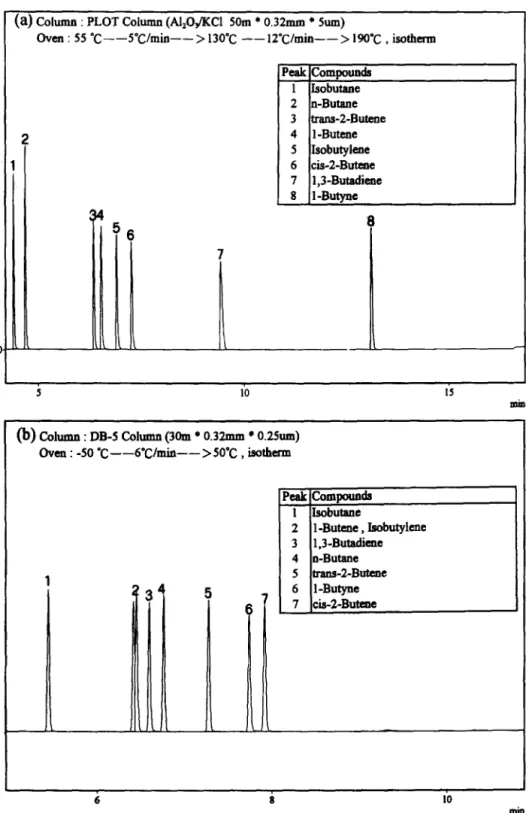
Because of regulatory interest and toxicity, benzene, toluene, and 1,3-butadiene are the most often studied toxic hydrocarbons. For the de- termination of 1,3-butadiene, as expected, an Al,O,-coated PLOT capillary column provided better resolution than the conventional columns. For example, the differences in retention times between 1,3-butadiene and other C, HCs in the PLOT column were much greater than in a DB-5 column, as shown in Fig. 2. This advantage is important because 1,3-butadiene is often a minor component in C, HCs and baseline resolution is needed for the measurement of peak area with
220 C.-C. Huang et al. i J. Chromatogr. A 731 (19%) 217-224
a) Column : PLOT COILUIM (Al,OfiCl 50m * 0.32mm * Sum)
Oven : 55 “C---S’C/min-- > 130°C --lzOC/min--> 190°C , isotherm I Wlc~Compounds 1 IIsobutane 2 n-Butane 3 trans-2-Bute-ne 4 I-Butene 5 Isobutylene 6 cis-2-Butene 7 1,3-Butadime 8 I-Butvne 8
IL--
(b) Column : DB-5 Cohmm (30m * 0.32mm l 0.25~11)oven : -50 “C --6’C/min-->5O*C, isotherm
Peak compounda 1 Isobutaae 2 1 Butene , Isobutylme 3 1,3-Butadiene 4 n-Butane 5 m-2-B-e 7 cia-2-Butene 6 II 1”
C.-C. Huang et al. / 1. Chromaiogr. A %Zl (19%) 217-224 221
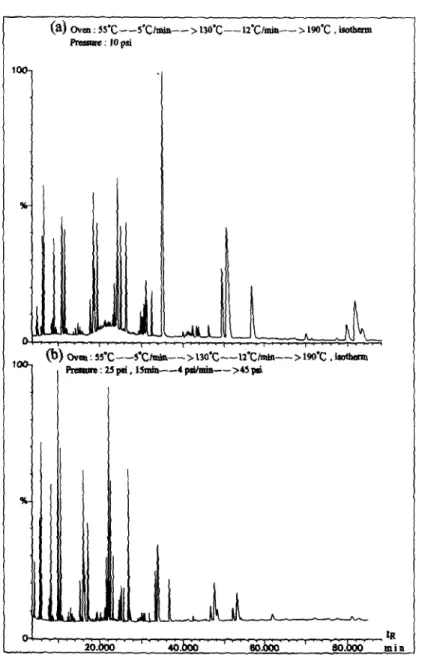
(aI tirn : ~s*c--s*c~+-> 130~c--1~yhb-- z 196~ , icocbam
Resaa: lOpsi
2o.&lo ' 4o.&Jo '-"--boo '
,, tR 80. RO.&O mio
Fig. 3. Mass chromatograms of a real sample with (a) constant pressure and (b) pressure gradient.
high accuracy. In addition, a sub-ambient initial oven temperature was required in the analysis of C, HCs with the DB-5 column (Fig. 2b). This cryogenic procedure results in significant extra costs and inconvenience.
Among various GC detection methods, MS can provide the highest confidence in compound identification, The retention time along with molecular ion and fragment ions provide un- ambiguous assignments for most organic com-
pounds. For many applications, the use of MS as a capillary GC detector proved to be the best, if not the only, technique to meet the requirement of high-confidence identification. The use of MS for detection with a PLOT column is even more significant because, as mentioned earlier, large variations in retention times occur owing to the progressive adsorption of water in the PLOT column, making identification difficult. Further, it has been reported that the selectivity of the
222 C.-C. Huang et al. I J. Chromatogr. A 731 (1996) 217-224 Toluene-d8 I Tolye 91
78.
1
58.
I
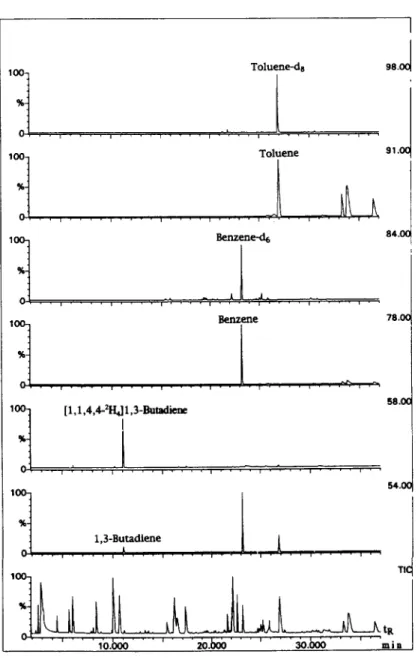
%- 1,3-Butadlene o-...,....,!...,....,....,. 1, . , 1 , ( loo- T I %-Fig. 4. Mass chromatograms of a tail-pipe exhaust sample.
PLOT column can vary so greatly that methods based on retention times may need to be modi- fied when using columns from different manufac- turers [ 171.
One major reason for the popularity of GC- MS is the introduction of low-cost bench-top GC-MS systems by most MS manufactures. In general, a narrow-bore capillary column is rec- ommended because bench-top GC-MS systems are often equipped with pumps of low pumping
speed. It was unfortunate to find, however, that a narrow-bore (~0.25 mm I.D.) PLOT column was not commercially available. With the use of a wide-bore column, lower than the optimum flow- rate can be an option to meet the pumping speed of bench-top GC-MS. However, with the limita- tion of the maximum operating temperature (ZOO’C) of the PLOT column, the use of a low column pressure could result in unreasonably long retention times for large HCs. As an exam-
Table 1
C.-C. Huang et al. I J. Chromatogr. A 731 (1996) 217-224 223
Concentration and emission rate of toxic hydrocarbons in air and tail-pipe exhaust
Sample 1,3-Butadiene Benzene Toluene
Emissions” Motorcycle (ECE) Passenger car (FTP) Phase 1 Phase 2 Phase 3 Total emission Ambient airh 8.30 (3.6) 170.95 (1.5)’ 541.88 (1.6)’ 1.30 152.41 322.83 0.62 30.59 34.15 0.14 54.09 91.70 0.63 62.30 109.79 16.18 (7.34) 151.14 (47.47)’ 637.82 (169.85)’ a pgikm. h pg/m’.
’ Values in parentheses are R.S.D.s (% ) for replicate analyses.
ple, with a head pressure of 68.9 kPa and using the temperature program shown in Fig. 3a, the elution times of o-xylene and trimethylbenzene were 57 and 80 min, respectively. To reduce the retention times, an open split interface (0%) [18] consisting of a 1.6 mm T-union and a 50 cm X 100 pm I.D. deactivated non-coated fused- silica column was used for the coupling of GC with MS. The flow into the MS source was limited by the inner diameter and length of the interface column rather than the column head pressure. With this arrangement, while the re- tention times can be reduced significantly with the use of a higher head pressure, the resolution may not be as good as in low-pressure operation. To maintain the resolution for C, HCs and also reduce the running time, it was found that this goal could be achieved with the use of pressure programming along with an OSI. The flow-rate was kept low at the beginning for the resolution of the C, HCs and then raised sharply to reduce the total running time. With a pressure program as shown in Fig. 3b, the elution times of o-xylene and trimethylbenzene were reduced to 37 and 47 min, respectively. Another merit of this arrangement is that because of the use of low pressure during the elution of light HCs, the splitting ratio for C, HCs is significantly lower than with high-pressure operation. This is espe- cially beneficial for the determination of trace levels of HCs such as 1,3-butadiene.
Because the Fisons GC-MS system used in this study does not have the function of pressure programming, the outlet of a Shimadzu GC-17A gas chromatograph with the capability of pres- sure-gradient operation was rewired to the therm0 desorber. The pressure to the column was controlled by the Shimadzu GC-17A GC instead of the Fisons GC-MS system.
In order to increase the confidence in identifi- cation and also in quantification, isotopically labeled internal standards were used for the determination of the major toxic HCs. 1,3- Butadiene was determined using [1,1,4,4-*H,]- 13-butadiene, benzene using [‘H&benzene, and toluene using [2H,]toluene. A typical mass chro- matogram of a tail-pipe exhaust sample is shown in Fig. 4. Because isotopic standards have very similar, if not identical, retention times as the analytes, the confidence of identification is higher than with the use of homologs or other com- pounds as the internal standards. This advantage is more significant considering the relatively poorer reproducibility of retention times with the PLOT column. Moreover, because the analyte and its isotopic analog enter the MS source about the same time, the variation due to the change in instrumental conditions can be eliminated with the use of the relative response factor in quantifi- cation.
Deuterium-labeled benzene and toluene were obtained commercially. Deuterium-labeled 1,3-
224 C.-C. Huang et al. I J. Chromatogr. A 731 (1996) 217-224 butadiene was prepared from solid [2,2,5,5-
‘H,]butadiene sulfone. By heating the [2,2,5,5- *H,]butadiene sulfone at 120°C for 15 h in a static dilution bottle, [1,14,4-‘H,]butadiene could be obtained with an average yield of 95% (stan- dard deviation 5.34%). This approach provides a convenient method for preparing [1,1,4,4-*H,]- butadiene because a solid sample is much easier to handle and can be weighed very accurately. In addition, it is also much cheaper than a gas standard. The deuterium-labeled 1,3-butadiene was determined by GC-FID with pure 1,3- butadiene standard. The validity of the quantifi- cation of deuterated butadiene with a non-deu- terated butadiene standard was checked with benzene-[‘H,]benzene and toluene-[2H,] toluene standards. Known concentrations of deu- terated benzene and toluene standards were quantified from the calibration graphs for ben- zene and toluene, respectively; the results showed that the measured concentrations were within 5% of the prepared concentrations.
Air collected from roadways and from tail- pipe exhausts were analyzed with this approach. Some preliminary results are shown in Table 1. The concentrations of 1,3-butadiene in these samples were much lower than those of benzene and toluene. As expected, the emission rate of phase 1 was higher than those of phase 2 and phase 3 owing to the poorer catalytic efficiency. It is known that temperature greatly affects the efficiency of catalytic converters and the tem- perature in phase 1 of the driving cycle is not high enough for optimum performance of the converter. Data for a 50 cc two-stroke motor- cycle tested with the ECE mode showed that, despite the small engine size, the emission rate of toxic compounds was higher than in passenger car emissions. Different mode of operation, poorer combustion in the engine and the non-
catalyst tail-pipe were possible causes of the difference. References
PI
121 131 [41PI
Fl 171 P-31 [91 [N [Ill WI P31E.J. Calabrese and E.M. Kenyon (Editors), Air Toxic and Risk Assessment, Lewis, New York, 1991. J.M. Peters, F. Lurmann and W. Navidi (Editors), Epidemiologic Investigation to Identify Chronic Health Effects of Ambient Air Pollutants in Southern Califor- nia, California Air Resources Board Contract A033-186, Phase I Final Report, Part 1, 1992, p. 1.
C.C. Chan, S.H. Lin and G.R. Her, J. Air Waste Manage. Assoc., 43 (1993) 1231.
C.C. Chan, S.H. Lin, C.Y. Tsai and G.R. Her, J. Air Waste Manage. Assoc., 45 (1995) 116.
N. Schmidbauer and M. Oehme, J. High Resolut. Chro- matogr. Chromatogr. Commun., 8 (1985) 404. N. Schmidbauer and M. Oehme, J. High Resolut. Chro- mbtogr. Chromatogr. Commun., 9 (1986) 502. N. Pelz, N.M. Dempster and P.R. Shore, J. Chromatogr. Sci., 28 (1990) 230.
A. Peters and R. Sacks, J. Chromatogr. Sci., 29 (1991) 403.
J. de Zeeuw, R.C.M. de Nijs and L.T. Henrich, J. Chromatogr. Sci., 25 (1987) 71.
R.A. Lunsford and Y.T. Gagnon, J. High Resolut. Chromatogr. Chromatogr. Commun., 10 (1987) 102. C.T. Farmer, P.J. Milne, D.D. Riemer and R.G. Zika, Environ. Sci. Technol., 28 (1994) 238.
C.A. Jemma, P.R. Shore, and K.A. Widdicombe, J. Chromatogr. Sci., 33 (1995) 34.
P.G. Simmonds, S. O’Doherty, G. Nickless, G.A. Stur- rock, R. Swaby, P. Knight, J. Ricketts, G. Woffendin and R. Smith, Anal. Chem., 67 (1995) 717.
(141 K.L. Olson, R.M. Sinkevitch and T.M. Sloane, J. Chro- matogr. Sci., 30 (1992) 500.
[15] R.C.M. de Nijs, J. High Resolut. Chromatogr. Chroma- togr. Commun., 4 (1981) 612.
[16] W.L. Mock (Editor), Pericyclic Reactions, Vol. 2, Aca- demic Press, New York, 1977, Ch. 3, p. 92.
[17] H. Heijmans, J. de Zeeuw, J. Buyten, J. Peene and M. Mohnke, Am. Lab., 8 (1994) 28C.
[18] D. Henneberg, U. Henrichs, H. Husmann and G. Schomburg, J. Chromatogr., 167 (1978) 139.