智慧型手機使用模式之探勘 - 政大學術集成
76
0
0
全文
(2) 智慧型手機使用模式之探勘 Mining Application Usage Patterns of Smartphone Users 研 究 生:曾菀柔. Student:Woan-Rou Tseng. 指導教授:徐國偉. 治 國立政治大學 政 大 資訊科學系 碩士論文. 學 ‧. ‧ 國. 立. Advisor:Kuo-Wei Hsu. n. er. io. sit. y. Nat. A Thesis submitted to Department of Computer Science National Chengchi University a iv in partiall fulfillment of the Requirements n Ch n gdegree c h i Uof fore the Master in Computer Science. 中華民國一百零二年七月 July 2013.
(3) Abstract. The development of smartphone technology has changed the way people work and live in many aspects in just a few years. The advanced operating systems on smartphones allow developers to create applications that enhance the functions of the smartphones, and the applications help users personalize their. 政 治 大 emerge and bring. smartphones to enrich their work and lives. Various types of applications. 立. designed for smartphones. people convenience and. ‧ 國. 學. entertainment. Therefore, it is practically interesting and important to study what applications people use on their smartphones and how people use these. ‧. applications. Many studies are conducted in order to provide a better user. sit. y. Nat. experience to smartphone users. However, most of these studies are based on. er. io. questionnaire surveys or designed experiments that are performed in a. n. laboratory setting and would a be limited to reflect vthe actual application usage. i l C n U h e nTog covercome done by users in their daily lives. the limitation, we apply data hi. mining techniques to a data set, which contains smartphone logs collected from several users over a long period of time, and intend to discover meaningful patterns that represent user behaviors. First of all, we apply the classic association rule mining algorithm and the traditional sequential pattern mining algorithm to the data set, and we discuss their weaknesses for mining application usage patterns of smartphone users. Then, we propose a data processing process that transforms the logs into sessions rather than transactions or sequences. We define a session as a user’s one-time usage period. Each session contains the i.
(4) user behavior during the period, including the applications used. Next, we propose an extension of a sequential pattern mining that allows. us to take time. constraints into account. Stronger rules can be generated by restricting shorter intervals between applications used, and they give us much deeper knowledge of user behaviors. In summary, this thesis contributes to user behavior analysis for smartphone applications from the following three aspects: First, it provides a data processing process that is essential for the analysis. Second, it provides an. 政 治 大. algorithm extended from a widely used sequential pattern mining algorithm and. 立. designed to discover rules from logs recording activities of smartphone users.. ‧ 國. 學. Third, it provides an analysis on the discovered rules. This thesis contributes to a better understanding of smartphone users’ behaviors and a detailed analysis to. ‧. the results. It uses a real data set to discover rules that could be beneficial to the. y. Nat. n. al. er. io. sit. designers of smartphone applications and user interfaces.. Ch. engchi. ii. i Un. v.
(5) 摘要. 近幾年內,行動裝置科技、尤其是智慧型手機的蓬勃發展,在許多方 面都影響了人們工作和生活的方式。具備不同功能的應用程式,能夠增強 智慧型手機的功能,並且更加符合使用者的個人需求,為人們帶來許多便 利和娛樂。因此,了解使用者使用何種應用程式、以及使用者如何使用這. 政 治 大 些應用程式,是相當重要的議題。 立. ‧ 國. 學. 研究者們已經提出了許多相關的研究,以期提供更好的使用者經驗給. ‧. 智慧型手機使用者。然而,這類研究大多是根據問卷調查、或者在實驗室. sit. y. Nat. 環境下所進行的實驗,只能有限的反映真實世界中的使用者行為。在本論. er. io. 文中,為了克服這些限制,實作了資料探勘的技術,應用在一長時間收集. al. n. iv n C 而來的真實資料上,以發掘使用者行為中的顯著規律。 hengchi U. 首先,本論文應用了傳統的關聯式規則探勘、以及序列式規則探勘的 演算法,並且針對他們的不足進行討論。接著,本論文定義一段 session 為 使用者單次的使用區段,包含使用者在這段期間內的行為記錄,並且提出 一個資料前處理的流程以轉換原始資料成 session。最後,本論文提出一個 序列式規則探勘演算法的延伸,藉由限制 session 內應用程式使用的時間間 隔,來產生代表更強烈關聯性的規則,並且蘊含更豐富的智慧型手機使用. iii.
(6) 者行為資訊。 本論文對於智慧型手機應用程式的使用者行為分析,做出以下三個貢 獻:第一,本論文提供一套資料前處理的流程,可用於此類型的分析研究; 第二,本論文提出一個從序列式規則探勘演算法所延伸而出的演算法,特 別適用於智慧型手機使用者行為記錄資料的規則探勘;第三,本論文提供 了規則的相關分析。. 立. 政 治 大. 本論文使用真實世界的資料集來探勘,發掘出的規則可以反映和解釋. ‧ 國. 學. 智慧型手機使用者的行為,並且,透過詳細的分析,這些結果有助於智慧. Nat. n. al. er. io. sit. y. ‧. 型手機中,相關應用程式以及使用者介面的設計。. Ch. engchi. iv. i Un. v.
(7) 誌謝 研究所兩年的時光說長不長, 說短也不短,如今,我已正式的要離開政大資科這 個讓我成長的溫馨大家庭。 感謝資科系的老師們教導我許多寶貴的知識和研究的技能,讓我順利完成研究所 的學業和論文。感謝陳良弼老師培養我良好的研究態度,養成我獨立思考的好習慣;並 獲得許多口說報告的經驗和技巧。感謝我的指導教授徐國偉老師的悉心指導,一直以來 都給予我很大的彈性和空間。在研究的路上,有很多直接且良好的溝通機會,不厭其煩. 政 治 大. 的討論,解惑,一步一步地引導我的學習完成我的碩士論文研究。. 立. 感謝 DMA 和 IUI 實驗室所有的同學們,彼此都能互助合作,也能談天說笑,大家. ‧ 國. 學. 有零食共享,要打掃也一起出力,處在這充滿溫暖的環境,即使是面對枯燥無趣的工作. ‧. 時也能因此而添加不少樂趣。. 感謝我的男朋友一直以來的陪伴和鼓勵,雖然這兩年大部分的時間我們是分處在. y. Nat. er. io. sit. 世界的兩端各自努力,但也因此有機會一起體驗了這個世界上許多美好的事物。 最後,感謝我的父母與家人這些年來的支持,不管遇到什麼困難都能有個避風港. n. al. 讓我休息、沉澱之後再出發。. Ch. engchi. i Un. v. 本研究的部分成果是經由國科會計畫 NSC 101-2221-E-004-011 的補助而完成, 在此特別感謝國科會的支持,讓本研究得以如期完成。 曾菀柔 民國 102 年 7 月 5 日. v.
(8) Table of Contents CHAPTER 1 INTRODUCTION ................................................................................................ 1 1.1 Motivation .................................................................................................................... 1 1.2 The Research Object ..................................................................................................... 2 1.3 Contributions of the Thesis........................................................................................... 3 1.4 Organization of the Thesis ............................................................................................ 4 CHAPTER 2 BACKGROUND .................................................................................................. 5. 政 治 大. 2.1 Traditional Research Methods ...................................................................................... 5. 立. 2.2 Researches on Mobile Phone ........................................................................................ 6. ‧ 國. 學. 2.2.1 Reality mining ................................................................................................... 6. ‧. 2.2.2 Trajectory ........................................................................................................... 7 2.3 Analysis of Smartphone User Behavior ....................................................................... 8. y. Nat. er. io. sit. 2.4 Data Mining Methods ................................................................................................. 10 2.4.1 Association Rule Mining Problem ................................................................... 11. n. al. Ch. i Un. v. 2.4.2 Apriori-based Approach ................................................................................... 12. engchi. 2.4.3 Sequential Pattern Mining Problem ................................................................. 12 2.4.4 PrefixSpan by Pattern-Growth Approach ........................................................ 14 CHAPTER 3 DATA.................................................................................................................. 18 3.1 Raw Data Description................................................................................................. 18 3.2 Data Processing .......................................................................................................... 19 3.3 Summary Statistics of Data ........................................................................................ 21 CHAPTER 4 EXPERIMENT................................................................................................... 29 4.1 Association Rule Mining Method ............................................................................... 30. vi.
(9) 4.1.1 Data Processor ................................................................................................. 30 4.1.2 Association Rule Mining ................................................................................. 31 4.1.3 Results ............................................................................................................. 32 4.2 Sequential Pattern Mining Method ............................................................................. 34 4.2.1 Data Preprocessoring ....................................................................................... 35 4.2.2 Sequential Pattern Mining ............................................................................... 37 4.3 PrefixSpan Algorithm with Time Constraint .............................................................. 39. 政 治 大. 4.4 More Experiments ...................................................................................................... 41. 立. CHAPTER 5 RESULT ANALYSIS ......................................................................................... 43. ‧ 國. 學. 5.1 Analysis of Rule Sets - PrefixSpan ............................................................................. 43 5.2 Analysis of Rule Sets - PrefixSpan with Time Constraint .......................................... 46. ‧. CHAPTER 6 CONCLUSIONS AND FUTURE WORK ......................................................... 50. y. Nat. sit. REFERENCES ......................................................................................................................... 52. n. al. er. io. Appendix I. Rules generated from PrefixSpan. Min-Sup=0.01. .............................................. 56. i Un. v. Appendix II. Rules generated from PrefixSpan with time constraints. Min-Sup=0.005. ..... 60. Ch. engchi. vii.
(10) List of Figures Figure 1. The research flow chart. .............................................................................................. 3 Figure 2. An example of prefixes and suffixes. ........................................................................ 15 Figure 3. Pseudocode of the PrefixSpan algorithm [21]. ......................................................... 16 Figure 4. Data Processing flow chart........................................................................................ 19 Figure 5. Users and their corresponding number of sessions. .................................................. 22 Figure 6. Statistics of application categories. ........................................................................... 23. 政 治 大. Figure 7. Distribution of duration time..................................................................................... 25. 立. Figure 8. Distribution of the number of logs in a session. ....................................................... 25. ‧ 國. 學. Figure 9. Top 30 application names and their numbers of sessions. ........................................ 26. ‧. Figure 10. Distribution of the number of unique locations in a session. .................................. 27 Figure 11. Distribution of the number of top 30 applications used in a session....................... 27. y. Nat. er. io. sit. Figure 12. Distribution of the length of sequence. ................................................................... 28 Figure 13. Sequential pattern mining flow chart. ..................................................................... 29. n. al. Ch. engchi. viii. i Un. v.
(11) List of Tables Table I. Smartphone user behavior log data. ............................................................................ 19 Table II. A fragment of the raw data. ........................................................................................ 21 Table III. Session data. ............................................................................................................. 21 Table IV. Session data. .............................................................................................................. 30 Table V. Boolean-session data set. ............................................................................................ 31 Table VI. Rules generated by Apriori-based algorithm. ........................................................... 32. 政 治 大. Table VII. Rules generated by Apriori-based algorithm. .......................................................... 33. 立. Table VIII. A portion of the raw data. ....................................................................................... 35. ‧ 國. 學. Table IX. A sample of Sequence-session. ................................................................................. 35. ‧. Table X. A sample of our Sequence-session data. .................................................................... 37 Table XI. A sample of traditional sequence. ............................................................................. 37. y. Nat. er. io. sit. Table XII. A sample of the new Sequence-session with timestamp. ........................................ 40 Table XIII. Pattern set 1. ........................................................................................................... 40. n. al. Ch. i Un. v. Table XIV. Pattern set 2. ........................................................................................................... 41. engchi. Table XV. Rules generated by PrefixSpan algorithm. .............................................................. 43 Table XVI. A portion of rules that starts with Facebook. ......................................................... 45 Table XVII. A portion of rules that starts with Plurk................................................................ 46 Table XVIII. Sample rules with time constraint set to five seconds. ....................................... 47 Table XIX. Sample rules related to communication and social applications. .......................... 47 Table XX. Sample rules related to the Gmail application. ....................................................... 48 Table XXI. Sample rules related to the Google Maps application. .......................................... 49. ix.
(12) CHAPTER 1 INTRODUCTION. 1.1 Motivation. 政 治 大. During the past few years, there has been significant development in the technologies of. 立. mobile devices and communication infrastructure. Global smartphones and tablets shipments. ‧ 國. 學. have surpassed PC shipments in 20111, and the smartphone application industry is booming.. ‧. According to Gartner, Inc., worldwide mobile phone sales reached 419 million units in the second quarter of 2012, and smartphone sales accounted for 36.7 percent of total mobile. y. Nat. io. sit. phone sales; and compared to the sales in the second quarter of 2011, smartphone sales grew. n. al. er. 42.7 percent in the second quarter of 20122. In addition, International Data Corporation (IDC). Ch. i Un. v. reported that 153.9 million smartphones were sold worldwide in the second quarter of 20123.. engchi. Smartphone apps are applications that can run on a smartphone supported by a particular operating system. The leading smartphone operating systems include iOS and Android. Each has an associated online store where users can download apps of interest (with or without charges). The number of smartphone applications is rising, and the online stores for iOS and that for Android both reached 25 billion cumulative downloads in 20124. As of February 2013,. 1. http://www.mondaynote.com/2011/02/13/what-future-for-the-macintosh/ http://www.gartner.com/newsroom/id/2120015 3 http://www.idc.com/getdoc.jsp?containerId=prUS23624612 2. 4. http://www.statista.com/topics/1002/mobile-app-usage/chart/1109/google-play-looks-set-to-overtake-apple-s-app -store/ 1.
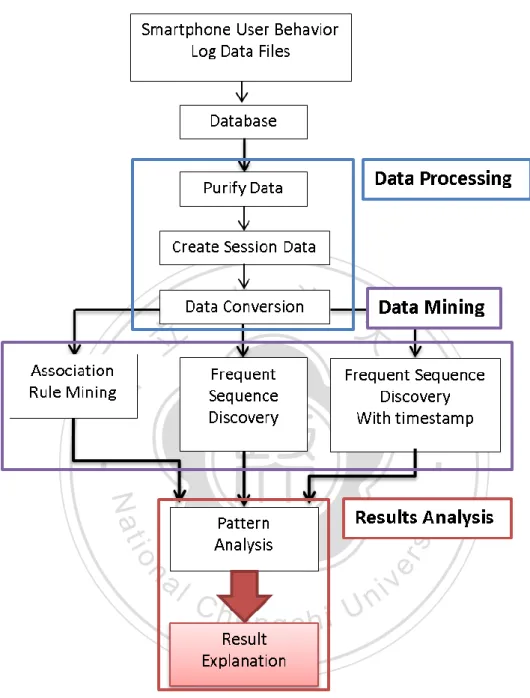
(13) they each have more than 800,000 applications available. The trend is evidence that smartphone technologies have changed many aspects of our daily lives.. 1.2 The Research Object Since the number of smartphone applications is rising, there are undoubtedly various research issues. The research issue addressed in this thesis is user behavior analysis. There are surely studies related to the research issue. However, related studies are mostly based on. 政 治 大. questionnaire surveys, or experiments that are conducted in strictly controlled environments.. 立. These studies suffer from the shortcoming that the data may not reflect the real behaviors of the. ‧ 國. 學. users. One of the reasons is that the questionnaires may be designed under assumptions too strong to be valid in real situations, and another reason is that the data may be collected only for. ‧. a short period of time. To overcome these drawbacks, we take a different approach and use data. y. Nat. sit. mining techniques to analyze a collection of logs recording activities of smartphone users over. n. al. er. io. a long period of time. Our goal is to discover the usage patterns of smartphone users that could. i Un. v. help create better user experiences or improve the design of the user interface.. Ch. engchi. The research flow chart is shown in Figure 1. We discuss why we cannot directly apply the classic association rule mining and traditional sequential pattern mining algorithms to the problem of extracting patterns from logs recording activities of smartphone users. As shown by the results, the approach using data mining techniques is able to discover the real behavior of the users without strong assumptions.. 2.
(14) 立. 政 治 大. ‧. ‧ 國. 學. n. er. io. sit. y. Nat. al. Ch. engchi. i Un. v. Figure 1. The research flow chart.. 1.3 Contributions of the Thesis This thesis contributes to user behavior analysis for smartphone applications from the following three aspects: First, it provides a data processing process that is essential for the analysis. Second, it provides an algorithm that is extended from a widely used sequential pattern mining algorithm and designed to discover rules from logs recording activities of 3.
(15) smartphone users. Third, it provides an analysis on the discovered rules. This thesis contributes to a better understanding of smartphone users’ behaviors and detailed analysis to the results. It uses a real data set to discover rules that could be beneficial to the designers of smartphone applications or user interfaces.. 1.4 Organization of the Thesis The rest of the thesis is organized as follows: Chapter 2 gives the background of the work. 政 治 大. presented in this thesis. It starts from the MIT reality mining project, which is one of the first. 立. research projects conducted to study user behavior analysis for mobile phones. Then it. ‧ 國. 學. discusses studies related to user behavior analysis for smartphones nowadays, and it also gives data mining preliminaries, including association rule mining and sequential pattern mining.. ‧. Chapter 3 gives a detailed description of the data we use, including the process for the. y. Nat. sit. collection of the raw data and the process for data processing, and it also presents summary. n. al. er. io. statistics of the data. Chapter 4 describes how we apply data mining techniques to the data, and. i Un. v. it reports the experimental results. Chapter 5 takes a closer look into the results and discusses. Ch. engchi. patterns observed from the results. Finally, Chapter 6 concludes this thesis and indicates the future work.. 4.
(16) CHAPTER 2 BACKGROUND. 2.1 Traditional Research Methods. 政 治 大. In the paper [1], the authors mentioned several traditional research methods, including. 立. questionnaire survey, interview, laboratory test, and road test, and gave a detailed description. ‧ 國. 學. for each method. In the following, we briefly introduce these methods.. ‧. Questionnaire survey is one of the most common methods. It could be with fixed answers or open answers; it could be in the form of paper questionnaire or online. y. Nat. er. io. sit. questionnaire. As the Internet and communication development, questionnaire survey provides a quick way to collect data from a large group of users. However, questionnaire. n. al. Ch. i Un. v. survey is based on pre-specified questions and the subjective answers would provide less flexibility in study deployment.. engchi. Interview is an interactive method in which interviewer ask questions directly to the respondent. Moreover, interviewers can guide the discussion according to their own interests. This method can be improved by technologies in many ways. For example, interviews can take respondents’ emotional characteristics into consideration. Interviews can use special machines to capture a respondent’s expression or physiological action as feedback. However, doing interviews is usually slow and costly. In addition, just like answers to questionnaires, answers to an interview are subjective because they are controlled by interviewers and. 5.
(17) affected by respondents’ conditions. Laboratory and road tests both refer to prepared tests. Laboratory test is taking place in a fixed context while road test is taking place in a more natural context. As the result, laboratory and road tests conduct in controlled environments.. 2.2 Researches on Mobile Phone 2.2.1 Reality mining. 政 治 大. The Reality Mining project is one of the pioneer projects in Computer Science dedicated. 立. to the study of mobile phone user behaviors. The goal of the project is to utilize the data. ‧ 國. 學. collected on mobile phones to answer questions about user behaviors for a wide range of applications.. ‧. The Reality Mining data set consists of data collected from one hundred Nokia 6600. y. Nat. sit. smartphones, pre-installed with several logging software packages and used by students or. n. al. er. io. faculty members in MIT. The information collected includes the call log, the application used,. i Un. v. the phone status, the in proximity, etc. Given the phone usage statistics, interesting. Ch. engchi. observations can be made. For example, we can learn the percentage of communication in all users, or the distribution of applications used in context. Furthermore, the data set can be used to perform user behavior modeling and prediction. An entropy-related metric is used to quantify the amount of predictable structure in a user’s life, and users can be categorized as living a low-entropy or high-entropy life by tracking their usage patterns. In addition, the information enables a customized log application that allows users to query their own lives and provides predictions about the upcoming behavior in the immediate future.. 6.
(18) 2.2.2 Trajectory The development of mobile technologies creates many interesting research areas, and one of those areas is the study of trajectory data streams. Studies in this area utilize the location data provided by GPS-equipped mobile devices provide. Users’ locations are transformed into trajectories. These trajectory data streams can be used to predict the route of a mobile phone user, or they can be used to discover groups of users who travel together. The applications include location-based recommendation systems, mobile commerce, and customized navigation systems.. 立. 政 治 大. In the paper [2], the authors focused on not only spatial but also temporal information in. ‧ 國. 學. the trajectory data. They used probabilistic suffix tree (PST) to contain both spatial and temporal information that together represent sequential patterns of movement, and they. ‧. proposed an algorithm to traverse the tree and generate prediction for locations. Their idea is. y. Nat. sit. discovering sequential patterns in the tree based on support values. Since temporal information. n. al. er. io. is included, the sequential patterns also indicate the points in time when users will be at the locations.. Ch. engchi. i Un. v. Some studies aim at discovering groups of users who travel together, and they combine trajectories in the groups or clusters to provide more accurate results. The authors of the paper [3] proposed an algorithm to discover user clusters, or communities in their term, by mining and comparing similarities between trajectories stored in PST. Once the clusters are discovered, the information can be used to improve route prediction in various ways. For example, a trajectory pattern mining framework called Clustering and Aggregating Clues of Trajectories (CACT) was proposed in the paper [4]. The approach utilizes clues such as patterns of movement discovered from previously observed trajectories or the trajectories of other users in the same cluster to infer a user’s route during the “silent duration” in which no data points are recorded 7.
(19) for that user. Other research focuses include the collection process of trajectories. L. Wei et al. in the paper [5] addressed the trajectory search issue by a pattern-aware trajectory search (PATS) framework. They used a measurement to evaluate the “attractiveness” of trajectories when conducting trajectory searches. The measurement, called potential regions, is based on popularity and sequential travel records from a given set of trajectories. With the evaluation of attractiveness, PATS returns top-K trajectories as results, the framework allows researchers to. 政 治 大. efficiently filter trajectories to collect information in which they are interested.. 立. ‧ 國. 學. 2.3 Analysis of Smartphone User Behavior. Given the rapid growth of the smartphone industry, there is an urgent need for studies in. ‧. this field. Among the studies that have been conducted to address related issues, user behavior. y. Nat. sit. analysis has always remained as an important topic. The abundant information that. n. al. er. io. accompanies smartphone usage data has made this area more valuable.. i Un. v. Some studies aim at categorizing the users into certain types. As an example,. Ch. engchi. Chittaranjan, Blom, and Gatica-Perez proposed a method to discover personality traits of a user [6]. Using data sources such as GPS, call logs, and Bluetooth, they used a machine learning method along with their Big-Five and gender-specific models to categorize users [6]. Their results would allow the design of mobile applications to better fit users’ individual needs [6]. Usage data can also be used in studies whose goal is to address the problem of malware detection. By analyzing process state transitions and user operational patterns, one can distinguish the operations performed by human users from the ones performed by devices infected by malwares [7]. Moreover, in the paper [8], a crowdsourcing system was used to collect the traces of applications’ behaviors, and the traces were used to identify applications 8.
(20) containing malware. With the computing power, mobility and downloadable applications, researches in smartphone user behavior attract not only computer sciences researchers, but also researchers in every field. Paper [9] for example, point out that smartphone has become Commonplace within the medical field as both a personal and professional tool. A digital survey examining smartphone and associated app usage was administered via email to all ACGME training programs. Data regarding respondent specialty, level of training, use of smartphones, use of. 政 治 大. smartphone apps, desired apps, and commonly used apps were collected and analyzed in this. 立. thesis.. ‧ 國. 學. In the paper [10], they collected data from Finnish smartphone users by a handset-based measurement platform developed for Nokia S60.And present some results by statistics. They. ‧. illustrate the time use of Finnish people, telling us where the users spend their time and under what. y. Nat. sit. and contexts. Moreover, they give the distribution of active usage time between applications. n. al. er. io. (including voice calls, messaging, browsing, multi-media or business and productivity) and hours. i Un. v. of day. The paper [11] also proposed a framework for mobile audience measurements which. Ch. engchi. collect data from mobile device directly rather than user surveys, providing a number of statistics and analytics. Some of the analytics are related to finding the most important application categories, and presenting the distribution of their usage on a weekly or monthly basis. In the paper. [12], It present results on apps usage at a national level using anonymized network measurements in the U.S and investigate how, where, and when smartphone apps are used from spatial, temporal, and user perspectives at large scale. Falaki et al., as another example, focused on relating intentional user activities to network traffic and power consumption [13]. They analyze relative time spent with each application during each hour of the day for a sample user’s top applications, it has been found 9.
(21) that the differences between user behaviors have a significant impact on the performance of mobile devices [13]. With the knowledge of how a user interacts with his or her smartphone, user experience can be improved and future energy drain can be predicted more accurately [13]. Another paper concerns about the similar topic to Falaki et al [14]. It discusses the relationship between usage pattern and Battery consumption. They collected real usage log data from real smartphone users over a two month period and show that all users have their own usage pattern. Then present a case study in order to show how to apply usage pattern information to power. 政 治 大. management, mobile device management and network management of smartphones.. 立. ‧ 國. 學. 2.4 Data Mining Methods. Data mining is a collection of techniques to discover meaningful knowledge hidden in. ‧. large databases. Chen, Han, and Yu defined it as “a process of extracting nontrivial, implicit,. y. Nat. sit. previously unknown and potentially useful information such as regularities or rules from. n. al. er. io. databases” [15]. There are various types of data mining techniques which are made based on. i Un. v. different tasks. For example, classifications is the task of generalizing known structure to. Ch. engchi. apply to new data; clustering is the task of discovering groups and structures in the data that are in some way or another "similar", without using known structures in the data; association rules is the task that finding frequent patterns, associations, correlations among sets of items or objects in transaction databases, relational databases, and other information repositories. Because our goal is to find the smartphone user’s behavior usage patterns (that means we want to extract relationships between applications in smartphone.), we start our research from the view of association rule mining problem.. 10.
(22) 2.4.1 Association Rule Mining Problem Among the broad applications of data mining, some are connected to an important problem called association rule mining problem, which was first introduced by Agrawal in the early 1990’s [16]. Given a transaction database in which each transaction consists of items purchased by a customer, the association rule mining problem is how to efficiently generate significant rules, each of which associate the purchase of some items with the purchase of others.. 政 治 大. Below are the notations used by Agrawal [16]: Let a set of items be denoted as I = {i1,. 立. i2, … , im} and a set of transactions be denoted as T = {t1, t2, … , tn}. Each transaction in T. ‧ 國. 學. contains a set of items. D is a database that consists of a set of transactions. An association rule is in the form of X ⇒ Y, where X and Y are sets of items (or itemsets) that satisfy X, Y ⊆ I. ‧. and X∩Y = ∅. X and Y are called antecedent and consequent of an association rule,. y. Nat. sit. respectively. Such a rule means that X implies Y.. n. al. er. io. To select interesting rules out of all possible rules, usually some constraints would be. i Un. v. applied to a rule to measure its significance. The most well-known constraints are minimum. Ch. engchi. support and minimum confidence [17]. For an association rule X ⇒ Y, support is defined as the percentage of transactions in D that contain an itemset X, and confidence is defined as the percentage of transactions in D’ that contain itemsets X and Y, where D’ is the set of transaction containing X. Their definitions are given as follows: ( ). (. ). (. ) ( ). A higher value of Support(X) indicates a higher percentage of the transactions in which. 11.
(23) customers purchase X, and a higher value of Confidence(X→Y) means that more transactions containing X also contain Y. We can specify the minimum support as a threshold to find association rules in which we are interested. The association rules are generated from itemsets whose supports exceed the threshold. Moreover, we can also specify the minimum confidence as a threshold to find association rules that can tell us what itemsets would be purchased together frequently.. 政 治 大. 2.4.2 Apriori-based Approach. 立. Apriori algorithm introduced by Agrawal and Srikant is an efficient algorithm prosed to. ‧ 國. 學. handle association rule mining problem [17]. It is efficient in its candidate generation process and its adoption of a new pruning technique. There are two phases of finding out all the frequent. ‧. itemsets from a database in Apriori algorithm. First, it generates the candidate itemsets and. y. Nat. sit. checks the support values of the corresponding itemsets. Only the itemsets whose support. n. al. er. io. values exceed the pre-specified minimum support will remain and be named as frequent. i Un. v. itemsets. Second, the candidate k-itemsets are generated by the frequent (k-1)-itemsets. The. Ch. engchi. most important property of frequent itemsets used by Apriori algorithm is that every sub (k-1)-itemsets of the frequent k-itemsets must be frequent.. 2.4.3 Sequential Pattern Mining Problem Although association rule mining is practical, it does not consider the points in time when items were purchased. For example, the rule A ⇒ B tells us that if a customer had purchased A then he or she would purchase B in the same transaction. However, it does not tell us whether the customer purchased A before B or whether the customer would purchase B simply because he or she had purchased A. This limitation makes it inappropriate to use 12.
(24) association rule mining algorithms in the situation where the points in time when items were purchased are important. We are interested in answering the following question: If a user had used a smartphone application, then what would be the next application that he or she use? Another important problem in data mining is sequential pattern mining problem, whose goal is to discover patterns indicating the sequence of items that were purchased by a customer. Sequential pattern mining is one of data mining tasks that extracts frequent subsequences as patterns from a sequence database which aims at finding sets of data items occurring together frequently in some sequences.. 立. 政 治 大. It was first introduced by Agrawal and Srikant in the mid 1990’s [18]. Sequential pattern. ‧ 國. 學. mining problem can be described as follows: There is a transaction database D, where each transaction consists of the following fields or columns: customer-id, transaction-time, and the. ‧. items purchased in the transaction. An itemset is a non-empty set of items, and a sequence is an. y. Nat. sit. ordered list of itemsets. All transactions made by a customer are sorted by time in ascending. n. al. er. io. order and together can be viewed as a sequence. Each transaction corresponds to a set of items,. i Un. v. and the ordered list of transactions corresponds to a sequence. The purpose of sequential pattern. Ch. engchi. mining is to discover orders of items that were purchased by a customer in successive transactions. For example, a sequential pattern indicates that if a customer purchased an item A in a transaction then he or she would purchase an item B in the successive transaction. Sequential pattern mining is a very deep and broad research area in the field of data mining with wide range of applications. One of the applications is to use frequent pattern discovery methods in Web log data which aims at to obtain information about the navigation user behavior. Web mining and sequential pattern mining are also well researched. Many paper implement sequential pattern mining methods on web log data as one kinds of web mining. In the paper [19], three pattern mining approaches are investigated from the Web usage mining 13.
(25) point of view. Just similar to this kind of web mining which automatic discovery of user access patterns from Web, our research’s goal is to discover usage pattern of smartphone.. 2.4.4 PrefixSpan by Pattern-Growth Approach Sequential pattern mining is an important data mining problem and also is a practical method with broad applications from analysis of customer purchase behavior to web browse patterns, from economics stock trend prediction to biological gene sequence discovery and so. 政 治 大. on. As the result, after sequential pattern mining was first introduced by Rakesh Agarwal and. 立. Ramakrishnan Srikant in 1995, many algorithms related to sequential pattern mining have been. ‧ 國. 學. introduced.. In the paper [20], author classify current sequential pattern mining algorithms including. ‧. Apriori, AprioriALL, GSP, SPADE, FreeSpan, WAP-Mine, PrefixSpan, SPAM, PLWAP,. y. Nat. sit. DISC-all, FS-Miner, Apriori-GST, HVSM and LAPIN into four categories: Apriori-based,. n. al. er. io. Pattern-growth, Early pruning and Hybrid algorithms based on important key features. i Un. v. supported by the techniques. Meanwhile, many papers may choose some algorithms, then using. Ch. engchi. specific data and provide experiments to compare performance in execution time, memory, and discuss which algorithm is good or better. However, to the best of our knowledge, algorithm is the best for all applications. What algorithm is the best? The answer depends on the data characteristics and applications. In this thesis, we will not put emphasis on running time or memory cost given by different algorithms, our focus will be on the meaningful and interesting patterns. So, we implement a “suitable” approach (which means that it considers the characteristics of the data we use). We refer to an existing algorithm for the sequential pattern mining problem, implement methods for data processing and data format transformation and also implement a modified version of the algorithm that consider time constraint between 14.
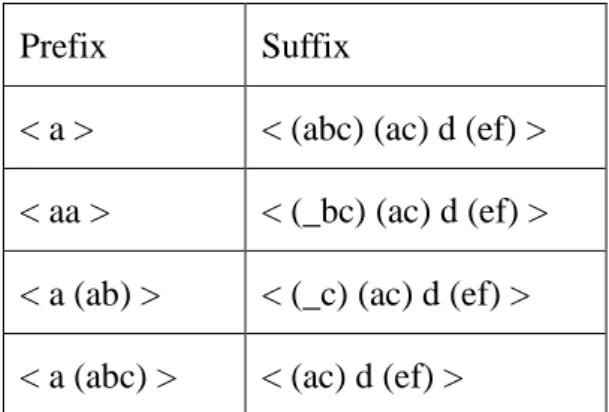
(26) items. PrefixSpan is based on pattern growth which is one of major techniques for sequential pattern mining. Though it has been proposed by J. Pei et al. [21] in the early 2000’s, PrefixSpan is still interested by considering of all the novel algorithms nowadays in 2013 paper [22]. In the paper [23], the author quoted that “Among the various approaches, PrefixSpan was one of the most influential and efficient ones in terms of both time and space. Some approaches may achieve better performance under special circumstances; however the overall. 政 治 大. performance of PrefixSpan is among the best. For example LAPIN is more efficient for dense. 立. data sets with long patterns but less efficient in other cases. Besides, it consumes much memory. ‧ 國. 學. than PrefixSpan. SPAM outperforms the basic PrefixSpan but is much slower than PrefixSpan with pseudoprojection technique.”. ‧. As one of the efficient sequential pattern mining algorithms, PrefixSpan [21] in the. Nat. sit. y. pattern generation process it partitions the sequence to get a “prefix” and a “suffix”, and then. n. al. er. io. only the projected databases of frequent prefixes are generated based on their suffixes. For. i Un. v. example, give a sequence { a (abc) (ac) d (ef) }, which a, b, c, d, e, f represent items, < a >, <. Ch. engchi. aa >, < a (ab) > and < a (abc) > are prefixes of this sequence, and the corresponding suffixes are shown in Figure 2 below.. Prefix. Suffix. <a>. < (abc) (ac) d (ef) >. < aa >. < (_bc) (ac) d (ef) >. < a (ab) >. < (_c) (ac) d (ef) >. < a (abc) >. < (ac) d (ef) >. Figure 2. An example of prefixes and suffixes.. 15.
(27) The process runs recursively. Each time it finds new prefixes of length 1. Therefore, the pattern is growing one item longer at a time. The separation of prefix and suffix prunes the candidate sequences greatly, allowing a much smaller search space and thus less running time. PrefixSpan also employs a pseudo projection mechanism, which avoids physically copying suffixes by representing the corresponding sequence with an index and the starting position of the projected suffix in the sequence. When the sequence database or the projected database can be loaded into memory, pseudo projection can further improve the efficiency.. 政 治 大. Let a set of items be denoted as I = {i1, i2, … , im} and a set of sequences be denoted as T. 立. = {s1, s2, … , sn}. Each sequence in S contains a set of items. D is a database that consists of a. ‧. ‧ 國. 學. set of sequences. PrefixSpan Recursive:. y. Nat. io. sit. Input: Database Dα, Sequence α, Integer min_supp, Set P; Output: Set P. n. al. er. 1: P1 ← {frequent items in Dα} 2: for all items bi ϵ P1 do 3: β = (α1 → • • • → (αn∪{bi})). Ch. engchi. 4:. γ = (α1 → • • • → αn → (bi )). 5: 6:. if Supp(β, Dα) ≥ min_supp then P ← P∪{β}. 7: 8:. i Un. v. D’ ← (Dα)|β Prefixspan-Recursive(D’, β, min_supp, P). 9: end if 10: if Supp(γ, Dα) ≥ min_supp then 11: P ← P∪{γ} 12:. D’ ← (Dα)| γ. 13:. Prefixspan-Recursive(D’, γ, min_supp, P). 14: end if 15: end for Figure 3. Pseudocode of the PrefixSpan algorithm [21]. 16.
(28) Overall, PrefixSpan has the following advantages: No candidate sequence needs to be generated, and projected databases are shrinking as the algorithm proceeds.. 立. 政 治 大. ‧. ‧ 國. 學. n. er. io. sit. y. Nat. al. Ch. engchi. 17. i Un. v.
(29) CHAPTER 3 DATA. 3.1 Raw Data Description. 政 治 大. We use a real data set similar to the one used by Chen et al. in [24], which reflects the. 立. daily application usage of several smartphone users over a long period of time. More accurately,. ‧ 國. 學. we have a size 25 over half a year log records which contains 25 different users using 26. ‧. machines and the period of the raw data is from September 2010 to March 2011. The raw data set contains logs for each user. A sample portion of the data set is Table I. In the raw data set,. y. Nat. er. io. sit. every record includes Log_ID, a serial number representing the identifier of a record. Every record also includes User_ID and Machine_ID, which together identify a unique operating unit.. n. al. Ch. i Un. v. Moreover, anonymity of users is protected as no personal identification is stored. In addition,. engchi. every record is created with a timestamp and a geolocation, which is represented by latitude and longitude. To store user behavior data, we keep track of what application was used by a user, and it is recorded as “Package Name”; and we also keep track of what activity was done by a user, and it is recorded as “Operational Activity” as shown in Table I. In short, every record stores data about who used what application, where and when. Although it is a rich data set, in its raw format, it would not be suitable for our analysis. First of all, every log record in the raw data set seems independent of each other. It is difficult to. 18.
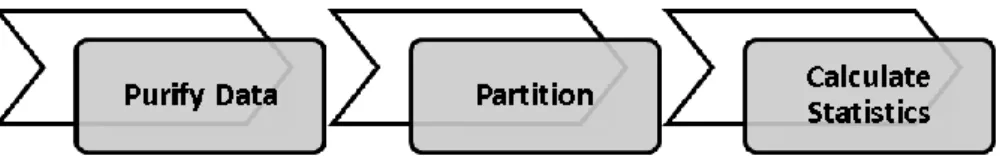
(30) identify a “usage session” of a user directly from the raw data set, where a usage session means the sequence of applications used by a user on a machine in a period of time. That is, a usage session is “a series of user behaviors” of a particular user, but it may be separated by tens or even hundreds of log records in the raw data set. Therefore, we have to do a series of data processing operations, cleaning and transformation operations included.. Table I. Smartphone user behavior log data.. USER_002. 立. Latitude. Operational. Longitude. Package Name Activity. 2010-11-17. MACHINE_013. 25.057679. 121.617137. 25.057679. 121.617137. com.android.camera. .CameraEntry. 17:47:07 2010-11-17. MACHINE_013 17:47:20. ctivity. 2010-11-17. MACHINE_013. .UploadPhotoA. com.facebook.katana. 25.057679. 121.617137. 17:47:40. ‧. 15555. USER_002. 政 治 大. Time. 學. 15554. USER_002. Machine ID. .Launcher. Nat. y. com.htc.launcher. n. er. io. al. 3.2 Data Processing. sit. 15553. User ID. ‧ 國. Log ID. i Un. v. We are given a database D of smartphone user behavior log data as our raw data, as we. Ch. engchi. introduced previously. Each record in the database D includes: Log_ID, User_ID, Machine_ID, Time, Latitude, Longitude, Package Name, and Operational Activity. In order to assist us in our analysis of application usage patterns of smartphone users, we would like to partition the database into a set of “sessions”, each of which corresponds to a series of application usages made by a user on a machine in a period of time.. Figure 4. Data Processing flow chart.. 19.
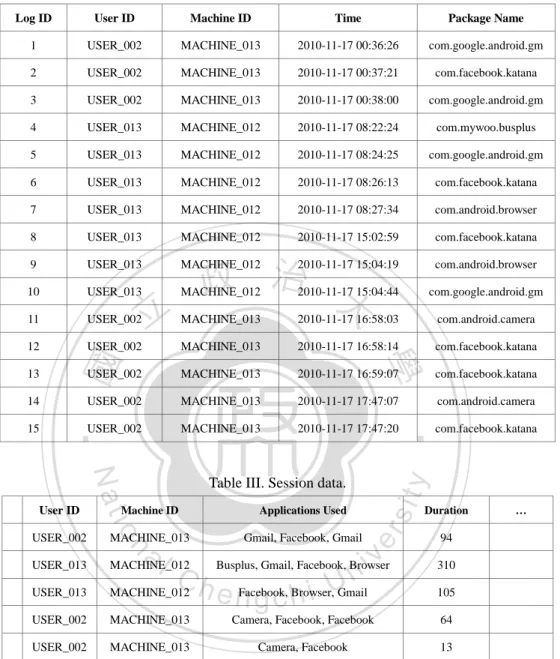
(31) There are three main functions in our program of data processing shown in Figure 4. We do a serious of data purification first, including scan the database, check every log record and examine values in every attribute. Remove incomplete data records such as records with “UnknownUse” in the attribute of User_ID that cannot be identified with. Then we carry on data partition. In the begin with partition, we order raw data by USER _ID, and define a session S as follows: S contains all the log records corresponding to the same user using the same machine, and the difference in time between two continuous log records in S does not. 政 治 大. exceed 10 minutes. As the result, each session is generated by combining time-relevant logs to. 立. represent a single usage period performed by a particular user. The fixed time gap 10 minutes. ‧ 國. 學. refers to [25], the authors gave a case study about whether users are "instant sharing" photo on Facebook after using camera. They defined "instant sharing" as the activity of user uploading. ‧. pictures to Facebook within 10 minutes after they are taken.. y. Nat. sit. Table II gives an example that shows a sample portion of an extraction of our raw data,. n. al. er. io. including Log_ID, User_ID, Machine_ID, Time, and Package Name. Then, we can collect and. i Un. v. separate log records to generate sessions, as shown in Table III, by the aforementioned. Ch. engchi. definition. After we partition raw data into session data, we do some calculations about session data including temporal and spatial information and how applications used. We will give the detail charts with description about those statistics of data.. 20.
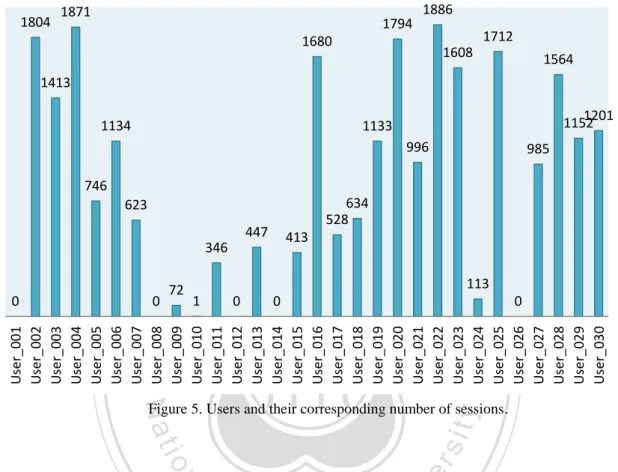
(32) Table II. A fragment of the raw data. Log ID. User ID. Machine ID. Time. Package Name. 1. USER_002. MACHINE_013. 2010-11-17 00:36:26. com.google.android.gm. 2. USER_002. MACHINE_013. 2010-11-17 00:37:21. com.facebook.katana. 3. USER_002. MACHINE_013. 2010-11-17 00:38:00. com.google.android.gm. 4. USER_013. MACHINE_012. 2010-11-17 08:22:24. com.mywoo.busplus. 5. USER_013. MACHINE_012. 2010-11-17 08:24:25. com.google.android.gm. 6. USER_013. MACHINE_012. 2010-11-17 08:26:13. com.facebook.katana. 7. USER_013. MACHINE_012. 2010-11-17 08:27:34. com.android.browser. 8. USER_013. MACHINE_012. 2010-11-17 15:02:59. com.facebook.katana. 9. USER_013. MACHINE_012. 2010-11-17 15:04:19. com.android.browser. 10. USER_013. MACHINE_012. 2010-11-17 15:04:44. com.google.android.gm. 11. USER_002. MACHINE_013. 2010-11-17 16:58:03. com.android.camera. 12. USER_002. MACHINE_013. 2010-11-17 16:58:14. com.facebook.katana. USER_002. MACHINE_013. 2010-11-17 16:59:07. com.facebook.katana. USER_002. MACHINE_013. 2010-11-17 17:47:07. com.android.camera. USER_002. MACHINE_013. 2010-11-17 17:47:20. USER_013. MACHINE_013. Gmail, Facebook, Gmail. y. com.facebook.katana. sit. Applications Used. Duration. er. Machine ID. al MACHINE_012 Busplus, Gmail, Facebook, Browser iv n C MACHINE_012 h e Facebook, Browser, n g c h i UGmail n. USER_013. Table III. Session data.. io. USER_002. Nat. User ID. ‧. 15. ‧ 國. 14. 學. 13. 立. 政 治 大. …. 94 310 105. USER_002. MACHINE_013. Camera, Facebook, Facebook. 64. USER_002. MACHINE_013. Camera, Facebook. 13. 3.3 Summary Statistics of Data Initially, there are 262,858 log records in our raw data. After we perform data processing, there are 25,880 sessions. We then give summary statistics and charts to illustrate some properties of our session data. Figure 5 shows the number of sessions to which each user contributes. There are 25 users in the data we use, the User_ID is count form User_001 to User_030, but User_001, 21.
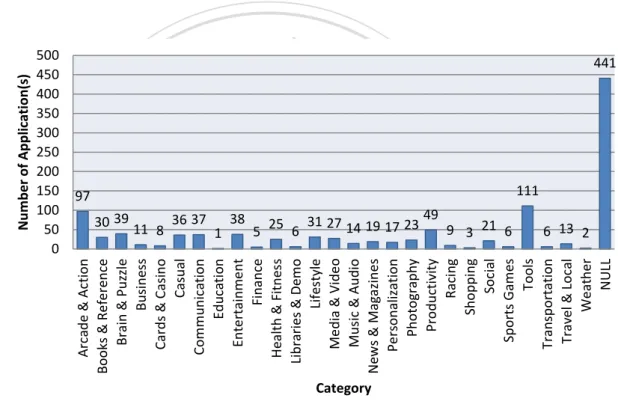
(33) User_008, User_012, User_014, User_026 are no records.. 1804. 1871. 1886. 1794. 1712. 1680. 1608. 1564. 1413 1134. 1201 1152. 1133 996. 746. 634 治 政 528 447 413 大. 623. 72. 1. 0. 0. 113 0. ‧. User_001 User_002 User_003 User_004 User_005 User_006 User_007 User_008 User_009 User_010 User_011 User_012 User_013 User_014 User_015 User_016 User_017 User_018 User_019 User_020 User_021 User_022 User_023 User_024 User_025 User_026 User_027 User_028 User_029 User_030. 0. 學. ‧ 國. 立346 0. 985. Nat. er. io. sit. y. Figure 5. Users and their corresponding number of sessions.. al. n. iv n C h e nwhen type of operations that a user performed h i anUapplication. There are 1,132 Package g cusing. Package Name is the name of an application used by a user. Operational Activity is the. Names and 3,099 Operational Activity in our session data. Hence, there are over one thousand applications that users installed and used, and there are over three thousands of operations that users performed. It is clear that an application may be associated with several operations or activities. For example, the application “Facebook” may contain activities such as “Login”, “Home”, “Feedback”, and “Upload Photo”. We also gathered statistics for groups of applications data (not from our raw data). Among 1125 applications, there are 684 applications that have been labeled as specified categories, as shown in Figure 6.There are 28 categories, including “NULL” which means. 22.
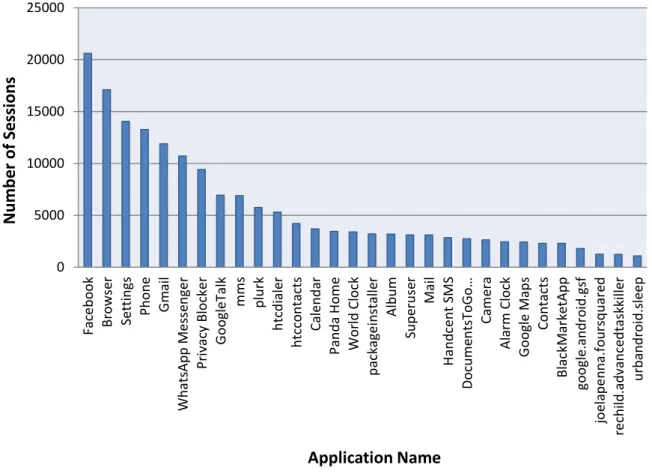
(34) there is no category information on the applications. We took a detailed view in this statistics and found that many common-used applications such as Album, Camera, Gtalk etc. are without category. Moreover, we discovered thatsome applications cannot be categorized accurately. For example, Gmail has been categorized as “Communication”, however, it can also be considered “Tools”. Due to the incomplete information and ambiguous definition of. 政 治 大. 立. 441. ‧ 國. 111. 30 39 11. 8. 36 37. 1. 38. 5. ‧. 97. 49 25 6 31 27 14 19 17 23 9 3 21 6. 6 13 2. sit. n. al. er. io. Arcade & Action Books & Reference Brain & Puzzle Business Cards & Casino Casual Communication Education Entertainment Finance Health & Fitness Libraries & Demo Lifestyle Media & Video Music & Audio News & Magazines Personalization Photography Productivity Racing Shopping Social Sports Games Tools Transportation Travel & Local Weather NULL. y. Nat. 500 450 400 350 300 250 200 150 100 50 0. 學. Number of Application(s). categories, we are not using the category information in our research.. Ch. i Un. v. i e n g c hCategory. Figure 6. Statistics of application categories.. The large number of applications installed by the users does not mean that they use them equally. We find that users devote most of their time using some specific applications. Let’s take the most popular application as an example. Facebook has been used in over 20,000 log records out of total 262,858 log records. Since our focus in this thesis is on applications, we show the distribution of top 30 applications, which are 33 most frequently used ones (with a support value above 0.5%) 23.
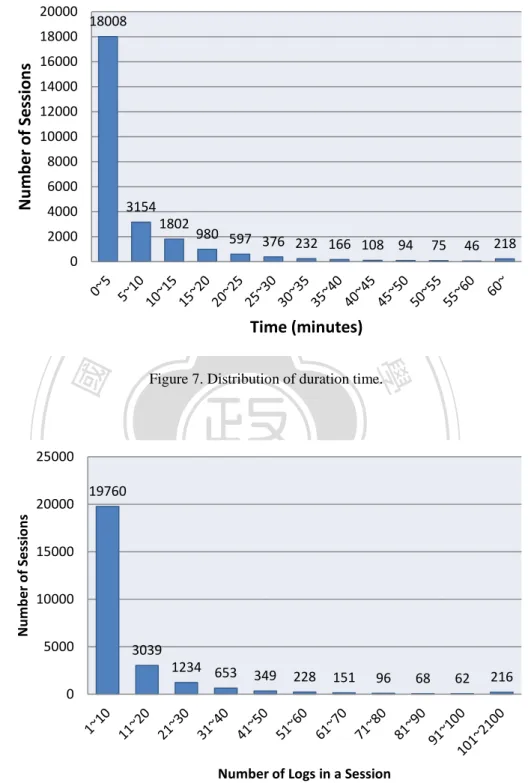
(35) omitting three launchers. The reason these launchers are deleted is that, rather than actual applications, they are automatic triggers that are recorded whenever user presses the Home key. Therefore, we can in fact generate rule sets with clearer meanings without these launchers in between. In the remainder of this thesis, all the related discussions will be focused on only the top 30 applications. We calculate the difference in time between the first and the last records in a session as the duration time of the session, showing the distribution of duration time in Figure 7. We can. 政 治 大. see that a large concentration of users’ one-time usage period (defined by the previous 10. 立. minutes definition we gave) time under 20 minutes. This phenomenon can be evidence that. ‧ 國. 學. support our definitions.. We also show the distribution of the number of log records in a session in Figure 8. We. ‧. calculate the number of locations in a session (which is the number of locations where a user. y. Nat. sit. was during his or her use of smartphone in the period of time) by calculating the number of. n. al. er. io. different latitude-longitude pairs in a session. Here is our finding. A smartphone is a mobile. i Un. v. device, but most of the users (who contribute their data to us) stayed at a location (or stayed in a. Ch. engchi. place where accurate latitude and longitude data are not available) and did not move.. 24.
(36) 20000. 18008. Number of Sessions. 18000 16000 14000 12000 10000 8000 6000 3154. 4000. 1802. 2000 0. 立. 980 597 376 232 166 108 94. ‧ 國. 學. Figure 7. Distribution of duration time.. ‧. n. al. 10000 5000. er. sit. y. 19760. io. Number of Sessions. Nat. 15000. 46 218. 政 治 大 Time (minutes). 25000 20000. 75. Ch. engchi. i Un. v. 3039 1234 653. 349. 228. 151. 96. 68. 62. 216. 0. Number of Logs in a Session Figure 8. Distribution of the number of logs in a session.. Considering the top 30 applications shown in Figure 9, we calculate the number of applications (among the top 30) that are used in a session, as shown in Figure 11. Please note 25.
(37) that we consider only the applications among the top 30 regardless of how many times that an application that is not among the top 30 is used in a session. There are 1,603 (out of 25,880) sessions that do not use any of the top 30 applications. The portion is small.. 25000. 15000. 立. 10000. ‧ 國. ‧. io. sit. y. Nat. n. al. er. 0. Facebook Browser Settings Phone Gmail WhatsApp Messenger Privacy Blocker GoogleTalk mms plurk htcdialer htccontacts Calendar Panda Home World Clock packageinstaller Album Superuser Mail Handcent SMS DocumentsToGo… Camera Alarm Clock Google Maps Contacts BlackMarketApp google.android.gsf joelapenna.foursquared rechild.advancedtaskkiller urbandroid.sleep. 5000. 政 治 大. 學. Number of Sessions. 20000. Ch. engchi. i Un. v. Application Name. Figure 9. Top 30 application names and their numbers of sessions.. 26.
(38) 25000. Number of Sessions. 20000. 19331. 15000. 10000 5887 5000 517 94 0 1. 2. 立. 3. 5 2 0 0 治 政 4 5 6 7 大 8 9 Number of Locations 19. 0. 0. 0. 1. 10. 11. 12. 13. ‧ 國. 學. Figure 10. Distribution of the number of unique locations in a session.. 7000. y. 6256. sit. io. al. n. Number of Sessions. 8000. er. 8893. Nat. 9000. ‧. 10000. 6000 5000. Ch. 3987. 4000 3000. engchi. i Un. v. 2200. 2000. 1229. 1000. 692. 412 251 141 90 43 27 18. 4. 5. 1. 3. 1. 0 1. 2. 3. 4. 5. 6. 7. 8. 9. 10 11 12 13 14 15 16 17 18. Number of Top-30 Applications Used Figure 11. Distribution of the number of top 30 applications used in a session.. Finally, we calculate the length of the sequence which implies how many applications are used sequentially in a session. As shown in Figure 12, we can see that most users switch 27.
(39) between 10 or less applications during his or her one-time usage period.. 25000 20938 Number of Sessions. 20000 15000 10000 5000. 立 0~5. 0. 6~10. 11~15. 16~20. 237. 129. 300. 21~25. 26~30. 31~. Length of Sequence. 學. Figure 12. Distribution of the length of sequence.. ‧. ‧ 國. 治 465 政 1000 大. 2811. sit. y. Nat. Consequently, there are basic information and statistics in our session data: user-id,. n. al. er. io. machine-id, start-time of the session, end-time of the session, duration of the session, the. v. number of log records in the session, and the number of locations in the session.. Ch. engchi. 28. i Un.
(40) CHAPTER 4 EXPERIMENT We have a database that stores smartphone users’ behavior log records, as we have introduced and described in detail in the previous section. Meanwhile, we have defined what a session is and explained the characteristics of the session data in the last section. Now, we will. 政 治 大. demonstrate experiments done by using traditional association rule mining method, sequential. 立. pattern mining method and an advanced sequential pattern mining method which considers. ‧. ‧ 國. 學. io. sit. y. Nat. n. al. er. time constraint.. Ch. engchi. i Un. v. Figure 13. Sequential pattern mining flow chart.. 29.
(41) 4.1 Association Rule Mining Method 4.1.1 Data Processor We use the session data (Table IV), which reflects the daily usage of multiple users over a long period of time.. Table IV. Session data. User ID. Machine ID. Applications Used. Duration. USER_002. MACHINE_013. Gmail, Facebook, Gmail. 94. USER_013. MACHINE_012. USER_002. Busplus,治 Gmail, Facebook, Browser 政 大 Gmail MACHINE_012 Facebook, Browser, 立 MACHINE_013 Camera, Facebook, Facebook. USER_002. MACHINE_013. 學. Camera, Facebook. 310 105 64 13. ‧. ‧ 國. USER_013. …. In order to find out relations between applications, we began with association rule. sit. y. Nat. mining. Considering the data, we then apply the transaction concept used in the market basket. n. al. er. io. analysis, and we create sets of session data with Boolean records called Boolean-session. Since. i Un. v. we have gathered statistics used to select top 30 applications that are used the most frequently,. Ch. engchi. we add corresponding fields to Boolean-session records. These fields are filled with Boolean values to create a data set of Boolean-session records, as shown in Table V. As a result, each Boolean-session session includes not only user basic information (User-id, Machine-id, applications be used in Boolean record) but also statistics of session such as durations in the session, number of locations in the session etc. It is worth emphasizing that in each session, we focus on what application is used. So no matter how many times the application is used in the session, the corresponding field is filled up with ”1” and the corresponding field is fixed by the order of top 30 applications instead of the order of applications used in the session.. 30.
(42) Table V. Boolean-session data set. …. Gmail. …. User ID. Machine ID. Facebook. Browser. Camera. USER_002. MACHINE_013. 1. 0. 1. 0. USER_013. MACHINE_012. 1. 1. 1. 0. USER_013. MACHINE_012. 1. 1. 1. 0. USER_002. MACHINE_013. 1. 0. 0. 1. USER_002. MACHINE_013. 1. 0. 0. 1. 政 治 大 By focusing on the 30 Boolean attributes of the applications that are used the most 立 4.1.2 Association Rule Mining. ‧ 國. 學. frequently, we can generate association rules with the Apriori-based algorithm by Weka. Weka [26] is an open source data mining software written in Java, which is a collection. ‧. of machine learning algorithms for data mining tasks. WEKA contains implementations of. sit. y. Nat. algorithms for classification, clustering, and association rule mining with graphical user. n. al. er. io. interfaces and visualization utilities for data exploration. The algorithms can either be applied. i Un. v. directly to a data set with particular formats (such as CSV or ARFF) or be called from the. Ch. engchi. user’s own Java code. We use Weka 3.6.6 in our experiments. We give a definition to our problem as follows: An item i in the data set is defined as an application that a user used on a smartphone. Let a set of items I = {i1, i2, … , in} be the itemset, and let a set of Boolean-session records T = {t1, t2, … , tm} be a data set that keeps the usage records of transactions. An association rule containing two sets of items, X and Y, can be generated in the form of X ⇒ Y, where X, Y ⊆ I and X∩Y = ∅. In association rule mining experiment, we apply our Boolean-session data which after our data processor code in Java that create the attribute “applications used” in Boolean records to Weka directly by CSV data format. After the Apriori-based method in tool Weka is. 31.
(43) executed, we can generate a number of rules with the above method. We extract some sample rules, which include Facebook, Camera, and Album, and report them in Table VI.. Table VI. Rules generated by Apriori-based algorithm.. Set of items X. support. . Set of items Y. support. confidence. Facebook, Album. 316. . Camera. 223. 0.71. Album. 1088. . Camera. 586. 0.54. Facebook, Camera. 554. . Album. 223. 0.4. Albun, Camera. 586. . Facebook. 223. 0..38. Camera. 557. 586. 0.38. Camera. 557 立 554. 554. 0.36. 177. 0.32. Facebook, Camera. Album 政 治 Facebook大 . Gmail. ‧ 國. 學 4.1.3 Results. ‧. We list all the results generated by the Apriori-baed algorithm provided by Weka in. y. Nat. n. al. Ch. er. io. conditional probability minimum confidence is 0.03.. sit. Table VII. The minimum support is 0.01 for both two sets of items, X and Y and the. i Un. v. Association rule mining aims at finding “intra transaction” relationships. Although those. engchi. relationships represent some kind of usage patterns, we do not know the sequence of application usages. Take the following result as an example: Rule 9: Album (1088) Camera (586) 0.54 The above result means that Album and Camera are both used more than one percent of all sessions, and the number of sessions that has used Album is 1088; the number of sessions that has used both Album and Camera is 586. Moreover, under the condition of using Album, the probability of using Camera is 0.54. We can see the corresponding rule in Rule 15 similarity. However, we cannot gain the knowledge of which application is used first from this Rule.. 32.
(44) Such a sequence could be more meaningful. For example, we would like to answer the following question: “After using camera, what application would be used by a user next? Therefore, we intend to apply sequential pattern mining to our data set.. Table VII. Rules generated by Apriori-based algorithm.. Set of items X. . Set of items Y. confidence. 1 htcdialer. 3465. . Phone. 2680. 0.77. 2 contacts. 888. . Phone. 673. 0.76. 3 Gmail htcdialer. 449. 339. 0.76. 402. 0.75. 494. 0.72. . Phone. 6 Packageinstaller. 635. . QCustomShortcut. 453. 0.71. 7 Phone. 784. . htcdialer. 494. 0.63. 1378. . Phone. 784. 0.57. 1088. . Camera. 586. 0.54. 1378. . htcdialer. 689. 0.5. 339. 0.5. 402. 0.48. 593. 0.4. 2680. 0.38. ‧ 國. 5 htcdialer htccontacts. 學. 立 689. y. Phone 治 533 政 Phone 大. ‧. 4 MMS htcdialer. . Nat. 9 Album. io. 10 htccontacts. htcdialer a l 682 v 839 htcdialer n i Ch 1488 en g c QCustomShortcut hi U. n. 11 Phone Gmail. er. 8 htccontacts. 12 Phone MMS 13 Privacy Blocker. sit. htccontacts. 6790. . htcdialer. 15 Camera. 1557. . Album. 586. 0.38. 16 htccontacts. 1378. . Phone htcdialer. 494. 0.36. 17 Camera. 1557. . Facebook. 554. 0.36. 18 Panda Home 2. 1252. . WhatsApp Messenger. 443. 0.35. 19 Plurk. 1422. . Browser. 453. 0.32. 20 Google Maps. 1056. . QCustomShortcut. 334. 0.32. 21 Google Maps. 1056. . Facebook. 333. 0.32. 22 Plurk. 1422. . WhatsApp. 438. 0.31. 14 Phone. Messenger. 33.
(45) 4.2 Sequential Pattern Mining Method In the last section, we apply association rule mining on Boolean-session data and get some results. But we are not satisfied with these results. We want to get more informative rules not just what applications may be used together but the certain order of sequence. That is, we are interested in answering the following question: “If a user had used a smartphone application, then what would be the next application that he or she uses?” Another important problem in data mining is sequential pattern mining problem, whose goal is originated from. 政 治 大. discovering patterns indicating the sequence of items that were purchased by a customer.. 立. However, we cannot use sequential pattern mining method directly to generate frequent. ‧ 國. 學. sequential patterns for our purpose. Because a pattern found by the traditional sequential pattern mining algorithm indicates the correlation between transactions and such. ‧. “inter-transaction” relations are not what we want. In other words, results found by the classic. y. Nat. sit. association rule mining algorithm concern about which items coming from the same. n. al. er. io. transaction occur together frequently. Results found by the traditional sequential pattern. i Un. v. mining algorithm show which items coming from different transactions appear in a certain. Ch. engchi. order. Considering these properties, we feel the need to design a method able to find out the rules in which items appear in a certain order and come from the same transaction. In addition, any sequential pattern mining algorithms or tools can’t be used directly on our data. So, first of all, we need a data processor to do a series of processing that including purification and partition. But this time, the session data is different from the Boolean-session, we create a session that keeps the concept of “transaction” while records the sequence of applications used. Then we need a data formatter for the tool of SPMF (A Sequential Pattern Mining Framework) [27] and a result processor that deal with the output of SPMF.. 34.
(46) 4.2.1 Data Preprocessoring We prepare the data set from the session data (Table IV). We then bring in the concept of sequence to create sets of Sequence-session data for each session. As a result, we actually record the applications one by one according to their timestamps instead of Boolean values. Following is an example that Table VIII is a part of raw data and Table IX is a Sequence-session which transform from Table VIII.. 治 政 大Name Machine ID Time Package 立 Table VIII. A portion of the raw data.. MACHINE_013. .BrowserActivity. 2010-11-17. com.android.camera. .CameraEntry. 16:58:03 MACHINE_013. 2010-11-17. .UploadPhotoActivity. y. com.facebook.katana. com.htc.launcher. 16:58:53. n. al. 2010-11-17. sit. 16:58:14. MACHINE_013. io. USER_002. com.android.browser. 16:52:15. Nat. USER_002. 2010-11-17. Activity. ‧. ‧ 國. USER_002. MACHINE_018. Operational. 學. USER_005. er. User ID. Ch. USER_002. MACHINE_013. USER_002. MACHINE_013. i Un. .Launcher. v. 2010-11-17. com.facebook.katana. .UploadPhotoActivity. 2010-11-17. com.facebook.katana. .ViewPhotoActivity. com.htc.launcher. .Launcher. com.htc.launcher. .Launcher. e16:59:07 ngchi 16:59:08. USER_002. MACHINE_013. 2010-11-17 16:59:09. USER_002. MACHINE_013. 2010-11-17 17:27:06. Table IX. A sample of Sequence-session. User ID. Machine ID. App1. App2. App3. App4. App5. USER_002. MACHINE_013. Camera. Facebook. Launcher. Facebook. Launcher. 35. ….
(47) We use time-gap to divide raw data into sessions based on the same user and the same machine. Logs within 10 minutes are considered relevant and combined into the same session, whereas logs that are apart more than 10 minutes are divided into different sessions (since the user is likely to have finished his or her usage). We assume that there is a weak relationship between two application usages in the same session if their timestamps are away from each other for more than 10 minutes. Consequently, the last log in Table VIII will not join in the session because of its 30 minutes interval of time. And based on the user, the first log in Table. 政 治 大. VIII also not be included in the session because of it’s done by USER_005 not USER_002.. 立. Then, we discovered that successive duplicates Package Name (applications user used). ‧ 國. 學. exist within sessions. This can straightforwardly means the user keeps using an application with different activities during the session, or it can come from the fact that we filter out infrequent. ‧. applications when we construct the sessions. In either case, it is better to eliminate these. y. Nat. sit. duplicates and keep only one appearance of the application since we are focusing on the usage. n. al. er. io. patterns instead of activities patterns. Otherwise, if this situation is abundant, PrefixSpan. i Un. v. would generate sequential patterns containing identical applications in sequence. Such pattern. Ch. engchi. would be uninformative for our research and also erroneous, because it should only be considered a single usage of that application. Moreover, we do not want to see the traditional sequential pattern mining algorithm grouping our sessions by User_ID and finding relationships between sessions. The reason is as follows: It is not usual for one to use Facebook in the morning and Camera in the afternoon while we still consider the usages of these two applications are in the same session. This could happen since the usages of these two applications may be related, but we think that it makes more sense to treat them as two usages in two sessions. The following tables show our Sequence-session data which divide items with time-gap and the traditional sequence that 36.
(48) group items by User.. Table X. A sample of our Sequence-session data. App1. App2. App3. App4. …. User ID. Machine ID. USER_002. MACHINE_013. Gmail. Facebook. Gmail. -. -. USER_013. MACHINE_012. Busplus. Gmail,. Facebook. Browser. -. USER_013. MACHINE_012. Facebook. Browser. Gmail. -. -. USER_002. MACHINE_013. Camera. Facebook. Facebook. -. -. USER_002. MACHINE_013. Camera. Facebook. -. -. -. (Gmail, Facebook, Gmail), USER_002. (Camera, Facebook, Facebook),. ‧. (Camera, Facebook). er. io. sit. (Facebook, Browser, Gmail). y. (Busplus, Gmail, Facebook, Browser), USER_013. Nat. Sequential Pattern Mining a4.2.2 iv l C n pattern mining we would h e nexperiment, gchi U. n. In sequential. 學. ‧ 國. 政 治 大 Table XI. A sample of traditional sequence. 立 User ID Sequence. like to apply our. Sequence-session data (which is already processed by data processor) to SPMF [27] via a data formatter. SPMF is an open source data mining platform written in Java which offers implementations of data mining algorithms for association rule mining, sequential pattern mining, clustering etc. SPMF is a project founded by Philippe Fournier-Viger and it has been cited by or used in various studies since 2010. In our work we use PrefixSpan algorithm and its implementation in the open source SPMF toolkit. After data processor and data formatter to the raw data, we then make minor changes to the source code of PrefixSpan module provided by the tool SPMF, in order to make the. 37.
(49) algorithm suitable for our data set. The data processor we had illustrated with an example in chapter 4.2.1 The data formatter is a program that converts application names into integers, so that the SPMF tool can execute normally. After that, it is necessary that we need a result processor dealing with the output of SPMF and transform to the readable and meaningful results. PrefixSpan is based on pattern growth which is one of major technique for sequential pattern mining. The key idea is to avoid. 政 治 大. the candidate generation step altogether, and to focus the search on a restricted portion of the. 立. initial database.. ‧ 國. 學. There are three major properties that PrefixSpan algorithm is suitable for our research. First of all, PrefixSpan is designed for dense database which exactly meet our data (composed. ‧. of the top 30 most frequently used applications that support are all exceed 0.5%). Then, there. y. Nat. sit. is no need for candidate generation in PrefixSpan and it is recursive the projected databases of. n. al. er. io. frequent prefixes which are generated based on their suffixes. It finds new prefixes of length 1. i Un. v. and the pattern is growing one item longer at a time. Therefore, it can be expanded with more. Ch. engchi. constraint or condition between items, such as time constraint, when forming frequent patterns. Moreover, since the algorithm of PrefixSpan is based on recursively constructing the patterns by growing on the prefix, there are several advantages in practice. It is capable of dealing very large database, and the search space is reduced at each step, allowing better performance in the presence of small support thresholds. In addition, there are three different projection methods developed for PrefixSpan: level-by-level projection, bi-level projection and pseudo projection. In SPMF, PrefixSpan algorithm is implemented with pseudo projection which is the most efficient among three. 38.
數據
![Figure 3. Pseudocode of the PrefixSpan algorithm [21].](https://thumb-ap.123doks.com/thumbv2/9libinfo/8299419.174041/27.892.139.806.375.1136/figure-pseudocode-prefixspan-algorithm.webp)
+7

相關文件
If we would like to use both training and validation data to predict the unknown scores, we can record the number of iterations in Algorithm 2 when using the training/validation
• Information retrieval : Implementing and Evaluating Search Engines, by Stefan Büttcher, Charles L.A.
Since the FP-tree reduces the number of database scans and uses less memory to represent the necessary information, many frequent pattern mining algorithms are based on its
This bioinformatic machine is a PC cluster structure using special hardware to accelerate dynamic programming, genetic algorithm and data mining algorithm.. In this machine,
We try to explore category and association rules of customer questions by applying customer analysis and the combination of data mining and rough set theory.. We use customer
Furthermore, in order to achieve the best utilization of the budget of individual department/institute, this study also performs data mining on the book borrowing data
Step 5: Receive the mining item list from control processor, then according to the mining item list and PFP-Tree’s method to exchange data to each CPs. Step 6: According the
(1999), "Mining Association Rules with Multiple Minimum Supports," Proceedings of ACMSIGKDD International Conference on Knowledge Discovery and Data Mining, San Diego,
