Femtosecond Fluorescence Dynamics of Porphyrin in Solution and Solid Films: The Effects
of Aggregation and Interfacial Electron Transfer between Porphyrin and TiO
2Liyang Luo,†Chen-Fu Lo,‡ Ching-Yao Lin,*,‡I-Jy Chang,§and Eric Wei-Guang Diau*,† Department of Applied Chemistry, Institute for Molecular Science and Center for Interdisciplinary Molecular Science, National Chiao Tung UniVersity, Hsinchu, Taiwan 300, Department of Applied Chemistry, National Chi Nan UniVersity, Puli, Nantou Hsien, Taiwan 545, and Department of Chemistry, National Taiwan Normal UniVersity, Taipei, Taiwan 116
ReceiVed: September 21, 2005; In Final Form: NoVember 4, 2005
The excited-state relaxation dynamics of a synthetic porphyrin, ZnCAPEBPP, in solution, coated on a glass substrate as solid films, mixed with PMMA and coated on a glass substrate as solid films, and sensitized on nanocrystalline TiO2films were investigated by using femtosecond fluorescence up-conversion spectroscopy
with excitation in the Soret band, S2. We found that the S2f S1electronic relaxation of ZnCAPEBPP in
solution and on PMMA films occurs in 910 and 690 fs, respectively, but it becomes extremely rapid, <100 fs, in solid films and TiO2films due to formation of porphyrin aggregates. When probed in the S1state of
porphyrin, the fluorescence transients of the solid films show a biphasic kinetic feature with the rapid and slow components decaying in 1.9-2.4 and 19-26 ps, respectively. The transients in ZnCAPEBPP/TiO2films
also feature two relaxation processes but they occur on different time scales, 100-300 fs and 0.8-4.1 ps, and contain a small offset. According to the variation of relaxation period as a function of molecular density on a TiO2surface, we assigned the femtosecond component of the TiO2films as due to indirect interfacial
electron transfer through a phenylethynyl bridge attached to one of four meso positions of the porphyrin ring, and the picosecond component arising from intermolecular energy transfer among porphyrins. The observed variation of aggregate-induced relaxation periods between solid and TiO2films is due mainly to aggregation
of two types: J-type aggregation is dominant in the former case whereas H-type aggregation prevails in the latter case.
1. Introduction
The most efficient dye-sensitized solar cells (DSC) with use of ruthenium polypyridyl complexes as photosensitizers and nanocrystalline TiO2 films as semiconductor substrates have
achieved energy conversion efficiency greater than 10%.1-3In
addition to the enhanced surface area due to the nanoporous nature of TiO2films, which greatly increases the light-harvesting
capability,1a there are two interfacial electron-transfer (IET)
processes, forward and backward IET, believed to be critical to the overall efficiency of a DSC.1bThe forward IET ensures
electron injection from the electronically excited state of the molecular dyes into the conduction band of TiO2through the
carboxylate group that transports electrons effectively.2 The
electrons injected into the conduction band might recombine with the dye cation through the backward IET channel, thus reducing the dye molecule to the ground state.1,2Understanding
the mechanistic features and the corresponding dynamics of these IET processes would help to improve further the efficiency of the photovoltaic effect in solar energy conversion and storage. The electron-injection dynamics of dye/TiO2systems based
on femtosecond (fs) transient absorption measurements were first reported from the pioneering work of Tachibana et al.;4
they observed a biphasic temporal profile of which the rapid
component decays in <150 fs and the slow one in 1.2 ps. Later, Lian and co-workers5employed fs transient IR spectroscopy to
study the IET dynamics of dye-sensitized nanocrystalline TiO2
thin-film systems; their research focused mainly on Gra¨tzel’s N3/TiO2 system, and several analogous dye-semiconductor
systems were also investigated.5d,6These authors found that the
forward IET process was characterized by an ultrarapid com-ponent with a time constant smaller than 100 fs, and a slow component that is sensitive to sample conditions. Furthermore, the rate of electron injection from the N3 dye to various semiconductors obeyed a trend TiO2> SnO2> ZnO, indicating
a strong dependence on the nature of the semiconductor; the rate of injection depended on the redox potential of the photosensitizer, pH of the solution, and excitation energy. A two-state injection model was proposed: the rapid, <100 fs, component was attributed to injection from a nonthermalized excited state and the slow component to injection from the thermalized excited state of the dye.
Sundstro¨m and co-workers discussed the issue of forward IET rates for N3/TiO2and other related systems based on
measure-ments of fs UV/visible transient absorption spectra.7Their results
are similar to those of others who found the interfacial dynamical process of the N3/TiO2 family to involve two distinct time
scales. The assignment made by the former group is also similar: the sub-100-fs component corresponds to electron injection from the singlet excited state,1MLCT, of a sensitizer
to the conducting band of TiO2nanoparticles, whereas the
1-10-ps component relates to electron injection from the triplet excited state,3MLCT, to the conducting band of the TiO
2nanoparticles.
* Address correspondence to this author. Fax: (886)-03-572-3764. E-mail: [email protected].
†National Chiao Tung University. ‡National Chi Nan University. §National Taiwan Normal University.
10.1021/jp055365q CCC: $33.50 © 2006 American Chemical Society Published on Web 12/07/2005
occur from a photosensitizer with an excited-state redox potential below the conduction band edge of the semiconductor, indicating that the forward IET following an “upstream” potential-energy pathway is possible.7a
Ultrarapid IET dynamics of many other systems with use of organic dyes as photosensitizers have been investigated.9-17A
common feature of the forward IET dynamics of all dye/TiO2
systems is the biphasic nature of decay of the transients with rapid and slow processes occurring on fs and ps time scales, respectively; the rapid process has been coherently assigned to involve electron injection directly from dye to TiO2whereas
the assignment of the slow process remains under discussion. For example, Wenger et al.18reported that the slow component
of the N3/TiO2system is due to the aggregated state of the dye,
which is against the two-state mechanism aforementioned. Another ultrarapid investigation19indicates, however, that the
electron-injection dynamics of the porphyrin/TiO2system are
similar to those of the N3/TiO2 system, making the former
system a prospective candidate for DSC applications.20-24
The capability of porphyrins to absorb visible light in the 400-450 nm region (B or Soret band) and in the 500-700 nm region (Q bands) has been used in the design of artificial light-harvesting systems.25As examples, multiporphyrin arrays have
been constructed with several linkers that are suitable for the preparation of linear or extended architectures via attachment at the meso position.26,27Recent advances in organic synthesis
have allowed the preparation of linear and semirigid harvesting arrays with use of porphyrin pigments linked by phenylethyne (PE) spacers.28On the basis of a similar idea, we have designed
zinc porphyrin pigments to serve as photosensitizers in our investigation of interfacial electron-transfer dynamics between porphyrins and TiO2 in a systematic way. The molecular
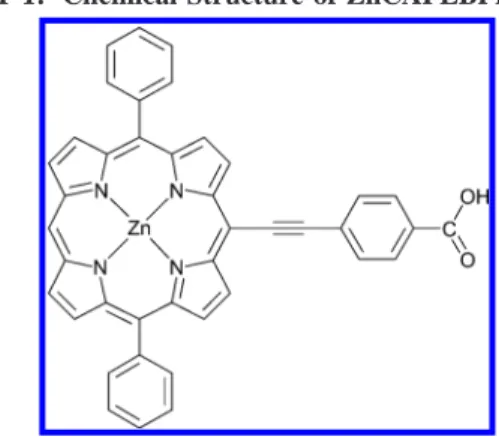
structure of the sensitizer system is comprised of three parts: a zinc biphenylporphyrin (ZnBPP) unit serves as light-harvesting center to provide photoinduced electrons, the PE group is connected to the meso position of the porphyrin to transfer the electrons efficiently, and the carboxylic acid (CA) attached to the end of the spacer serves as an anchoring group to bond tightly onto the surface of TiO2nanoparticles. To vary
system-atically the distance between the electron donor (porphyrin) and the electron acceptor (TiO2), theπ-conjugated linker has been
extended from one to four PE spacers with only one CA end group; hence we denote the porphyrin pigments as ZnCA-(PE)xBPP, with x ) 1-4 for the series; the chemical structure
of ZnCAPEBPP is shown in Chart 1.
Most recent results on IET dynamics of dye/semiconductor systems were obtained from fs transient absorption measure-ments, but there are few reports on such systems based on using the fs fluorescence decay methods (e.g., ref 9) because of the minuscule quantum yield of fluorescence in the presence of the IET process. Fluorescence decay methods offer, however, a
unique detection window to monitor only the relaxation process occurring in the excited state of the dye without involving the complicated ionic states of the dye and the semiconductor after charge separation. Thus, interpretation of kinetic data obtained from these fluorescence decay methods should be simpler and more straightforward than that obtained from transient absorp-tion methods. In the present work, we have employed a fs fluorescence up-conversion technique to interrogate the forward IET dynamics of the ZnCAPEBPP-sensitized TiO2
nanocrys-talline films upon excitation into the S2state of the porphyrin
(λex) 420-430 nm). Because aggregation of porphyrins might
be a drawback for photoenergy conversion, we have assessed the effect of aggregation through comparison of the relaxation dynamics obtained from ZnCAPEBPP/THF solution, pure ZnCAPEBPP deposited on a plate-glass substrate, and the ZnCAPEBPP/PMMA mixture deposited on a plate-glass sub-strate. We found that S2 f S1 internal conversion (IC) of
ZnCAPEBPP becomes extremely rapid when the porphyrin molecules stack together to form J-type aggregates; the S1
species are produced within that time scale, <100 fs, but disappear with a biphasic dynamical nature: the rapid compo-nent decays in∼2 ps whereas the slow one decays in ∼20 ps. The fluorescence transients of the ZnCAPEBPP/TiO2 system
observed in the S1state also feature two major decay
compo-nents, but the decay coefficients are on much shorter time scales: 100-300 fs and 1-4 ps for the rapid and slow decays, respectively. We assigned the rapid component to electron injection from porphyrin to TiO2; the slow component, of which
the decay coefficients are sensitive to the molecular density of porphyrins on TiO2 films, are due mainly to intermolecular
energy transfer among porphyrins. 2. Experimental Section
2.1. Materials. A standard Sonogashira cross-coupling method was used to synthesize porphyrin ZnCAPEBPP.29The
reactions were monitored by TLC and UV/visible spectra. Cross-coupling mono-brominated biphenylporphinato zinc with 3 equiv of 4-ethynylbenzoic acid typically afforded ZnCAPEBPP in 80% yield after purification on silica gel with MeOH/CH2Cl2eluants
and crystallization from THF/hexane. 4-Ethynylbenzoic acid was prepared from trimethylsilylethyne and 4-iodobenzoic acid in 65% yield. A glovebox (MBraun Uni-lab), a vacuum line, and standard Schlenk techniques were employed to process all materials sensitive to air. Solvents (Merck, Darmstadt, Ger-many), Pd(PPh3)4catalyst (Strem Chemical Inc, MA), and other
chemicals (Acros Organics, NJ) were obtained from the indicated suppliers. Solvents used in cross-coupling experiments were purified according to literature methods.30
(230-400 mesh, Merck). All NMR solvents (Cambridge Isotope Lab, Inc.) were used as received. Data for characterization of ZnCAPEBPP follow: 1H NMR (d
6-DMSO at 2.50 ppm) 10.36
(s, 1H), 9.84 (d, J ) 5 Hz, 2H), 9.46 (d, J ) 5 Hz, 2H), 8.92 (d, J ) 5 Hz, 2H), 8.84 (d, J ) 5 Hz, 2H), 8.25 (m, 8H), 7.86 (m, 6H). Elemental analysis of C41H24N4O2Zn‚THF, calculated
C 72.83, H 4.35, N 7.55, found C 72.35, H 4.60, N 7.27. 2.2. Sample Preparation. Samples were prepared in both solution and thin films. For solutions, ZnCAPEBPP was dissolved in THF (Merck, spectral grade) to form a homoge-neous solution of concentration 1.0 × 10⁻⁵ M. The pure ZnCAPEBPP solid films were obtained by spin-coating the ZnCAPEBPP/THF solution onto a plate-glass substrate and allowing the solvent to evaporate slowly in a vacuum hood. To make thin films in solid solution, we mixed ZnCAPEBPP with a transparent polymer, poly(methyl methacrylate) (PMMA), in a 1:5000 ratio by mass. The ZnCAPEBPP/PMMA mixture was dissolved in trichloromethane (Merck, pro analysi) to form a viscous solution and then smoothly deposited onto a glass plate via a standard spin-coating procedure.
The procedure for synthesis of TiO2nanoparticles is described
elsewhere.31Briefly, a quantity of titanium isopropoxide was
added, dropwise at 25°C, to nitric acid (0.1 M, 750 mL) under vigorous stirring. Immediately after this hydrolysis, the white slurry was heated at 80 °C and the solution was stirred vigorously for 8 h to achieve peptization. The nanoparticle thin films of TiO2were prepared with 15 layers by spin-coating on
glass and heating at 450°C in an oven for 30 min. The electron micrograph of the TiO2 nanocrystalline thin film (Figure 1)
shows that the size of TiO2particles is about 15 nm and the
film thickness is∼2 µm. Porphyrin molecules were adsorbed onto TiO2nanocrystalline thin films from ZnCAPEBPP
solu-tions in THF/CH2Cl2(1:14) for 4 h. To examine the effect of
aggregation affecting the observed IET dynamics, we prepared three porphyrin-sensitized TiO2thin-film samples with initial
concentrations 37 (Film 1), 73 (Film 2), and 150µM (Film 3) of porphyrin solutions.
2.3. Steady-State Spectral Measurements. UV/visible ab-sorption spectra of ZnCAPEBPP in solution and in solid thin films were recorded with a standard spectrophotometer (Cary 50, Varian). Emission spectra were measured with a composite CCD spectrometer (USB2000FLG, Ocean Optics) via a Y-shape fiber (R600-UV, Ocean Optics) for front-face probes. The excitation source contains a pulsed diode-laser head
(LDH-P-C-440, PicoQuant) coupled with a laser-diode driver (PDL-800B, PicoQuant) that produces excitation pulses at 435 nm with an average power of∼300 µW.
2.4. Time-Resolved Fluorescence Measurements. Figure 2 shows the experimental setup for femtosecond (fs) time-resolved fluorescence measurements. Basically, a fluorescence optically gated (up-conversion) system (FOG100, CDP) is implemented in combination with a mode-locked Ti-sapphire laser (Mira 900D, Coherent) pumped with a 10-W Nd:YVO4laser
(Verdi-V10, Coherent). The femtosecond laser system generates output pulses at 860 nm (or 840 nm) with duration ∼120 fs at a repetition rate of 76 MHz. The frequency of the laser pulse was doubled for excitation (λex ) 430 or 420 nm). The residual
fundamental pulse was used as an optical gate; a dichroic beam splitter served to separate excitation and gate beams. The excitation beam intensity was appropriately attenuated, and then focused onto a 1-mm rotating cell containing either the solution or the solid thin-film samples. The fs system includes two optical paths for excitation: path one is designed for measurements of thin-film samples via collection of emission from the front face; path two is designed for measurements of solution samples via collection of emission from the back face.32The emission was
collected with two parabolic mirrors and focused onto a crystal (BBO type-I); the gate pulse was also focused on that BBO crystal for sum-frequency generation. The latter signal was collected with a lens, and separated from interference light with an iris, a band-pass filter, and a double monochromator (DH10, Jobin Yvon) in combination, then detected with a photomulti-plier (R1527P, Hamamatsu) connected to a computer-controlled photon-counting system. On varying the temporal delay between gate and excitation pulses via a stepping-motor translational stage, we obtained a temporal profile (transient). The polariza-tion between pump and probe pulses was fixed at the magic-angle condition, 54.7°.
2.5. Data Analysis and Kinetic Model. The fluorescence transient signal, I(t), was fitted through convolution of the instrument-response function g(t) with an appropriate molecular-response function f(t),33,34
in which g(t) is a Gaussian function; the choice of f(t) relies on a proper kinetic model. When a rising feature appears in the transients, a consecutive kinetic model is employed to fit Figure 1. SEM photomicrographs of an unsensitized TiO2film. The
average size of particles is∼15 nm; the thickness of the film is ∼2
µm.
Figure 2. Femtosecond fluorescence up-conversion spectrometer setup: A, aperture or iris; BS1-BS3, beam splitters; F1-F2, color filters; L1-L4, focusing lenses; M1-M6, broadband dielectric mirrors; NC, nonlinear crystal; P1-P2, parabolic mirrors; RS, rotary sample cell; PMT, photomultiplier tube; SHG, optical set for second harmonic generation.
I(t) )
∫
0
∞
appropriately the transients,
in which component A is described with a single-exponential function with a decay coefficient τ1 and component B is
described with a biexponential function with a rise coefficient τ1and a decay coefficientτ2. The molecular response function f(t) is expressed accordingly as
in which the preexponential factors a and b represent the relative weights (or amplitudes) of components A and B, respectively. Alternatively, a parallel kinetic model is employed to account for the observed temporal profiles showing a biphasic dynamical feature
in which components A and A′ are described with a single-exponential function and decay coefficientsτ1andτ2,
respec-tively. The molecular response function f(t) is expressed accordingly as
in which the preexponential factors a and b represent the relative weights (or amplitudes) of components A and A′, respectively. 3. Results and Discussion
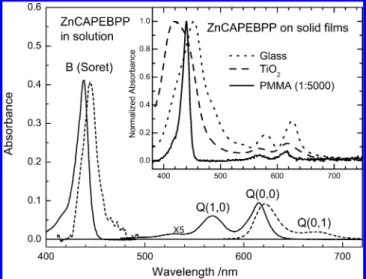
3.1. Steady-State Spectra of ZnCAPEBPP in Various Environments. Figure 3 shows the UV/visible absorption (solid curves) and fluorescence (dashed curves) spectra of Zn-CAPEBPP in THF solution; the inset shows the normalized
coated on a plate-glass substrate as a thin film or on a TiO2
-nanocrystalline thin film, shown as a dotted curve or dashed curve in the inset of Figure 3, respectively. Furthermore, the absorption maxima of the molecule on a glass film are red-shifted with respect to those in solution, indicating that the head-to-tail (J-type) aggregation might be involved upon formation of porphyrin aggregates in films. In contrast, the Soret band of the TiO2film is shifted toward the blue side of the spectrum,
indicating that formation of porphyrin aggregates inside the nanoenvironment of a TiO2thin film is mainly of H type. When
the porphyrin molecules were evenly distributed within a PMMA matrix, the aggregation effect was minimized and the absorption spectrum of a PMMA film (solid curve shown in the inset of Figure 3) is identical with that of solution. To improve our understanding of the effects of aggregation and interfacial energy transfer between porphyrins and TiO2
nano-particles, we performed a time-resolved investigation on Zn-CAPEBPP in the above environments using a femtosecond fluorescence up-conversion method.
3.2. Relaxation Dynamics of ZnCAPEBPP in Solution. Porphyrin molecules behave as if effectively separate in THF solvent.35Therefore, time-resolved spectral data in ZnCAPEBPP/
THF solution provide pertinent information about the dynamical behavior of porphyrin monomers in free solvents. Figure 4A shows three fluorescence transients of a ZnCAPEBPP/THF solution with excitation atλex) 420 nm and emission observed
atλem) 470, 620, and 675 nm. The transient at λem) 470 nm
(circles) is well fitted with a single-exponential decay function with a decay coefficient τ ) 910 ( 10 fs; the uncertainty represents two standard errors. The transients observed atλem ) 620 (squares) and 675 nm (triangles) differ remarkably from the transient observed atλem ) 470 nm: the former show a
rising feature with a rise coefficient comparable to the decay coefficient of the latter in the short-time region; the transient signals of the former increase gradually to an asymptotic level in the long-time region, as shown in parts B and C of Figure 4 for λem ) 620 and 675 nm, respectively. According to the
steady-state spectral measurements shown in Figure 3, the transients observed at λem ) 470 and 620 nm (and 675 nm)
reflect the dynamical behavior occurring in the S2 and S1
electronic states, respectively. We therefore conclude that the S2f S1internal conversion of ZnCAPEBPP in solution takes ∼1 ps and the vibrationally hot S1species are produced on that
time scale.
Because of the rising character of the transients shown in Figure 4, the transients observed atλem) 620 and 675 nm are
described satisfactorily according to a consecutive kinetic model with two components convoluted with the laser pulse: the first component (olive curves) rises inτ1) 910 fs and then decays
inτ2∼ 9 ps whereas the second component (magenta curves)
appears following the decay of the first component but persists
Figure 3. Absorption (solid curves) and fluorescence (dashed curves)
spectra of ZnCAPEBPP in THF with B (Soret) and Q bands (enlarged by a factor 5) as indicated. The sample concentration was 5× 10⁻⁶ M. The inset shows relative absorption spectra of ZnCAPEBPP deposited as a pure film on a glass substrate (dotted curve) mixed with PMMA (1:5000) to form a uniform thin film on a glass substrate (solid curve) and sensitized on a nanocrystalline TiO2thin film (dashed curve).
The absorbance of each spectrum in the inset is normalized at the maximum of the S2band for comparison.
A98 τ1 B98 τ2 C (2) f(t) ) a exp
(
- t τ1)
+ b[
exp(
- t τ2)
- exp(
- t τ1)
]
(3) A98 τ1 B (4) A′98 τ2 B′ (5) f(t) ) a exp(
- t τ1)
+ b exp(
- tτ2)
(6)on the observed 100-ps scale (τ3 ∼ 2 ns). As the transients
observed atλem ) 620 and 675 nm represent the relaxation
dynamics of ZnCAPEBPP in the S1 state, the observed two
consecutive components might be assigned to the hot and cold S1species, respectively. Accordingly, the hot S1species were
produced from the S2state in∼1 ps. The excess vibrational
energy in the hot S1species is released to the solvent molecules
via vibrational relaxation, and this process yields the cold S1
species being produced in ∼9 ps. The cold S1 species are
relatively enduring because S1 f T1 intersystem crossing of
ZnCAPEBPP in solution occurs in∼2 ns, as is confirmed by our ps measurements. Our real-time observation on the Zn-CAPEBPP system is consistent with femtosecond results for the zinc tetraphenylporphyrin (ZnTPP) system, for which the lifetime of the S2state of ZnTPP is reported to be in a range
1.45-2.35 ps, and vibrational cooling from the nonrelaxed vibronic state of the hot S1species takes place on a time scale
of∼10 ps.36-38
3.3. Relaxation Dynamics of ZnCAPEBPP/PMMA Solid Films. When the ZnCAPEBPP molecules are evenly mixed with PMMA on a solid film, the observed fluorescence transients are similar to those in a homogeneous liquid solution. Figure 5A shows the corresponding transients of a ZnCAPEBPP/ PMMA film with excitation performed atλex ) 420 nm and
emissions observed atλem) 460, 620, and 680 nm. The transient
at 460 nm was fitted with two components: the major part of the transient decays in 690 ( 20 fs but there exists a minor offset component that is persistent on a 10-ps scale. The transients observed at both 620 and 680 nm exhibit a rising feature that is comparable to the decay of the transient observed at 460 nm. According to the same fitting procedure employed for the solution data aforementioned, both transients were fitted according to a consecutive kinetic model with the corresponding
time coefficientsτ1,τ2, andτ3evaluated to be 690 fs, 12 ps,
and ∼2 ns, respectively. Our assignment for the observed excited-state dynamics of a ZnCAPEBPP/PMMA film is similar to the case in THF solution: the observed relaxation timeτ1)
690 fs is due to efficient S2 f S1 IC; the observed 12-ps
component represents energy transfer from the hot S1species
to the PMMA environment; the offset component (τ3∼ 2 ns)
is due to S1f T1ISC from the cold S1species.
The observed relaxation periodτ1) 690 fs in the transient
of the ZnCAPEBPP/PMMA film is similar to that in THF solution (τ1) 910 fs). The former at λem) 460 nm involves,
however, an “offset” component that is completely absent in the solution sample (Figure 5A vs Figure 4A), implying that some ZnCAPEBPP molecules in the PMMA film do not undergo S2 f S1 IC to the S1 state, probably due to the
restriction of nuclear motions in the solid state. The observation of a dominating fast-decay component in the transient indicates that the S2f S1IC is still a major process to be considered for
ZnCAPEBPP isolated inside the PMMA matrix. Because large-amplitude nuclear motions of porphyrin molecules are restricted in the solid state whereas motions are relatively free in liquid solution, we expect that the observed offset signal in the former is due to the contribution of intramolecular motions constrained in the PMMA matrix that impedes the S2f S1IC. We speculate
that the in-plane expansion and compression motions of the porphyrin ring might be involved for such an efficient electronic relaxation to occur.
As mentioned earlier, the hot S1species were produced after
IC from the S2state. In solution, the excess vibrational energy
of ZnCAPEBPP in the S1state would be carried away in∼9
ps by the solvent molecules (Figure 4B,C). For the PMMA film, Figure 4. Femtosecond fluorescence transients of ZnCAPEBPP in THF
solution (1× 10⁻⁵M) obtained atλem/nm ) (A) 470 (open circles),
(B) 620 (open squares), and (C) 675 (open triangles), with excitation atλex) 420 nm for λem) 470 nm and λex) 430 nm for λem) 620
and 675 nm. Open symbols denote raw data; solid black curves represent theoretical fits with residuals shown as green traces; the olive and magenta curves under each transient are deconvoluted components.
Figure 5. Femtosecond fluorescence transients of ZnCAPEBPP mixed
with PMMA and spin-coated on a glass substrate obtained atλex)
420 or 430 nm with fluorescence probed atλem/nm ) (A) 460 (open
circles), (B) 620 (open squares), and (C) 675 (open triangles). Excitation was performed atλex) 420 nm for λem) 460 nm and λex) 430 nm
forλem) 620 and 680 nm. Open symbols denote raw data; solid black
curves represent theoretical fits with residuals shown as green traces; the olive and magenta curves under each transient are deconvoluted components.
we observed that the vibrationally hot S1species transfer their
excess internal energy into the surrounding PMMA in∼12 ps (Figure 5B,C). The similarity for the UV/visible spectra and the relaxation dynamics between the PMMA film and the solution sample indicates that the ZnCAPEBPP molecules were perfectly isolated inside the PMMA matrix in the solid state and that intermolecular interactions between porphyrin mol-ecules become negligible.
3.4. Relaxation Dynamics of Pure ZnCAPEBPP Solid Films. When pure ZnCAPEBPP molecules were spin-coated as a thin film on a glass substrate without mixing with PMMA, two peculiar spectral features appear. First, the absorption bands of the sold film become broadened and the maxima are red-shifted as mentioned above (Figure 3). Second, the ZnCAPEBPP film shows no appreciable emission with use of a conventional spectrofluorometer, i.e., aggregation between porphyrins would produce strong intermolecular interactions, which would cause significant fluorescence quenching. Figure 6 shows the fluo-rescence transient of a ZnCAPEBPP film recorded atλex) 420
nm and λem ) 470 nm. The transient exhibits a spike-like
temporal profile with the decay coefficient indeterminate because of limited time resolution of the instrument (τ <100 fs). That is, the S2f S1IC process of ZnCAPEBPP becomes
extremely rapid when the porphyrin molecules stack together to form aggregates on a plate-glass substrate and the hot S1
species are produced within that time scale (<100 fs). To probe the S1dynamics of the ZnCAPEBPP thin film, the detection
window must move to the longer wavelength region.
As our instrument cannot resolve the decay coefficient of the transient atλem) 470 nm, we observed no rising character
of transients taken atλem) 620, 640, 660, and 680 nm, as shown
from top to bottom in Figure 7, parts A-D, respectively. The transients shown in Figure 7 display a biexponential decay feature, which was fitted with two components: the rapid component decays in 1.9-2.4 ps whereas the slow component decays in 19-26 ps. The ns component was completely absent in all four transients. This evidence is important for us to rationalize quenching of fluorescence from porphyrins upon
aggregation. Because the intermolecular energy transfer between porphyrins is so rapid, the relatively slow S1f T1ISC process
is unlikely to compete, which causes the disappearance of the ns component in the transients and the quenching of the fluorescent intensity.
3.5. Relaxation Dynamics of ZnCAPEBPP on Nanocrys-talline TiO2Films. We investigated the relaxation dynamics of ZnCAPEBPP/TiO2thin films to gain dynamical information
for an understanding of the rate of interfacial electron transfer between porphyrin and a nanocrystalline semiconductor film. From results discussed in section 3.4, we understand that aggregation of porphyrins plays an important role in the observed relaxation dynamics. As a result, we prepared thin-film samples by controlling the initial immersion concentration of ZnCAPEBPP solutions to vary the adsorbed molecular density on three identical nanocrystalline TiO2films. Figure 8
shows absorption spectra of ZnCAPEBPP/TiO2thin-film samples
from top to bottom with decreasing absorbance of the Q bands, i.e., ZnCAPEBPP is more concentrated on Film 3 but it is less condensed on Film 1. Note that the shapes and the positions of the Q bands shown in Figure 8 are very similar irrespective of their large discrepancies in optical density. This might indicate that there are no significant differences in the degree of aggregation for the samples with different optical densities, as was previously observed by Kamat and co-workers for cresyl violet dye adsorbed on metal oxide surfaces.39However, in our
case the formation of H-aggregates of porphyrins on TiO2
surfaces was very sensitive to the shape and position of the Soret band but it has very little influence for the Q bands (Figure 3). Therefore, the degree of aggregation might be different as the optical densities of ZnCAPEBPP on TiO2 films were
Figure 6. Femtosecond fluorescence transients of ZnCAPEBPP as a
pure solid film on a glass substrate (open circles) obtained atλex)
420 nm with fluorescence probed atλem) 470 nm (fwhm ) 200 fs).
The solid curve is the theoretical fit with residuals shown in the lower panel. The dashed curve shows a theoretical fit of the transient of a ZnCAPEBPP/PMMA film for comparison.
Figure 7. Femtosecond fluorescence transients of ZnCAPEBPP as a
pure solid film on a glass substrate (open circles) obtained atλex)
430 nm with fluorescence probed atλem/nm ) (A) 620, (B) 640, (C)
660, and (D) 680. Solid black curves represent theoretical fits with residuals shown as green traces; the blue and olive curves under each transient are deconvoluted components.
increased by a factor of 4; the corresponding dynamics will be discussed in the following.
Figure 9 shows the S2dynamics of a ZnCAPEBPP/TiO2film;
the spike-like transient signal of the ZnCAPEBPP-sensitized TiO2film was observed atλex) 420 nm and λem) 470 nm
and no transient signal was observed for the unsensitized TiO2
film (dashed curve shown in Figure 9). This dynamical feature is similar to that of ZnCAPEBPP thin-film samples that involved no TiO2 nanoparticles: the observed ultrarapid relaxation
dynamics (<100 fs) reflect not only the aggregate-induced energy transfer among porphyrins but also the interfacial electron transfer from porphyrin to TiO2. The limited temporal resolution
of our instrument precluded resolution of the IET dynamics from the transient.
The relaxation dynamics of ZnCAPEBPP-sensitized TiO2
films occurring in the S1state of porphyrin were studied with
excitation at λex ) 430 nm and detection in the emission
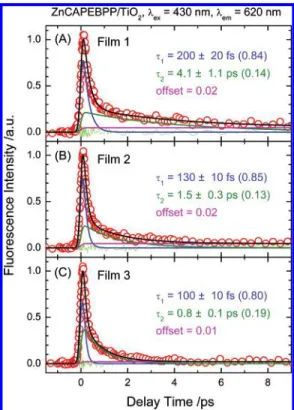
wavelength region 600-700 nm. Figure 10A-C displays in
three parts the fluorescence transients of Film 1-Film 3 atλem ) 620 nm; Figure 11A-C shows the fluorescence transients of Film 1-Film 3 atλem) 680 nm. All transients were fitted
with two decay components with a tiny offset. Atλem) 620
nm, the rapid-decay coefficientτ1was observed to be 200 (
20 fs in Film 1 but decreased to 130 ( 10 fs in Film 2 and further to 100 ( 10 fs in Film 3; the slow-decay coefficientτ2
decreased significantly from 4.1 ( 1.1 ps in Film 1 to 0.8 ( 0.1 ps in Film 3; atλem) 680 nm, τ1is almost constant (∼300
fs) for Film 1-Film 3 whereasτ2decreased from 3.7 ( 0.7 ps
in Film 1 to 1.9 ( 0.6 ps in Film 3. The above real-time observations indicate three major points. First, due to the effect of aggregation, the S2f S1IC was still ultrarapid because we
observed no rising character from all transients shown in Figures 10 and 11. Second, the values of τ1 in the
ZnCAPEBPP-sensitized TiO2 films are less than one tenth those of
Zn-CAPEBPP solid films (Figure 7), indicating that relaxation of the former is much more efficient than that of the latter; values ofτ2 in the former are comparable to the values ofτ1in the
latter. This comparison implies that one must consider the effect of aggregation of porphyrin to account for the observed slow relaxation dynamics of the former via intermolecular energy transfer.26,33,40,41
Third, although the slow relaxation coefficientτ2decreased
significantly from the sample condition varying from small density (Film 1, OD ) 0.2) to larger density (Film 3, OD ) 0.8), the rapid decay periods are generally less sensitive (atλem ) 620 nm) or insensitive (at λem) 680 nm) to the large variation
of molecular density on the TiO2surface. The trend of variation
of bothτ1 andτ2values at λem) 620 nm is consistent with
involvement of an efficient energy transfer among isoenergetic porphyrin pigments: the fs component (τ1) results from both
Figure 8. Absorption spectra of ZnCAPEBPP-sensitized TiO2films
immersed in THF/CH2Cl2(1:14) co-solvents at three concentrations
of ZnCAPEBPP: 3.7× 10⁻⁵M (Film 1); 7.3× 10⁻⁵M (Film 2); and 1.5× 10⁻⁴M (Film 3). The immersion duration is 4 h for all three TiO2films.
Figure 9. Femtosecond fluorescence transients of a
ZnCAPEBPP-sensitized TiO2 film (open circles) and an unsensitized TiO2 film
(dashed curves) obtained atλex) 420 nm with fluorescence probed at
λem) 470 nm (fwhm ) 200 fs). The solid curve is the theoretical fit
with residuals shown in the lower panel.
Figure 10. Femtosecond fluorescence transients of
ZnCAPEBPP-sensitized TiO2films under three conditions: (A) Film 1, (B) Film 2,
and (C) Film 3, obtained atλex) 430 nm with fluorescence probed at
λem) 620 nm (fwhm ) 220 fs). All transients are fitted with a parallel
model with a small offset as indicated. Open circles denote raw data; solid black curves represent theoretical fits with residuals shown as green traces; the blue, olive and magenta curves under each transient are deconvoluted components.
forward IET and energy transfer at smaller intermolecular distance whereas the ps component (τ2) arose mainly from
energy transfer at a larger distance. Atλem) 680 nm, resonance
energy transfer in porphyrin aggregates is less efficient and occurs on a ps time scale to affect only the ps dynamics. The invariance ofτ1values observed in all three sample conditions
indicates that the fs component is due not to aggregation but to interfacial electron transfer between ZnCAPEBPP and TiO2
nanostructure.42
Tachibana et al.19studied the electron-injection kinetics for
a zinc porphyrin dye (ZnTCPP) sensitized on TiO2films using
fs transient absorption; they found that adsorption of the porphyrin dye on TiO2 films results in quenching of the
stimulated emission that produces three relaxations on the time scales <100 fs,∼1 ps, and ∼10 ps. As the optical density of a ZnTCPP-sensitized TiO2film (OD∼0.3) is similar to that of
our low-density sample (OD ∼0.2 in Film 1), the observed relaxation dynamics might be comparable. We seem to observe that electron injection from ZnCAPEBPP to TiO2at 680 nm is
much slower than that from ZnTCPP to TiO2: τ1∼290 fs (76%)
vs <100 fs (37%);τ2∼4 ps (19%) vs ∼1 ps (12%) and ∼10
ps (51%). A small offset seems to be common to both cases. The amplitude of the fs component in our case is much larger than that of Tachibana et al., which might be due to the internal energy available from different excitations: the excitation of the former occurs in the S2state (λex) 430 nm), whereas the
excitation of the latter takes place in the S1state (λex) 560
nm). We have shown that S2 f S1 electronic relaxation is
ultrarapid, which would result in substantial amounts of hot S1
species being produced in the former case. This condition is consistent with our results that the relaxation dynamics observed at 620 nm are much more rapid than those observed at 680 nm
carboxylate groups in porphyrin: there are four carboxylate groups in ZnTCPP but there is only one in ZnCAPEBPP. Hence, when ZnTCPP molecules are excited to the S1state,
excited-state populations to a certain proportion (37%) undergo direct electron injection into the conducting band of TiO2within 100
fs; the other populations might be trapped in the excited state and undergo much slower relaxation via either indirect electron transfer or intermolecular energy transfer if aggregation is taken into account. For ZnCAPEBPP, there is only one-fourth the possibility for the S1species to undergo direct electron injection;
hence this ultrarapid direct IET process (τ < 100 fs) is minor and unresolvable in our experiments. As a result, we assign the 300-fs relaxation period observed at 680 nm to be due to the majority of excited-state population (76%) undergoing indirect IET: the excited electrons in ZnCAPEBPP might be initially trapped in the porphine ring and seek an entrance to the electron-transfer bridge for indirect IET to occur. Because the phenyl-ethynyl group in ZnCAPEBPP is apparently better as an electron-transfer bridge than the phenyl group in ZnTCPP, we expect that searching for the entrance of the bridge is a bottleneck for the slower dynamics observed for the former. Therefore, to be consistent with the assignment of the dynamics, the observed ∼300-fs relaxation period in the ZnCAPEBPP/ TiO2 system might be compared with the ∼1-ps relaxation
period in the ZnTCPP/ TiO2system for the indirect IET process
and the∼4-ps relaxation period of the former to be compared with the∼10-ps relaxation period of the latter for intermolecular energy transfer among porphyrins.
On the basis of the ultrarapid nature of the S2 f S1 IC
observed for ZnCAPEBPP/TiO2films, we expect aggregation
to be significant. Important dynamical evidence related to the aggregation that occurs in the S1 state is discussed in the
following. Atλem) 620 nm (Figure 10), the relative amplitude
of the ps component increases from 14% in Film 1 to 19% in Film 3; atλem) 680 nm (Figure 11), the relative amplitude of
the ps component increases from 19% in Film 1 to 22% in Film 3. Moreover, the offset component becomes more pronounced in Film 1 than in Film 3. These observations indicate that the increased adsorption of porphyrin molecules on TiO2 films
enhances the contribution of the ps component. Hence both interfacial electron transfer and intermolecular energy transfer processes compete: when aggregation is less significant as in Film 1, the contribution of the fs component (due to the IET process) and the offset component (due to the monomer) would become more pronounced, and vice versa. Due to the red-shift spectral nature of aggregation in emission, we expect that the ps component would be more significant for transients observed at greater emission wavelengths; the relative amplitudes of the ps component observed atλem) 680 nm (Figure 11) are indeed
larger than those observed at λem ) 620 nm (Figure 10).
Therefore, it supports the assignment of the observed slower Figure 11. Femtosecond fluorescence transients of
ZnCAPEBPP-sensitized TiO2films under three conditions: (A) Film 1, (B) Film 2,
and (C) Film 3, obtained atλex) 430 nm with fluorescence probed at
λem) 680 nm (fwhm ) 220 fs). All transients are fitted with a parallel
model with a small offset as indicated. Open circles denote raw data; solid black curves represent theoretical fits with residuals shown as green traces; the blue, olive and magenta curves under each transient are deconvoluted components.
ps-relaxation dynamics in ZnCAPEBPP-sensitized TiO2films
being due mainly to intermolecular energy transfer via aggrega-tion. The observed 1-4 ps aggregate-induced relaxation periods in ZnCAPEBPP-sensitized TiO2films are similar to those of
the rapid relaxation in pure ZnCAPEBPP solid films (∼2 ps) but the slow-decay component (∼20 ps) of the latter is absent from the former. We think that this situation reflects aggregation of separate types: H-type aggregation is dominant in the former case whereas J-type aggregation prevails in the latter case. 4. Conclusion
Forward interfacial electron-transfer dynamics of a synthetic porphyrin sensitizer adsorbed on nanocrystalline TiO2films have
been investigated by using femtosecond fluorescence up-conversion with S2excitation. The S2f S1electronic relaxation
was found to be ultrarapid (<100 fs) because of aggregation of porphyrin molecules. The observed fluorescence transients in the S1state show a biphasic dynamical feature with two distinct
time scales. Depending on the detection window, the rapid component decayed with τ1 ) 100-300 fs and the slow
component withτ2) 0.8-4.1 ps. The fs component is assigned
to indirect IET through a phenylethynyl bridge attached to one of four meso positions of the porphyrin ring. By means of a systematic variation ofτ2as a function of molecular density on
a TiO2 surface, the ps component arose from intermolecular
energy transfer among porphyrins. This evidence supports recent fs transient absorption results for ruthenium-complex-sensitized TiO2films in that the ps component was found to be due to the
dye in an aggregated state.18The results obtained from
time-resolved investigations of porphyrin in solution, directly de-posited on solid films, and mixed with PMMA on solid films have also demonstrated the significance of aggregation affecting the observed relaxation dynamics in the solid phase.
Acknowledgment. We thank Dr. M. C. Lin for many helpful discussions and acknowledge financial support from the National Science Council of the Republic of China (project contracts 2113-M-009-016 and 2120-M-009-014 for E.W.G.D. and 94-2113-M-260-005 for C.Y.L.).
References and Notes
(1) (a) Hagfeldt, A.; Gra¨tzel, M. Chem. ReV. 1995, 95, 49-68. (b) Hagfeldt, A.; Gra¨tzel, M. Acc. Chem. Res. 2000, 33, 269-277.
(2) Kalyanasundaram, K.; Gra¨tzel, M. Coord. Chem. ReV. 1998, 77, 374-414.
(3) Gra¨tzel, M.; Nature 2001, 414, 338-344.
(4) Tachibana, Y.; Moser, J. E.; Gra¨tzel, M.; Klug, D. R.; Durrant, J. R. J. Phys. Chem. 1996, 100, 20056-20062.
(5) (a) Asbury, J. B.; Ellingson, R. J.; Ghosh, H. N.; Ferrere, S.; Nozik, A. J.; Lian, T. J. Phys. Chem. B 1999, 103, 3110-3119. (b) Wang, Y.; Asbury, J. B.; Lian, T. J. Phys. Chem. A 2000, 104, 4291-4299. (c) Asbury, J. B.; Hao, E.; Wang, Y.; Lian, T J. Phys. Chem. B 2000, 104, 11957-11964. (d) Asbury, J. B.; Hao, E.; Wang, Y.; Ghosh, H. N.; Hirendra, N. G.; Lian, T. J. Phys. Chem. B 2001, 105, 4545-4557. (e) Asbury, J. B.; Anderson N. A.; Hao, E.; Ai, X.; Lian, T J. Phys. Chem. B 2003, 107, 7376-7386.
(6) (a) Anderson N. A.; Ai, X.; Lian, T J. Phys. Chem. B 2003, 107, 14414-14421. (b) Ai, X.; Guo, J.; Anderson N. A.; Lian, T J. Phys. Chem. B 2004, 108, 12795-12803.
(7) (a) Benko¨, G.; Kallioninen, J.; Korppi-Tommola, J. E. I.; Yartsev, A. P.; Sundstro¨m, V. J. Am. Chem. Soc. 2002, 124, 489-493. (b) Kallioninen, J.; Benko¨, G.; Sundstro¨m, V.; Korppi-Tommola, J. E. I.; Yartsev, A. P. J. Phys. Chem. B 2002, 106, 4396-4404. (c) Pan, J.; Benko¨, G.; Xu, Y.; Poscher, T.; Sun, L.; Sundstro¨m, V.; Polı´vka, T. J. Am. Chem. Soc. 2002, 124, 13949-13957. (d) Benko¨, G.; Myllyperkio¨, P.; Pan, J.; Yartsev, A. P.; Sundstro¨m, V. J. Am. Chem. Soc. 2003, 125, 1118-1119. (e) Benko¨, G.; Kallioninen, J.; Myllyperkio¨, P.; Trif, F.; Korppi-Tommola, J. E. I.; Yartsev, A. P.; Sundstro¨m, V. J. Phys. Chem. B 2004, 108,
2862-2867. (f) Kallioninen, J.; Benko¨, G.; Myllyperkio¨, P.; Khriachtchev, L.; Skårman, B.; Wallenberg, R.; Tuomikoski, M.; Korppi-Tommola, J.; Sundstro¨m, V.; Yartsev, A. P. J. Phys. Chem. B 2004, 108, 6365-6373. (g) Pan, J.; Xu, Y.; Sun, L.; Sundstro¨m, V.; Polı´vka, T. J. Am. Chem. Soc.
2004, 126, 3066-3067. (h) Pan, J.; Xu, Y.; Benko¨, G.; Feyziyev, Y.; Styring,
S.; Sun, L.; Akermark, B.; Yartsev, A. P.; Sundstro¨m, V. J. Phys. Chem. B
2004, 108, 12904-12910.
(8) Kuciauskas, D.; Monat, J. E.; Villahermosa, R.; Gray, H. B.; Lewis, N. S.; McCusker, J. K. J. Phys. Chem. B 2002, 106, 9347-9358.
(9) Rehm, J. M.; McLendon, G. L.; Nagasawa, Y.; Yoshihara, K.; Moser, J.; Gra¨tzel, M. J. Phys. Chem. 1996, 100, 9577-9578.
(10) Cherepy, N. J.; Smestad, G. P.; Gra¨tzel, M.; Zhang, J. Z. J. Phys. Chem. B 1997, 101, 9342-9351.
(11) Martini, I.; Hodak, J. H.; Hartland, G. V. J. Phys. Chem. B 1998, 102, 9508-9517.
(12) Hilgendorff, M.; Sundstro¨m, V. J. Phys. Chem. B 1998, 102, 10505-10514.
(13) Huber, R.; Moser, J.-E.; Gra¨tzel, M.; Wachtveitl, J. J. Phys. Chem. B 2002, 106, 6494-6499.
(14) Pelet, S.; Gra¨tzel, M.; Moser, J.-E. J. Phys. Chem. B 2003, 107, 3215-3224.
(15) Biju, V.; Micic, M.; Hu, D.; Lu, H. P. J. Am. Chem. Soc. 2004, 126, 9374-9381.
(16) Ramakrishna, G.; Singh A. K.; Palit, D. K.; Ghosh, H. N. J. Phys. Chem. B 2004, 108, 4775-4783.
(17) Xiang, J.; Rondonuwu, F. S.; Kakitani, Y.; Fujii, R.; Watanabe, Y.; Koyama, Y.; Nagae, H.; Yamano, Y.; Ito, M. J. Phys. Chem. B 2005, 109, 17066-17077.
(18) Wenger, B.; Gra¨tzel, M.; Moser, J.-E. J. Am. Chem. Soc. 2005, 127, 12150-12151.
(19) Tachibana, Y.; Haque, S. A.; Mercer, I. P.; Durrant, J. T.; Klug, D. R. J. Phys. Chem. B 2000, 104, 1198-1205.
(20) Kalyanasundaram, K.; Vlachopoulos, N.; Krishnan, V.; Monnier, A.; Gra¨tzel, M. J. Phys. Chem. 1987, 91, 2342-2347.
(21) Koehorst, R. B. M.; Boschloo, G. K.; Savenije, T. J.; Goossens, A.; Schaafsma, T. J. J. Phys. Chem. B 2000, 104, 2371-2377.
(22) Cherian, S.; Wamser, C. C. J. Phys. Chem. B 2000, 104, 3624-3629.
(23) Viseu, T. M. R.; Hungerford, G.; Ferreira, M. I. C. J. Phys. Chem. B 2002, 106, 1853-1861.
(24) Noguera, A. F.; Furtado, L. F. O.; Nakamura, M.; Araki, K.; Toma, H. E. Inorg. Chem. 2004, 43, 396-398.
(25) Balzani, L.; Credi, A.; Venturi, M. Molecular DeVices and Machines; Wiley-VCH: Weinheim, Germany, 2003; and related references therein.
(26) (a) Kim, D.; Osuka, A.J. Phys. Chem. A 2003, 107, 8791-8816. (b) Kim, D.; Osuka, A. Acc. Chem. Res. 2004, 37, 735-745. (c) Hwang, I.-W.; Aratani, N.; Osuka, A.; Kim, D. Bull Korean Chem. Soc. 2005, 26, 1-13.
(27) Hasobe, T.; Kamat, P. V.; Troiani, V.; Solladie´, N.; Ahn, T. K.; Kim, S. K.; Kim, D.; Kongkanand, A.; Kuwabata, S.; Fukuzumi, S. J. Phys. Chem. B 2005, 109, 19-23.
(28) Holten, D.; Bocian, D. F.; Lindsey, J. S. Acc. Chem. Res. 2002, 35, 57-69.
(29) (a) Sonogashira, K.; Tohda, Y.; Hagihara, N. Tetrahedron Lett.
1975, 4467-4470. (b) Takahashi, S.; Kuroyama, Y.; Sonogashira, K.
Synthesis 1980, 627-630.
(30) Perrin, D. D.; Armarego, W. L. F. Purification of laboratory chemicals, 3rd ed.; Pergamon Press: Oxford, UK, 1988.
(31) Barbe, C. J.; Arendse, F.; Comte, P.; Jirousek, M.; Lenzmann, F.; Shklover, V.; Gra¨tzel, M. J. Am. Ceram. Soc. 1997, 80, 3157.
(32) (a) Lu, Y.-C.; Chang, C.-W.; Diau, E. W.-G. J. Chin. Chem. Soc.
2002, 49, 693-701. (b) Lu, Y. C.; Diau, E. W.-G.; Rau, H. J. Phys. Chem.
A 2005, 109, 2090-2099.
(33) Valeur, B. Molecular Fluorescence; Wiley-VCH: Weinheim, Germany, 2002; Chapter 6, and other related references therein.
(34) Pedersen S.; Zewail, A. H. Mol. Phys. 1996, 89, 1455-1502. (35) (a) Campbell, W. M.; Burrell, A. K.; Officer, D. L.; Jolley, K. W. Coord. Chem. ReV. 2004, 248, 1363-1379. (b) Nappa, M.; Valentine, J. S. J. Am. Chem. Soc. 1978, 100, 5075-5080.
(36) Gurzadyan, G. G.; Tran-Thi, T.-H.; Gustavsson, T. J. Chem. Phys.
1998, 108, 385-388.
(37) Mataga, N.; Shibata, Y.; Chosrowjan, H.; Yoshida, N.; Osuka, A. J. Phys. Chem. B 2000, 104, 4001-4004.
(38) Yu, H.; Baskin, J. S.; Zewail, A. H. J. Phys. Chem. A 2002, 106, 9845-9854.
(39) (a) Liu, D.; Kamat, P. V. J. Chem. Phys. 1996, 105, 965-970. (b) Martini, I.; Hartland, G. V.; Kamat, P. V. J. Phys. Chem. B 1997, 101, 4826-4830.
(40) Rubtsov, I. V.; Kobuke, Y.; Miyaji, H.; Yoshihara, K. Chem. Phys. Lett. 1999, 308, 323-328.