For Peer Review
Information Asymmetry and Performance Tilting in Hospitals: A National Empirical Study
Journal: Health Economics Manuscript ID: HEC-10-0085.R1 Wiley - Manuscript type: Research Article
Keywords: Information asymmetry, Asymmetric information, Community orientation, Performance tilting, Medicare profit margin
For Peer Review
Information Asymmetry and Performance Tilting in Hospitals: A National Empirical Study
Objective: To test the performance tilting hypothesis using information asymmetry (IA) within
the community oriented activities of prospective payment system (PPS) hospitals.
Data Sources: American Hospital Association (AHA) Annual Survey Database and Medicare
Cost Report from the Centers for Medicare and Medicaid Services both in fiscal year 2000; Health maintenance organization (HMO) penetration from the Area Resource File.
Study Design: A cross-sectional analysis was performed, using a national sample of 3,162 PPS
hospitals merged from the AHA data set and Medicare profit data. The individual hospital serves as the unit of empirical analysis. General linear model, multiple and logistic regressions are utilized to examine the association between IA and hospital performance indicators.
Principal Findings: A positive relationship between IA and Medicare profit margins was found.
Higher IA was associated with decreased likelihood that the hospital would report having a long-term plan for the health of its host community, and with increased likelihood of performance tilting.
Conclusion: Information asymmetry offers hospitals an advantageous position in achieving profit
maximization. The study also documented the presence of performance tilting by health care management. Whether increased information demands from a society accustomed to significant disclosure will reduce this agency problem is not yet clear.
Author Keywords: Information asymmetry; Asymmetric information; Community orientation; Performance tilting; Medicare profit margin
3 4 5 6 7 8 9 10 11 12 13 14 15 16 17 18 19 20 21 22 23 24 25 26 27 28 29 30 31 32 33 34 35 36 37 38 39 40 41 42 43 44 45 46 47 48 49 50 51 52 53 54 55 56 57 58 59
For Peer Review
INTRODUCTIONInformation Asymmetry in Health Care
Markets for health care services contain significant degrees of asymmetric information and agency relationships (Arrow, 1963; Culyer, 1989; Labelle et al., 1994; Mooney, 1994). One important source of imperfect information is the asymmetry of information that exists between the consumer–user of health care (the patient) and the provider–supplier of that care (the physician or hospital) (O'Neill and Largey, 1998). This asymmetry relates to the user’s inability to accurately assess need for care, or what would constitute appropriate provision for that need relative to the provider. Such asymmetry can give rise to an agency relationship between the provider and purchaser of care where the former acts as the latter’s agent in determining what the purchaser’s demand would be. A failed agency relationship exists when the agent (the health care provider) fails to identify patient’s demands and provide care that reflects the patient’s interests.
Information asymmetry (IA) is sometimes referred to as information inequality, or incomplete, or imperfect information. WHO (World Health Organization, 2001) defined it as the difference in the amount of information available to the various parties to a transaction which does not place them on equal footing to strike a deal. Derived from several additional definitions (Evans, 1984; Nyathi, 2002; WebFinance, 2003), information asymmetry in this paper is
conceptually defined as a phenomenon in which the amount of relative information with regard to health service quality, demand, and cost is unevenly distributed between health care provider and consumer. Three principal types of health and health care related information are
asymmetrically distributed among the three principal parties, providers, insurers and potential patients. They consist of price (provider’s cost) information asymmetry (De Fraja, 2000), quality 3 4 5 6 7 8 9 10 11 12 13 14 15 16 17 18 19 20 21 22 23 24 25 26 27 28 29 30 31 32 33 34 35 36 37 38 39 40 41 42 43 44 45 46 47 48 49 50 51 52 53 54 55 56
For Peer Review
information asymmetry (Jin, 2002; Jin, 2003; Azoulay-Schwartz et al., 2004), and demand information asymmetry (Evans, 1984; O'Neill and Largey, 1998; Chou, 2002).
Pervasive asymmetry of information exists between providers and users of health care as a commodity (Akerlof et al., 2001), in terms of the paradigms of behavioral analysis appropriate to its study, as well as the institutional characteristics which surround its development and delivery. Also, an environment that is technically complex, surrounded by much uncertainty, and which contains information asymmetry enhances the mystique of the medical professional and often leaves the user confused and perplexed (McKee and Healy, 2000).
Nichols (1998) provided three examples of asymmetries as they pertain to health care: between enrollees and insurers, between providers and insurers, and between providers and patients. Based on Nichols’s (1998) and Mooney’s (1994) theories and other similar research findings, a hypothetical model of the interactions involved with the three main participants in the health services market, as well as the relative distributions of information between those
participants, is visualized in Figure 1. In the pictorial model, the head of an arrow indicates the side where most of the information tends to reside and the tail of an arrow indicates
comparatively low related information. For instance, providers tend to withhold service quality and cost information without ascertaining patients’ demands due to high transaction costs. Further, the model implies that asymmetric information distributions among the three
participants of health care services place health service providers in an advantageous position, while putting patients and insurers at a disadvantage. Purchasers of insurance are also unable to ascertain whether the prices charged by insurers for their service (risk re-allocation) are fair. Further, insurers use their market power to extract significant discounts from providers.
Impacts of Information Asymmetry
3 4 5 6 7 8 9 10 11 12 13 14 15 16 17 18 19 20 21 22 23 24 25 26 27 28 29 30 31 32 33 34 35 36 37 38 39 40 41 42 43 44 45 46 47 48 49 50 51 52 53 54 55 56 57 58 59
For Peer Review
Effects of information asymmetry in health care include adverse selection (Basu and Chau, 1999; Frank et al., 2000; Constantiou and Courcoubetis, 2001), moral hazard (Mocan, 2001), market failure (The World Bank Group, 2004), decreased quality of care (Hirth, 1999; Fishman and Simhon, 2000; Albrecht et al., 2002; Chou, 2002), increased utilization (Labelle et al., 1994; Grytten and Sorensen, 2001; Chou, 2002), and organizational structure change
(Hennessy, 1996; Competition Commission, 2000; Tropeano, 2001). The present paper focuses on profit margin and performance tilting; rationales are discussed below.
Asymmetric information may cause increased prices of health services (De Fraja, 2000), because it can bestow market power on the holder of superior information and permit the
charging of monopoly prices. Symmetry of information between market participants is a component of efficient market prices. As information asymmetries increase, more consumers determine that they are being overcharged, increasing the loss of social benefits (Clemons and Thatcher, 1997). Evidence suggests that when product quality is unobservable (quality
information asymmetry exists) before purchase, the equilibrium price may be inefficiently high in order to signal high quality. For example, nonprofit organizations can credibly charge lower prices than for-profit organizations (Chillemi and Gui, 1991). Further detracting from the
information value of price, when the fraction of informed consumers in the market increases, the high-price/low-quality firm type exploits the uninformed by mimicking the high-quality firm’s price, while providing low quality (Albrecht et al., 2002). In another article, McLaren (McLaren, 1999) argued that most forms of advertising, to some degree, rely on information asymmetry. HMOs have been found to reduce the amount of quality information they disclose in competitive markets (Jin, 2003), suggesting that they perceive advantage in information asymmetry. A
theoretical and empirical link among a response to incomplete information and agency problems, 3 4 5 6 7 8 9 10 11 12 13 14 15 16 17 18 19 20 21 22 23 24 25 26 27 28 29 30 31 32 33 34 35 36 37 38 39 40 41 42 43 44 45 46 47 48 49 50 51 52 53 54 55 56
For Peer Review
competition, and ownership had been established for hospital markets (Dranove and White, 1994), for which some support is noted (Ellis and McGuire, 1996).
Community Orientation and Hospitals
The Declaration of Alma-Ata of the 1978 International Conference on Primary Health Care concluded that people throughout the world had very little control over their own health care and that emphasis should be placed on attaining health through a response from the community to their health problems (World Health Organization, 2003). Fourteen states have passed laws, regulations, or guidelines that related to community benefits, which non-profit hospitals are required to document in return for their tax-exempt status (The Access Project, 2005). Some evidence exists that American community hospitals do undertake to reflect
community interests, as well as organizational interests, in their planning. Defining community orientation as the generation, dissemination, and use of information regarding the service area (Proenca et al., 2000), Proenca and colleagues conclude that American hospitals have become more community-oriented as a strategic response to environmental pressures. However, health care providers may still have some level of market power with which to assert their influence on both consumer demand and health service utilization.
Managerial Myopia and Performance Tilting
Myopic behavior refers to forces that lead firms to adopt short-term perspectives; performance tilting, a subject of the present paper, is the intentional favoring of one goal over another. Both may occur when information is imperfectly distributed. Chemmanur and Ravid (1998) developed a model of corporate myopia in which the interaction between asymmetric information and short-term trading by equity holders induces firms to undertake short-term efforts, rather than long-term projects that are intrinsically more valuable. Moreover, managers 3 4 5 6 7 8 9 10 11 12 13 14 15 16 17 18 19 20 21 22 23 24 25 26 27 28 29 30 31 32 33 34 35 36 37 38 39 40 41 42 43 44 45 46 47 48 49 50 51 52 53 54 55 56 57 58 59
For Peer Review
might often be criticized for paying too much attention to a short-term plan when asymmetries in information between shareholder and manager exist (Zeckhauser and Pound, 1990). Other sources of corporate myopia, identified in the accounting, finance, and management literature, include ownership, executive tenure, decision-making horizons, multi-tasking, and compensation schemes and incentives (Holmstrom and Milgrom, 1991; Beldona, 1995; Lambert, 2001;
Eggleston, 2005).
Empirical results suggest that hospital managements may also exhibit myopic behavior, favoring a short-term over a long-term goal. Assessment of community health needs, important for projecting future products, has been found to be less common among for-profit hospitals (Becker and Potter, 2002). Similarly, hospitals with strong out-of-state ties were less likely to report quality and/or cost data to their local communities (Becker and Potter, 2002). In each case, the authors conclude that responsible behaviors are lessened by the profit motive and lack of strong local affiliations.
The concept of performance tilting (Zeckhauser and Pound, 1990) is also relevant to analysis of the management of healthcare institutions. When asymmetries in information
between shareholder and manager exist, a manager or provider intent on demonstrating that he is performing ably will tilt performance by fostering A, an immediate measurable outcome, at the expense of B, a more long-term goal. For example, A might be income; B might be employee training. Performance tilting by management, as well as information asymmetry, may reduce the efficiency and effectiveness of the health services market.
Competitive markets, explicit performance measures, and incentive compensation are hypothesized sources of tilting in industry (Grossman and Hoskisson, 1998; Madorran Garcia and de Val Pardo, 2004). A key question is whether performance tilting is present in the largely 3 4 5 6 7 8 9 10 11 12 13 14 15 16 17 18 19 20 21 22 23 24 25 26 27 28 29 30 31 32 33 34 35 36 37 38 39 40 41 42 43 44 45 46 47 48 49 50 51 52 53 54 55 56
For Peer Review
non-profit hospital sector. The nature of Chief Executive Officer (CEO) position suggests motivation for performance tilting. A survey of hospital CEOs found that the evaluation criteria most frequently reported used in assessing their performance was “allocating financial, physical, and human resources” (93%) (American College of Healthcare Executives, 2002). For nearly all CEOs, performance assessment was reflected in their salary and/or bonus (92%); empirical evidence suggests that poor financial performance is associated with CEO turnover (Eldenburg et al., 2004). Hospital CEO turnover is significant, averaging 14.6% across the 2001-2005 period (Evans, 2006). The median tenure of a hospital CEO is 3.6 years, and between a third and a half of CEO turnover is involuntary (Khaliq et al., 2006). Developing a long-term plan for
community health entails working with community agencies responsible for health data,
collaborating with other providers, meeting with consumers, and other time-consuming activities that offer no immediate return, although these activities may build brand recognition and
community goodwill. Facing the tension between long-term strategy and annual evaluation criteria tied to financial performance, and recognizing the possibility of forced departure, a CEO may focus on maximizing short-term profitability at the expense of a long-term plan for
community health.
Summary
Information asymmetry exists in the provision of health care because of idiosyncrasies in the health care system. Under the uncertainty condition, in which information search is costly, patients, who have difficulty obtaining health service quality and cost information, are in a disadvantageous position. Uninformed patients have to rely on delegating health services to health care providers as their (imperfect) agents. In delivering health care, hospitals may hold or 3 4 5 6 7 8 9 10 11 12 13 14 15 16 17 18 19 20 21 22 23 24 25 26 27 28 29 30 31 32 33 34 35 36 37 38 39 40 41 42 43 44 45 46 47 48 49 50 51 52 53 54 55 56 57 58 59
For Peer Review
conceal their quality and cost information and may not collect and communicate clinical and health information to specify what would constitute appropriate provision for need of care relative to patients, because information sharing and acquisition is a transaction cost in which some hospitals may not choose to invest. Thus, it is likely that information asymmetry provides hospitals with an informational advantage over the consumer and market power to direct the health service and to raise the hospital income by internal management. Because asymmetric information leaves open the possibility of the profit-maximizing (exploitative) provider behavior (Newhouse, 1988; Challen, 2000; Ernst, 2003; Azoulay-Schwartz et al., 2004), the effects of information asymmetry in health care can be observed in higher profit, lack of a long-term plan of improving community health, and performance tilting.
Purpose of the Study
Few previous studies have empirically explored the effects of information asymmetry on hospital performance using national data. The goal of the present study is to identify the
relationships between information asymmetry and three important aspects of hospital
management: hospital profitability, the generation of a long term plans for improving community health, and performance tilting. The first two aspects are linked to agency theory and
transactional cost analysis, and the third to the performance tilting hypothesis. The purposes of this study are:
1. To explore the components, structure, and magnitude of information asymmetry between hospitals and their communities.
2. To differentiate hospitals with high information asymmetry from hospitals with low information asymmetry, and then:
3. To identify the effect of information asymmetry on hospitals’ profitability, 3 4 5 6 7 8 9 10 11 12 13 14 15 16 17 18 19 20 21 22 23 24 25 26 27 28 29 30 31 32 33 34 35 36 37 38 39 40 41 42 43 44 45 46 47 48 49 50 51 52 53 54 55 56
For Peer Review
4. To specify the relationship between information asymmetry and long-term plan for improving community health, and finally and principally,
5. To examine the relationship between information asymmetry and performance tilting in hospitals nationwide.
METHOD
Hypotheses and Research Design
It is hypothesized that, after controlling for the effects of relevant hospital and market characteristics, when information asymmetry increases, Medicare profit margins of the hospitals will increase, and the likelihood that a hospital will display performance tilting will also increase. These hypotheses are tested in a cross sectional design, analyzing hospital performance data from Fiscal Year 2000.
Data Set
Data are drawn from three sources: the Annual Survey Database (ASDB) - Fiscal Year 2000 from the American Hospital Association (AHA), the Area Resource File (ARF) from the Health Resources and Services Administration, and the Inpatient Medicare Profit Margins (IMPM) - Fiscal Year 2000 from the Centers for Medicare and Medicaid Services (CMS), which are derived from the Hospital Cost Report (CMS-2552-96) of the Healthcare Provider Cost Reporting Information System (HCRIS).
Hospitals that do not participate in the Medicare, including long-term care, rehabilitation, children, psychiatric, and rural critical access hospitals, were excluded from the analysis, as profit margins are not calculated for such facilities. After excluding non-PPS hospitals, 4,631 sample hospitals with IMPM information were retained in the study data base. The 4,631 IMPM 3 4 5 6 7 8 9 10 11 12 13 14 15 16 17 18 19 20 21 22 23 24 25 26 27 28 29 30 31 32 33 34 35 36 37 38 39 40 41 42 43 44 45 46 47 48 49 50 51 52 53 54 55 56 57 58 59
For Peer Review
hospitals were then merged with the ASDB. Data merge was based on several distinguishing data fields. The matching process was successful for 3,162 hospitals, which corresponds to 68.28% of the IMPM hospital population and is large enough to represent its universe. The unit of analysis is the individual hospital of the United States. The universe of the study is all IMPM hospitals in the US.
Dependent variables
Reflecting the existing literature (Marlin et al., 1999; Stensland et al., 2002; Younis and Forgione, 2005), the current study uses Medicare profit margin as the principal dependent variable for hospital profitability. Medicare is the single largest purchaser of hospital services and accounted for 34 percent of weighted national discharges in 1998 and 37 percent in 2005 (Department of Health and Human Services, 2002; Agency for Healthcare Research and Quality, 2005). The reliability and validity of Medicare profit margin had been assessed, and the measure characterizes Medicare's contribution to hospital financial position (Ehreth, 1994). Under PPS, all Medicare inpatient providers must submit uniform cost reports, assuring that profit data will be comparable across all participating hospitals. The research adopts the definition of Medicare profit margins from the Medicare Payment Advisory Commission (MedPAC) to compute the margins. MedPAC computes Medicare profit margins by subtracting total reimbursable Medicare costs from total Medicare revenue, and then dividing that difference by total Medicare revenue (Cowles and Muse, 2003). This variable acts as a proxy for the overall profit orientation of a health care provider, because it is both readily available and calculated using uniform methods. Medicare profit margin is a continuous variable.
Long-term plan was defined as the presence or absence of a long-term plan for community health within the hospital. Hospitals have been urged to make a long-term 3 4 5 6 7 8 9 10 11 12 13 14 15 16 17 18 19 20 21 22 23 24 25 26 27 28 29 30 31 32 33 34 35 36 37 38 39 40 41 42 43 44 45 46 47 48 49 50 51 52 53 54 55 56
For Peer Review
community commitment in the face of short-term trend and opportunities (Seay, 2005), which could be caused by information asymmetry and cost containment. Several recent studies have emphasized on the importance of a hospital’s long-term plan and its predictable contribution to the community health (Fielding et al., 1999; Ghali, 2004; Ito, 2004). To measure whether a hospital has a long-term plan for improving the health of its community, the study uses self-reported hospital responses to the AHA survey (question D.2). Presence of a long-term plan is a nominal variable, coded dichotomously.
Performance tilting implies that one goal will be sacrificed in order to meet another, and thus must be studied using a combination of outcomes. Specifically, the study hypothesizes that hospital administrators will sacrifice having a long term plan that addresses community health in order to generate immediate profits for the hospital. A new variable, performance tilting, was created by combining Medicare profit margin and long-term plan for individual hospitals.
Additional sensitivity and specificity estimations had been conducted to construct a link between high short-term profitability and the absence of a long-term plan. Performance tilting is coded as being present (1) if a hospital has Medicare profit margin that is higher than or equal to 75 percentile and no long-term plan; Absent (0), otherwise.
Independent variable
Because information asymmetry is not directly observable, empiricists must rely on proxy variables (Frech and Wooley, 1989; Clarke and Shastri, 2000). At present there is no widely agreed upon proxy measure for information asymmetry between hospital and patient. To approximate an information asymmetry measure, this research uses the answers to five questions under the Community Orientation section within the 2000 AHA Annual Survey Health Form, which relates to reported sharing of quality, demand, or cost information.
3 4 5 6 7 8 9 10 11 12 13 14 15 16 17 18 19 20 21 22 23 24 25 26 27 28 29 30 31 32 33 34 35 36 37 38 39 40 41 42 43 44 45 46 47 48 49 50 51 52 53 54 55 56 57 58 59
For Peer Review
Why could selected answers on the Community Orientation section be adopted as proxy measures of information asymmetry, rather than the original definition, community orientation? First, as defined by Proenca, Rosko, and Zinn (200), community orientation is the generation, dissemination, and use of “community intelligence” - health service need and quality information. Intelligence and its distribution across participants to a negotiation is the core element of
information asymmetry. Next, only selected items from the “community orientation” section are used. The questions selected pertain to service demand, quality, and cost information, which match the components of information asymmetry in the literature review. The five questions selected as proxies for information asymmetry are as follows (item number from the AHA survey in parentheses):
• Does the hospital work with other providers, public agencies or community representatives to conduct a health status assessment of the community? (D.4.)
• Does your hospital use health status indicators to design new services or modify existing services? (D.5.)
• Does your hospital work with other local providers, public agencies, or community representatives to develop a written assessment of the appropriate capacity for health services in the community? (D.6.a.)
• Does the hospital work with other providers to collect, track and communicate clinical and health information across cooperating organizations? (D.7.)
• Does the hospital, alone or with others, disseminate reports to the community on the quality and costs of health care services? (D.8.)
The information asymmetry variable is the sum of the preceding five measures and defined on a continuous scale of 0 to 5 where 0 indicates minimal information asymmetry and 5 3 4 5 6 7 8 9 10 11 12 13 14 15 16 17 18 19 20 21 22 23 24 25 26 27 28 29 30 31 32 33 34 35 36 37 38 39 40 41 42 43 44 45 46 47 48 49 50 51 52 53 54 55 56
For Peer Review
presents a maximum information asymmetry. The scale shows acceptable reliability/internal consistency (Cronbach’s alpha = 0.76)1 and is considered as an information sharing and
acquisition attitude in a hospital and as an IA proxy, based on normative expectations and
empirical evidence in which information sharing and acquisition reduces information asymmetry (Kim and Verrecchia, 1991; Li and Balachandran, 1997; Bernardo and Judd, 2000).
Other Related Factors
All analyses control for profit versus not-for-profit status of the hospital. Theoretically, nonprofit organizations, due to attenuation of property interests, provide better quality of service than do the for-profits when asymmetric information exists. To examine how ownership status under asymmetric information affects the quality of care, Chou (2002) used mortality as a measure for quality of care in nursing home. Nonprofit nursing homes were found to be superior in mortality and other adverse health outcomes when the residents had asymmetric information. Another empirical study reported that, in the presence of asymmetric information,
non-governmental organizations have the institutional capacity to deliver high quality health care (Leonard, 2002). Nonprofit hospitals may provide protection against asymmetric information relative to their for-profit counterparts (Mark, 1999). Profit or not for profit status is strongly associated with hospital profitability, regardless of information asymmetry conditions (Younis et al., 2003; Horwitz, 2005; Chakravarty et al., 2006).
Other characteristics of the hospital and community are held equal in multivariate analysis. Bed size is held constant, as a positive relationship between bed size and hospital profitability had been identified (Kim et al., 2002). Location (rural versus urban county) is used
1 Cronbach’s alpha is a measure of the internal consistency of a scale, that is, of the degree to which all items are
inter-correlated and thus appear to be addressing the same underlying concept. Values above 0.7 are generally considered acceptable (Bland and Altman, 1997).
3 4 5 6 7 8 9 10 11 12 13 14 15 16 17 18 19 20 21 22 23 24 25 26 27 28 29 30 31 32 33 34 35 36 37 38 39 40 41 42 43 44 45 46 47 48 49 50 51 52 53 54 55 56 57 58 59
For Peer Review
because most rural hospitals do not experience direct local competition (Asubonteng Rivers and Bae, 1999). Additional hospital characteristics include service type, physician payment
arrangements, number of staff physicians, insurance products accepted, and whether the hospital is independent or part of a larger group of hospitals (Younis et al., 2003; Younis and Forgione, 2005). All measures are drawn from the AHA data set, limiting the analysis to categories rather than absolute values for certain variables (bed size, MSA size). In addition, we categorized number of staff physicians, as the raw distribution was considerably skewed, to improve
normality and reduce the potential for systematic bias in multiple regression analyses (Osbourne and Waters, 2002). Community and market factors in the analysis include size of the community in which the hospital is located, whether the hospital falls in a state with community benefit laws, and whether the hospital experiences significant competition in its market. Competition was coded “high” if two or more hospitals were located within the same Zip Code; otherwise, “low.” HMO penetration rate was added in the models to better characterize hospital markets.
Statistical Analysis
The SAS statistical package was used to analyze the data and recode variables if necessary. All tests used in the study were based on an alpha value of 0.05. Three statistical procedures were followed: univariate, bivariate analysis, and multivariate regression analysis.
RESULTS
Description of Study Sample
The original number of IMPM hospitals in the sample was 3,162. Outliers were identified using the cutpoint -300% profit margin (n = 19). After deletion of outliers, 3,143 observations
remained and the profit range was -291.3% to 67.5%. 3 4 5 6 7 8 9 10 11 12 13 14 15 16 17 18 19 20 21 22 23 24 25 26 27 28 29 30 31 32 33 34 35 36 37 38 39 40 41 42 43 44 45 46 47 48 49 50 51 52 53 54 55 56
For Peer Review
Of the 3,143 PPS hospitals, more than two thirds (77.9%) were JCAHO accredited, and about one in six (16.7%) had a medical school affiliation. PPS hospitals were most frequently non-profit (87.75%), general hospitals (98.6%), located in a metropolitan area (51.6%), and averaged 168 beds (Mean=168.4, SD= 175.4) and 14 full-time equivalent staff physicians (Mean=13.5, SD=60.2). Most were located in areas with low competition (79.2%) and without community benefits laws (62.0%). The average HMO penetration rate was 19.0%.
The mean information asymmetry score of PPS hospitals was not high. The most common information asymmetry score was 0, indicating the maximum amount of information sharing. This score was recorded by 46.0% of hospitals (1,445). Only 5.47% of the hospitals received the highest information asymmetry score, 5. The mean was 1.24, ranging from 0 to 5, with standard deviation 1.51.
Medicare profit margins showed a skewed distribution with a mean of 2.27%, range -291.3% to 67.5%, and standard deviation of 23.37. Most PPS hospitals (77.06%) reported having a long-term plan for improving the health of their communities.
Hospital and Market Characteristics and Information Asymmetry
In bivariate analysis, each of the twelve control variables for hospital and market characteristics was associated with significant mean differences in information asymmetry (P<0.0001 for all hospital characteristics; P=0.0039 for market competition; P=0.0247 for community benefits laws; P<0.0001 for HMO penetration rate). On the whole, higher information asymmetry was associated with hospitals that are for-profit, specialty treatment, located in rural areas and in low competitive and low HMO-penetration markets without community benefits laws, small scale, and independent (Table 1).
Hypothesis Testing 3 4 5 6 7 8 9 10 11 12 13 14 15 16 17 18 19 20 21 22 23 24 25 26 27 28 29 30 31 32 33 34 35 36 37 38 39 40 41 42 43 44 45 46 47 48 49 50 51 52 53 54 55 56 57 58 59
For Peer Review
Testing for effects on profit margins and the presence of a long-term plan used a
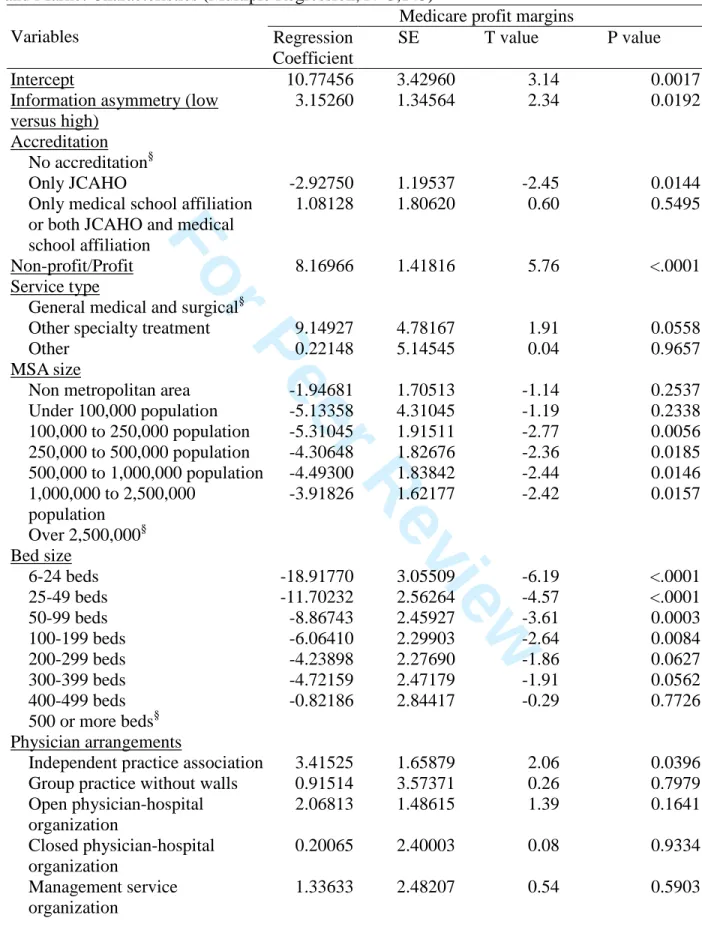
dichotomized measure of information asymmetry. When dichotomized, information asymmetry was expressed as low (scale values 0~3) versus high (scale values of 4 and 5). First, the effect of information asymmetry on Medicare profit margins was tested (Table 2). In multivariate analysis, there was a significant mean difference in Medicare profit margins, 1.85% versus 4.99%,
between hospitals reporting low and high information asymmetry respectively (GLM test, P= 0.0192). On average, a high IA hospital will have 2.7 times the Medicare profit margins of a low IA hospital. This result supports the hypothesis that information asymmetry is associated with increased profit margins.
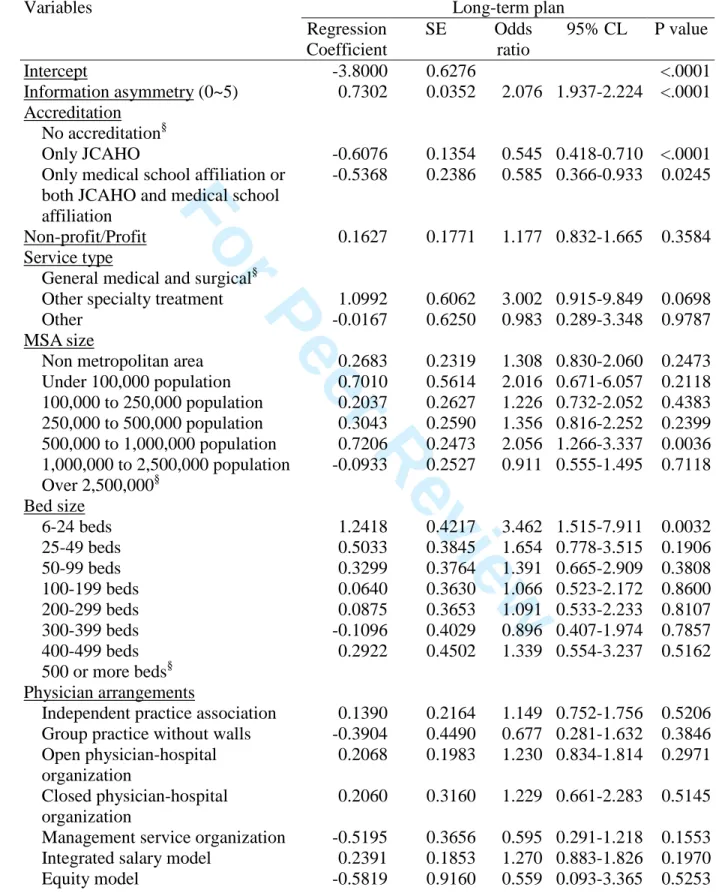
The second hypothesis was that high information asymmetry would be negatively
associated with the likelihood that a hospital would report having a long-term plan for the health of its community. After controlling for all other variables in the model, information asymmetry was a significant predictor of failure to report a long-term plan (Logistic regression, P<0.0001; Table 3). For each 1-point increase in the information asymmetry score, the chance of reporting no long-term plan increased by 2.08 times, when holding constant the other variables in the model. This matches the hypothesis.
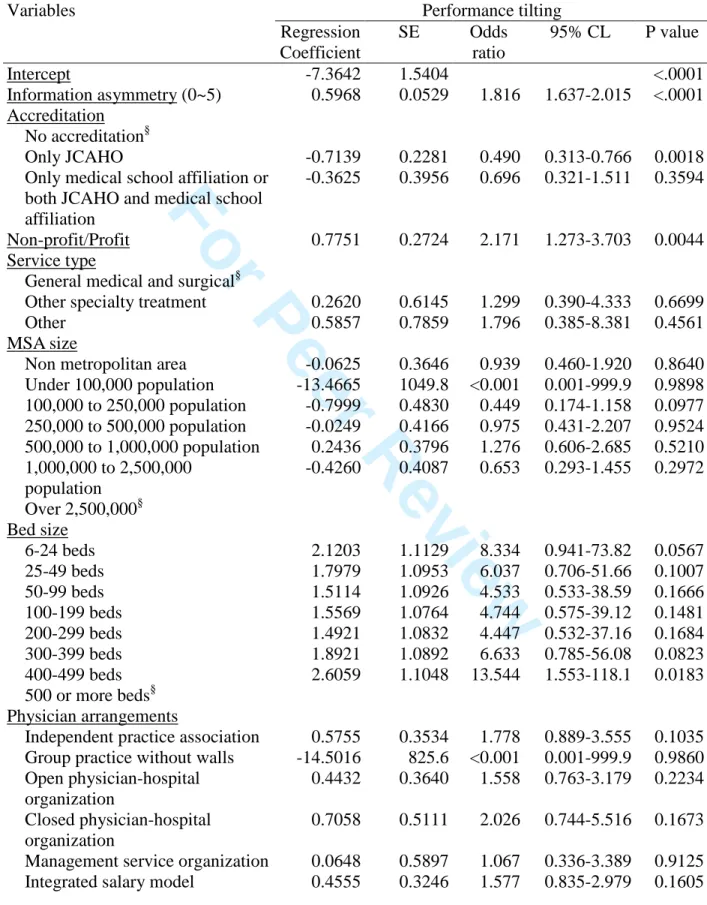
Finally, it was hypothesized that management at institutions with high information asymmetry would display potential performance tilting. Performance tilting, defined as 2000 Medicare profits in the top quartile simultaneous with the absence of a long term plan for the institution, was present in 5.57% of the hospitals. Performance tilting was most common among hospitals that are for-profit, for specialty treatment, in areas that are either rural or with 500,000 to 1,000,000 population, small scale, and independent (P<0.05). The results of logistic regression (Table 4) indicate that, after controlling for all other variables in the model, information
3 4 5 6 7 8 9 10 11 12 13 14 15 16 17 18 19 20 21 22 23 24 25 26 27 28 29 30 31 32 33 34 35 36 37 38 39 40 41 42 43 44 45 46 47 48 49 50 51 52 53 54 55 56
For Peer Review
asymmetry was a significant predictor of performance tilting (P<0.0001). Hospitals that have increased information asymmetry were significantly associated with an increased likelihood of reporting performance tilting. The results support the performance tilting hypothesis.
DISCUSSION
Information Asymmetry
Overall, hospital information asymmetry as measured in our study was not high, with only a small proportion of PPS hospitals (11.07%) reporting the highest level of information asymmetry. Not-for-profit hospitals still dominate in the hospital sector. As discussed earlier, nonprofit organizations may provide better quality and lower price of service than for-profits, and may be less subject to competitive motivation (Chillemi and Gui, 1991; Mark, 1999; Chou, 2002; Horwitz, 2005; Chakravarty et al., 2006). In addition, managed care (HMO) penetration, market competition, and the regulatory actions of public insurers (Medicaid, Medicare) may contribute to the reduction of information asymmetry in hospitals (Jin, 2003). Thus, a low level of information asymmetry across the whole market is not surprising.
For-profit hospitals were found to have a higher level of information asymmetry than non-profit hospitals in bivariate analysis (Table 1). Specialty hospitals contain higher percentage of for-profit hospitals than does the universe of studied hospitals (45.83% versus 12.25%), which may explain why specialty hospitals have higher information asymmetry.
Market competition is known to reduce information asymmetry in HMOs (Jin, 2003). Thus, it was not surprising to find that information asymmetry was higher for hospitals in low competition than high competition markets, and in states without community benefit laws than where such laws are present. The negative relationship between HMO penetration rate and 3 4 5 6 7 8 9 10 11 12 13 14 15 16 17 18 19 20 21 22 23 24 25 26 27 28 29 30 31 32 33 34 35 36 37 38 39 40 41 42 43 44 45 46 47 48 49 50 51 52 53 54 55 56 57 58 59
For Peer Review
information asymmetry (Table 1) suggests that local market competition may alleviate
information asymmetry, since hospitals voluntarily disclose quality information to differentiate themselves from competitors (Jin, 2003). Effect sizes for competition and community benefit laws were not large, suggesting that other influences also affect information disclosure.
Management strategy can be a determinant of information asymmetry (Proenca et al., 2000; Tan et al., 2003); hospital management may elect to withhold information compared to peer
institutions in the same market (Boyer et al., 2003).
In addition to for-profit hospitals, small hospitals, independent hospitals and rural hospitals tended to have higher information asymmetry than their counterparts, large hospitals, chain hospitals and urban hospitals. Small and rural hospitals, and possibly independent facilities, may lack the financial and human resources needed for information acquisition and sharing. The information development activities associated with quality assessment and community planning place a burden on the hospital in terms of analytic personnel and expertise. Smaller institutions may lack the internal infrastructure to use information effectively, and further lack the personnel resources to participate in community-level planning activities. The latter draw resources from the hospital’s core function of individual patient care, which smaller institutions may be unable to spare. Rural hospital positions with regard to information sharing may be driven by size, as such institutions are generally smaller than their urban peers. However, the smallest rural facilities, critical access hospitals, were excluded from this analysis. It is therefore possible that the principal determinant of information asymmetry among rural hospitals is lack of competition.
Information Asymmetry Effects and Relationships
Consistent with theory, hospitals that take a high information asymmetry stance with regard to their community had higher profit margins than did hospitals with lower levels of 3 4 5 6 7 8 9 10 11 12 13 14 15 16 17 18 19 20 21 22 23 24 25 26 27 28 29 30 31 32 33 34 35 36 37 38 39 40 41 42 43 44 45 46 47 48 49 50 51 52 53 54 55 56
For Peer Review
information asymmetry, hospital characteristics held equal (Table 2). The effect size was similar to that for profit versus non-profit status, also present in the model. Two market characteristics associated with information asymmetry, competition and community benefits laws, were not significantly associated with profit margin when information asymmetry was also in the model. HMO penetration rate, on the other hand, was positively correlated with profit margin. In high HMO-penetrated areas, hospitals may tend to adopt the product differentiation strategy to cope with competition and reach higher profitability (Jin, 2003). Since overall hospital profitability was proved to decline as a result of the reduced reimbursement in the Balanced Budget Act (Younis, 2006), the profit motive of hospital and its potential causes and effects merit more attention.
Second, hospitals engaging in high information asymmetry were more likely to report having no long term plan for improving the health of the community (Table 3). Since
development of a community health plan involves working and information sharing with other organizations, an inverse relationship between information asymmetry and a long term plan for community health is logical. The absence of effects for local competition, community benefits laws or HMO penetration rate, however, was surprising. Even though development of long-term community health plan could be considered as a transaction cost burden, hospitals might find it advantageous to voluntarily engage in such a practice to differentiate themselves in competitive markets, build reputation, and discreetly advertise (Spence, 1973; Serour and Dickens, 2004). However, market features were not found to be significant when management aversion to information sharing, as manifested in information asymmetry, is modeled.
Most importantly, the research found that when information asymmetry becomes higher, hospitals were more likely to engage in performance tilting, defined as high profits coincident 3 4 5 6 7 8 9 10 11 12 13 14 15 16 17 18 19 20 21 22 23 24 25 26 27 28 29 30 31 32 33 34 35 36 37 38 39 40 41 42 43 44 45 46 47 48 49 50 51 52 53 54 55 56 57 58 59
For Peer Review
with the absence of a plan for community health. Maximizing the institution’s current Medicare profits, while failing to build a long-term plan for improving people’s health, appears to co-occur with information asymmetry and may reflect a similar managerial focus on addressing short-term issues. For-profit status was also associated with an increased likelihood of performance tilting, even with the higher rates of information asymmetry at for-profit hospitals held constant. JCAHO accredited hospitals were less likely than non-accredited hospitals to engage in
performance tilting. Market characteristics were not significantly related to performance tilting.
Limitations
There are multiple limitations to the present research which need to be addressed. First, two of the dependent variables, information asymmetry and performance tilting, were measured using self-report data from the AHA annual survey, and thus are subject to respondent bias. This could attenuate the results. Second, because revenue data are considered confidential and are not released publicly at the hospital level, Medicare profit margins were chosen to serve as the profitability indicator in this study. The study assumes that there is no significant difference between the effects of information asymmetry on Medicare profit margins and its effects on other related measures of profitability. Third, missing values and lost data as a result of merging can weaken the statistical testing power. It is possible that the relationship between information asymmetry and the variables examined in this research were different at the 31.72% of hospitals for which the two data files could not be matched. Finally and most importantly, all analyses were cross-sectional. Therefore, it is impossible to determine a temporal or causal relationship between information asymmetry and its effects from the analysis. It is important that future research examine the relationships between information asymmetry and time-lagged outcomes, 3 4 5 6 7 8 9 10 11 12 13 14 15 16 17 18 19 20 21 22 23 24 25 26 27 28 29 30 31 32 33 34 35 36 37 38 39 40 41 42 43 44 45 46 47 48 49 50 51 52 53 54 55 56
For Peer Review
to distinguish between information asymmetry as a response to existing conditions and information asymmetry as input into the development of future financial outcomes.
Policy Implications
The effects of information asymmetry are difficult to address through policy, and
performance tilting poses an even more intractable problem. Health care report cards, addressing the informational asymmetry problem in health care markets, give health care providers perverse incentives: to decline more difficult, severely ill patients (Dranove et al., 2003). The evidence regarding consumer use of such information is mixed. Health plan report cards have been found to influence consumer selection of insurers (Scanlon et al., 2002). However, acutely ill patients have been found to be generally unaware of quality reporting, and often have few alternatives available to them (Schneider and Epstein, 1998; Marshall et al., 2000) Further, even when conditions are less inherently constrained by time and illness—consumer search for nursing home rather than hospital care—consumers are not necessarily interested in accessing such information (Castle, 2003). Whether increased information demands from a society accustomed to significant data availability will reduce agency problems in healthcare management is unclear. An information-rich society will probably continue to expect, and in some cases demand through regulation, increased disclosure from hospitals and other healthcare providers. The best form of such disclosure, and its content from patient safety (Small and Barach, 2002) through financial accounting (Peregrine and Schwartz, 2002; Valletta, 2005), are likely to be debated through the next decade. Policies aimed at mandatory information disclosure may only proceed as effective, comparable performance metrics are developed (Eggleston, 2005) and as the population is educated to use them.
3 4 5 6 7 8 9 10 11 12 13 14 15 16 17 18 19 20 21 22 23 24 25 26 27 28 29 30 31 32 33 34 35 36 37 38 39 40 41 42 43 44 45 46 47 48 49 50 51 52 53 54 55 56 57 58 59
For Peer Review
The performance tilting problem has been more commonly documented among management personnel in industry (Guilding et al., 2005; Khaleghian and Gupta, 2005). With high CEO turnover and short CEO tenure in hospitals (Evans, 2006; Khaliq et al., 2006), however, the temptation to enhance short-term managerial performance cannot be discounted. Hospital Boards of Directors should be sensitive to the possibility of principal-agent performance manipulation when extreme information asymmetry levels and higher-than-average profitability are present simultaneously. The long-term integration of the hospital into the community may be experiencing neglect to ensure that present goals are met. Given the pressure of community benefit laws non-profit hospital boards should be particularly attentive to the implications of potential excess hospital earnings for the institution’s long-term tax status. Board assessments of hospital CEO performance which address performance on community health measures have been found to be related to increased engagement of the hospital with the community (Alexander et al., 2008). Thus, balanced measures of performance may be one means for addressing the problem of performance tilting.
Conclusion
The current study proceeds from the assumption that asymmetric information gives hospitals an informational advantage over the consumer and market power to direct health service use. This leads to higher profitability, and creates the possibility of performance tilting. Adopting a proxy measure for information asymmetry, this study has empirically demonstrated that hospitals, like traditional businesses, can engage in profit maximization and performance tilting behaviors. Since Zeckhauser and Pound first proposed the performance tilting issue in 3 4 5 6 7 8 9 10 11 12 13 14 15 16 17 18 19 20 21 22 23 24 25 26 27 28 29 30 31 32 33 34 35 36 37 38 39 40 41 42 43 44 45 46 47 48 49 50 51 52 53 54 55 56
For Peer Review
1990 [36], there has not been a nationwide empirical examination of performance tilting in the health care sector. The present research establishes a baseline for future studies on the issue.
As Zeckhauser and Pound suggested, management will have an incentive to tilt earnings toward the present when information asymmetry is present, although outside monitors on both “A” and “B” can ameliorate this distortion. In the hospital case, hospital executives will seek to demonstrate to patients and other stakeholders that they are operating effectively by fostering immediate profit at the expense of developing a long-term plan for the institution and its role in the community’s health. Hospital Boards of Directors should ideally serve as the outside
monitors referenced by Zeckhauser and Pound.
The findings of our study partially support the agent theory and transactional cost analysis. Under the uncertainty condition in which information search is costly, uninformed patients who lack a mechanism to discern health service quality have to rely on delegating health services to health care providers as their (imperfect) agents. In delivering health care, hospitals may conceal quality and cost information and may not communicate health information to specify what would constitute appropriate provision for need of care relative to patients, because information sharing and acquisition is a transaction cost in which some hospitals may not choose to invest. Asymmetric information leaves open the possibility of the tilting and
profit-maximizing provider behavior on the part of the hospital and the physician. Since asymmetry in information as a cost, an advantage, and even a marketing tactic has an impact on the
effectiveness of resource allocation in the health service market, its implications for delivering better health care and enhancing patient benefits are profound.
3 4 5 6 7 8 9 10 11 12 13 14 15 16 17 18 19 20 21 22 23 24 25 26 27 28 29 30 31 32 33 34 35 36 37 38 39 40 41 42 43 44 45 46 47 48 49 50 51 52 53 54 55 56 57 58 59
For Peer Review
Figure 1. A Model of the Mechanism between Three Participants of Health Care Services (Mooney, 1994; Nichols, 1998) and the Relative Distributions of the Amount of Information
Consumers Providers Insurers Quality information Cost information Health information 3 4 5 6 7 8 9 10 11 12 13 14 15 16 17 18 19 20 21 22 23 24 25 26 27 28 29 30 31 32 33 34 35 36 37 38 39 40 41 42 43 44 45 46 47 48 49 50 51 52 53 54 55 56
For Peer Review
Table 1. Mean Information Asymmetry Scores by Hospital and Market Characteristics (GLM Test, N=3,143)
Information asymmetry Variables
N DF Sum of squares
LSMean F value P value
Accreditation 2 547.58 129.91 <.0001
No accreditation 683 1.9883
Only JCAHO 1935 1.1106
Only medical school affiliation or both JCAHO and medical school
affiliation 525 0.7371 Profit/Non-profit 1 54.75 24.19 <.0001 Profit 385 1.5922 Non-profit 2758 1.1896 Service type 2 77.58 17.18 <.0001
General medical and surgical 3098 1.2221 Other specialty treatment 24 2.9583 Other 21 1.7619 MSA size 6 265.56 20.12 <.0001
Non metropolitan area 1520 1.5211
Under 100,000 population 31 0.7097 100,000 to 250,000 population 246 1.2236 250,000 to 500,000 population 262 0.9237 500,000 to 1,000,000 population 250 1.0440 1,000,000 to 2,500,000 population 405 0.8049 Over 2,500,000 429 1.0023 Bed size 7 513.80 34.59 <.0001 6-24 beds 158 2.2278 25-49 beds 575 1.6835 50-99 beds 679 1.4212 100-199 beds 831 1.1071 200-299 beds 419 0.7948 300-399 beds 213 0.8685 400-499 beds 111 0.6396 500 or more beds 157 0.6369 Physician arrangements 9 307.81 15.63 <.0001 Independent practice association 266 1.4624
Group practice without 43 1.3953
3 4 5 6 7 8 9 10 11 12 13 14 15 16 17 18 19 20 21 22 23 24 25 26 27 28 29 30 31 32 33 34 35 36 37 38 39 40 41 42 43 44 45 46 47 48 49 50 51 52 53 54 55 56 57 58 59
For Peer Review
walls Open physician-hospital organization 356 1.1348 Closed physician-hospital organization 101 1.0891 Management service organization 94 1.2766Integrated salary model 424 1.2712
Equity model 12 1.1667 Foundation 44 0.8636 Multiple arrangements 817 0.7980 Not assigned 986 1.5903 Insurance products 4 189.47 21.31 <.0001 Health maintenance organization 197 0.7716 Preferred provider organization 317 1.1293
Indemnity fee for service plan
15 1.2000
Multiple products 518 0.8282
Not assigned 2096 1.4012
Health system cluster1 5 149.67 13.38 <.0001
Centralized health system 155 0.4516
Centralized physician/insurance health system 170 1.0706 Moderately centralized health system 485 1.1113 Decentralized health system 684 1.2573 Independent hospital system 61 1.8689 Not assigned 1588 1.3407 Staffed physicians 3 213.56 32.14 <.0001 0 physician 1351 1.3871 1 physician 281 1.5872 2-7 physicians 757 1.2867 > 7 physicians 754 0.7958 Competition2 1 19.03 8.36 0.0039 High competition 654 1.0872 Low competition 2489 1.2788
Community Benefits Laws 1 11.51 5.05 0.0247
Present3 1194 1.1616
Absent 1949 1.2863
HMO Penetration Rate4 <.0001
3 4 5 6 7 8 9 10 11 12 13 14 15 16 17 18 19 20 21 22 23 24 25 26 27 28 29 30 31 32 33 34 35 36 37 38 39 40 41 42 43 44 45 46 47 48 49 50 51 52 53 54 55 56
For Peer Review
Note: 1 This new classification system was developed by the AHA’s Health Research and Educational Trust and Health Forum, and the University of California-Berkeley (Bazzoli et al, 1999).
2
Competition was coded high if two or more hospitals were located within the same area of a zip code; otherwise, low.
3
CA, CT, GA, ID, IN, MA, MN, NH, NY, PA, RI, TX, UT, WV. 4
Pearson correlation coefficient=-0.1859. 3 4 5 6 7 8 9 10 11 12 13 14 15 16 17 18 19 20 21 22 23 24 25 26 27 28 29 30 31 32 33 34 35 36 37 38 39 40 41 42 43 44 45 46 47 48 49 50 51 52 53 54 55 56 57 58 59
For Peer Review
Table 2. Effect of Information Asymmetry on Medicare Profit Margins, Controlling for Hospital and Market Characteristics (Multiple Regression, N=3,143)
Medicare profit margins
Variables Regression
Coefficient
SE T value P value
Intercept 10.77456 3.42960 3.14 0.0017
Information asymmetry (low versus high)
3.15260 1.34564 2.34 0.0192
Accreditation No accreditation§
Only JCAHO -2.92750 1.19537 -2.45 0.0144
Only medical school affiliation or both JCAHO and medical school affiliation
1.08128 1.80620 0.60 0.5495
Non-profit/Profit 8.16966 1.41816 5.76 <.0001
Service type
General medical and surgical§
Other specialty treatment 9.14927 4.78167 1.91 0.0558
Other 0.22148 5.14545 0.04 0.9657
MSA size
Non metropolitan area -1.94681 1.70513 -1.14 0.2537 Under 100,000 population -5.13358 4.31045 -1.19 0.2338 100,000 to 250,000 population -5.31045 1.91511 -2.77 0.0056 250,000 to 500,000 population -4.30648 1.82676 -2.36 0.0185 500,000 to 1,000,000 population -4.49300 1.83842 -2.44 0.0146 1,000,000 to 2,500,000 population -3.91826 1.62177 -2.42 0.0157 Over 2,500,000§ Bed size 6-24 beds -18.91770 3.05509 -6.19 <.0001 25-49 beds -11.70232 2.56264 -4.57 <.0001 50-99 beds -8.86743 2.45927 -3.61 0.0003 100-199 beds -6.06410 2.29903 -2.64 0.0084 200-299 beds -4.23898 2.27690 -1.86 0.0627 300-399 beds -4.72159 2.47179 -1.91 0.0562 400-499 beds -0.82186 2.84417 -0.29 0.7726 500 or more beds§ Physician arrangements
Independent practice association 3.41525 1.65879 2.06 0.0396 Group practice without walls 0.91514 3.57371 0.26 0.7979 Open physician-hospital organization 2.06813 1.48615 1.39 0.1641 Closed physician-hospital organization 0.20065 2.40003 0.08 0.9334 Management service organization 1.33633 2.48207 0.54 0.5903 3 4 5 6 7 8 9 10 11 12 13 14 15 16 17 18 19 20 21 22 23 24 25 26 27 28 29 30 31 32 33 34 35 36 37 38 39 40 41 42 43 44 45 46 47 48 49 50 51 52 53 54 55 56
For Peer Review
Integrated salary model 0.09545 1.42354 0.07 0.9465
Equity model -3.48593 6.57285 -0.53 0.5959 Foundation 2.70756 3.52800 0.77 0.4429 Multiple arrangements§ Not assigned -0.71458 1.20245 -0.59 0.5524 Insurance products Health maintenance organization 2.28178 1.94442 1.17 0.2407
Preferred provider organization -1.30171 1.64781 -0.79 0.4296 Indemnity fee for service plan 9.87808 6.16031 1.60 0.1089 Multiple products§
Not assigned -0.03969 1.24532 -0.03 0.9746
Health system cluster
Centralized health system§ Centralized physician/insurance health System
0.64792 2.59219 0.25 0.8026
Moderately centralized health system
-1.88795 2.18329 -0.86 0.3873
Decentralized health system -2.03565 2.13990 -0.95 0.3415 Independent hospital system -5.48964 3.56093 -1.54 0.1233
Not assigned -3.22829 2.04146 -1.58 0.1139 Staffed physicians 0 physician§ 1 physician -1.67968 1.50042 -1.12 0.2630 2-7 physicians 4.03183 1.07104 3.76 0.0002 > 7 physicians 3.32881 1.20871 2.75 0.0059 Competition -0.01685 1.10482 -0.02 0.9878
Community Benefits Laws 1.53972 0.89273 1.72 0.0847
HMO Penetration Rate 8.48546 3.58171 2.37 0.0179
Note: 1. R-Square=.09, DF=43, F=7.40, P<.0001 Note: 2. § Reference category
Note: 3. Information asymmetry in a scale of 0~5 was not significant (P=0.0654) 3 4 5 6 7 8 9 10 11 12 13 14 15 16 17 18 19 20 21 22 23 24 25 26 27 28 29 30 31 32 33 34 35 36 37 38 39 40 41 42 43 44 45 46 47 48 49 50 51 52 53 54 55 56 57 58 59
For Peer Review
Table 3. Relationship between Information Asymmetry and the Likelihood that a Hospital Will Report Having No Long-Term Plan for Community Health, Controlling for Hospital and Market Characteristics (Logistic Regression, N=3,143)
Long-term plan Variables Regression Coefficient SE Odds ratio 95% CL P value Intercept -3.8000 0.6276 <.0001 Information asymmetry (0~5) 0.7302 0.0352 2.076 1.937-2.224 <.0001 Accreditation No accreditation§ Only JCAHO -0.6076 0.1354 0.545 0.418-0.710 <.0001 Only medical school affiliation or
both JCAHO and medical school affiliation
-0.5368 0.2386 0.585 0.366-0.933 0.0245
Non-profit/Profit 0.1627 0.1771 1.177 0.832-1.665 0.3584 Service type
General medical and surgical§
Other specialty treatment 1.0992 0.6062 3.002 0.915-9.849 0.0698
Other -0.0167 0.6250 0.983 0.289-3.348 0.9787
MSA size
Non metropolitan area 0.2683 0.2319 1.308 0.830-2.060 0.2473 Under 100,000 population 0.7010 0.5614 2.016 0.671-6.057 0.2118 100,000 to 250,000 population 0.2037 0.2627 1.226 0.732-2.052 0.4383 250,000 to 500,000 population 0.3043 0.2590 1.356 0.816-2.252 0.2399 500,000 to 1,000,000 population 0.7206 0.2473 2.056 1.266-3.337 0.0036 1,000,000 to 2,500,000 population -0.0933 0.2527 0.911 0.555-1.495 0.7118 Over 2,500,000§ Bed size 6-24 beds 1.2418 0.4217 3.462 1.515-7.911 0.0032 25-49 beds 0.5033 0.3845 1.654 0.778-3.515 0.1906 50-99 beds 0.3299 0.3764 1.391 0.665-2.909 0.3808 100-199 beds 0.0640 0.3630 1.066 0.523-2.172 0.8600 200-299 beds 0.0875 0.3653 1.091 0.533-2.233 0.8107 300-399 beds -0.1096 0.4029 0.896 0.407-1.974 0.7857 400-499 beds 0.2922 0.4502 1.339 0.554-3.237 0.5162 500 or more beds§ Physician arrangements
Independent practice association 0.1390 0.2164 1.149 0.752-1.756 0.5206 Group practice without walls -0.3904 0.4490 0.677 0.281-1.632 0.3846 Open physician-hospital organization 0.2068 0.1983 1.230 0.834-1.814 0.2971 Closed physician-hospital organization 0.2060 0.3160 1.229 0.661-2.283 0.5145 Management service organization -0.5195 0.3656 0.595 0.291-1.218 0.1553 Integrated salary model 0.2391 0.1853 1.270 0.883-1.826 0.1970 Equity model -0.5819 0.9160 0.559 0.093-3.365 0.5253 3 4 5 6 7 8 9 10 11 12 13 14 15 16 17 18 19 20 21 22 23 24 25 26 27 28 29 30 31 32 33 34 35 36 37 38 39 40 41 42 43 44 45 46 47 48 49 50 51 52 53 54 55 56
For Peer Review
Foundation -0.6308 0.5900 0.532 0.167-1.692 0.2850 Multiple arrangements§
Not assigned 0.0919 0.1602 1.096 0.801-1.501 0.5662 Insurance products
Health maintenance organization 0.1247 0.3002 1.133 0.629-2.040 0.6780 Preferred provider organization -0.0589 0.2388 0.943 0.590-1.505 0.8052 Indemnity fee for service plan -0.0695 0.8414 0.933 0.179-4.853 0.9342 Multiple products§
Not assigned 0.3911 0.1804 1.479 1.038-2.106 0.0302 Health system cluster
Centralized health system§ Centralized physician/insurance health system
0.5670 0.5243 1.763 0.631-4.926 0.2794 Moderately centralized health
system
0.9048 0.4750 2.471 0.974-6.269 0.0568 Decentralized health system 0.8203 0.4685 2.271 0.907-5.689 0.0800 Independent hospital system 0.8106 0.5797 2.249 0.722-7.006 0.1620 Not assigned 1.1770 0.4597 3.245 1.318-7.988 0.0105 Staffed physicians 0 physician§ 1 physician -0.2165 0.1839 0.805 0.562-1.155 0.2391 2-7 physicians -0.1891 0.1358 0.828 0.634-1.080 0.1637 > 7 physicians -0.0969 0.1669 0.908 0.654-1.259 0.5614 Competition 0.0103 0.1529 1.010 0.749-1.363 0.9462
Community Benefits Laws -0.2196 0.1162 0.803 0.639-1.008 0.0588 HMO Penetration Rate 0.4212 0.4704 1.524 0.606-3.831 0.3705 Note: 1. Probability modeled is long-term plan=0
Note: 2. Likelihood ratio Chi-Square=963.71, DF=43, P<.0001 Note: 3. § Reference category
Note: 4. Dichotomized information asymmetry (low vs. high) was also significant (P<.0001) 3 4 5 6 7 8 9 10 11 12 13 14 15 16 17 18 19 20 21 22 23 24 25 26 27 28 29 30 31 32 33 34 35 36 37 38 39 40 41 42 43 44 45 46 47 48 49 50 51 52 53 54 55 56 57 58 59
For Peer Review
Table 4. Relationship between Information Asymmetry and the Likelihood that a Hospital Will Display Performance Tilting, Controlling for Hospital and Market Characteristics (Logistic Regression, N=3,143) Performance tilting Variables Regression Coefficient SE Odds ratio 95% CL P value Intercept -7.3642 1.5404 <.0001 Information asymmetry (0~5) 0.5968 0.0529 1.816 1.637-2.015 <.0001 Accreditation No accreditation§ Only JCAHO -0.7139 0.2281 0.490 0.313-0.766 0.0018 Only medical school affiliation or
both JCAHO and medical school affiliation
-0.3625 0.3956 0.696 0.321-1.511 0.3594
Non-profit/Profit 0.7751 0.2724 2.171 1.273-3.703 0.0044 Service type
General medical and surgical§
Other specialty treatment 0.2620 0.6145 1.299 0.390-4.333 0.6699
Other 0.5857 0.7859 1.796 0.385-8.381 0.4561
MSA size
Non metropolitan area -0.0625 0.3646 0.939 0.460-1.920 0.8640 Under 100,000 population -13.4665 1049.8 <0.001 0.001-999.9 0.9898 100,000 to 250,000 population -0.7999 0.4830 0.449 0.174-1.158 0.0977 250,000 to 500,000 population -0.0249 0.4166 0.975 0.431-2.207 0.9524 500,000 to 1,000,000 population 0.2436 0.3796 1.276 0.606-2.685 0.5210 1,000,000 to 2,500,000 population -0.4260 0.4087 0.653 0.293-1.455 0.2972 Over 2,500,000§ Bed size 6-24 beds 2.1203 1.1129 8.334 0.941-73.82 0.0567 25-49 beds 1.7979 1.0953 6.037 0.706-51.66 0.1007 50-99 beds 1.5114 1.0926 4.533 0.533-38.59 0.1666 100-199 beds 1.5569 1.0764 4.744 0.575-39.12 0.1481 200-299 beds 1.4921 1.0832 4.447 0.532-37.16 0.1684 300-399 beds 1.8921 1.0892 6.633 0.785-56.08 0.0823 400-499 beds 2.6059 1.1048 13.544 1.553-118.1 0.0183 500 or more beds§ Physician arrangements
Independent practice association 0.5755 0.3534 1.778 0.889-3.555 0.1035 Group practice without walls -14.5016 825.6 <0.001 0.001-999.9 0.9860 Open physician-hospital organization 0.4432 0.3640 1.558 0.763-3.179 0.2234 Closed physician-hospital organization 0.7058 0.5111 2.026 0.744-5.516 0.1673 Management service organization 0.0648 0.5897 1.067 0.336-3.389 0.9125 Integrated salary model 0.4555 0.3246 1.577 0.835-2.979 0.1605 3 4 5 6 7 8 9 10 11 12 13 14 15 16 17 18 19 20 21 22 23 24 25 26 27 28 29 30 31 32 33 34 35 36 37 38 39 40 41 42 43 44 45 46 47 48 49 50 51 52 53 54 55 56
For Peer Review
Equity model -14.2739 1527.3 <0.001 0.001-999.9 0.9925 Foundation -13.9669 854.4 <0.001 0.001-999.9 0.9870 Multiple arrangements§ Not assigned 0.2349 0.2972 1.265 0.706-2.265 0.4292 Insurance productsHealth maintenance organization 1.1021 0.4782 3.011 1.179-7.686 0.0212 Preferred provider organization 0.1172 0.4761 1.124 0.442-2.859 0.8056 Indemnity fee for service plan 2.0818 0.9100 8.019 1.347-47.72 0.0222 Multiple products§
Not assigned 0.5914 0.3547 1.806 0.901-3.620 0.0955 Health system cluster
Centralized health system§ Centralized physician/insurance health system
0.8260 1.1361 2.284 0.246-21.17 0.4672 Moderately centralized health
system
1.0091 1.0479 2.743 0.352-21.39 0.3356 Decentralized health system 0.7653 1.0446 2.150 0.277-16.66 0.4638 Independent hospital system 0.5228 1.1695 1.687 0.170-16.69 0.6548 Not assigned 1.0831 1.0338 2.954 0.389-22.41 0.2948 Staffed physicians 0 physician§ 1 physician -0.4317 0.3287 0.649 0.341-1.237 0.1890 2-7 physicians 0.3942 0.2176 1.483 0.968-2.272 0.0701 > 7 physicians 0.3928 0.2873 1.481 0.843-2.601 0.1716 Competition -0.5518 0.2834 0.576 0.330-1.004 0.0515
Community Benefits Laws 0.0670 0.1944 1.069 0.730-1.565 0.7305 HMO Penetration Rate 1.1842 0.7900 3.268 0.695-15.37 0.1339 Note: 1. Probability modeled is performance tilting positive (0)
Note: 2. Likelihood ratio Chi-Square=292.63, DF=43, P<.0001 Note: 3. § Reference category
Note: 4. Dichotomized information asymmetry (low vs. high) was also significant (P<.0001) 3 4 5 6 7 8 9 10 11 12 13 14 15 16 17 18 19 20 21 22 23 24 25 26 27 28 29 30 31 32 33 34 35 36 37 38 39 40 41 42 43 44 45 46 47 48 49 50 51 52 53 54 55 56 57 58 59
For Peer Review
REFERENCESAgency for Healthcare Research and Quality, U.S. Statistics on Hospital-Based Care in the United States, 2005. http://www.hcup-us.ahrq.gov/reports/factsandfigures/facts_figures_2005.jsp [10 August 2010].
Akerlof GA, Spence AM, Stiglitz JE. 2001. The analyses of markets with asymmetric
information. The Nobel Foundation. http://www.nobel.se/economics/laureates/2001/ [3 March 2005].
Albrecht J, Lang H, Vroman S. 2002. The effect of information on the well-being of the uninformed: what's the chance of getting a decent meal in an unfamiliar city? International
Journal of Industrial Organization 20: 139-162.
Alexander JA, Young GJ, Weiner BJ, Hearld LR. 2008. Governance and community benefit: are nonprofit hospitals good candidates for Sarbanes-Oxley type reforms? Journal of health politics,
policy and law 33: 199-224.
American College of Healthcare Executives. 2002. Evaluating the Performance of the Hospital CEO. Healthcare executive 17: 54.
Arrow KJ. 1963. Uncertainty and the Welfare Economics of Medical Care. American economic
review 53: 941-973.
Asubonteng Rivers P, Bae S. 1999. Hospital competition in major U.S. metropolitan areas: An empirical evidence. Journal of Socio-Economics 28: 597-606.
Azoulay-Schwartz R, Kraus S, Wilkenfeld J. 2004. Exploitation vs. exploration: choosing a supplier in an environment of incomplete information. Decision Support Systems 38: 1-18. Basu AK, Chau NH. 1999. Adverse selection, asymmetric information, and foreign investment policies. International Review of Economics & Finance 8: 239-252.
Becker ER, Potter SJ. 2002. Organizational Rationality, Performance, and Social Responsibility: Results from the Hospital Industry. Journal of health care finance 29: 23.
Beldona S. 1995. Corporate Myopia and Firm Performance: An International Comparison.
Journal of International Business Studies 26: 913-914.
Bernardo AE, Judd KL. 2000. Asset market equilibrium with general tastes, returns, and informational asymmetries. Journal of Financial Markets 3: 17-43.
Bland JM, Altman DG. 1997. Statistics notes: Cronbach's alpha. BMJ 314: 572.
Boyer M, Mahenc P, Moreaux M. 2003. Asymmetric information and product differentiation.
Regional science and urban economics 33: 93-113.
Castle NG. 2003. Searching for and Selecting a Nursing Facility. Medical Care Research &
Review 60: 223.
Chakravarty S, Gaynor M, Klepper S, Vogt WB. 2006. Does the profit motive make Jack nimble? Ownership form and the evolution of the US hospital industry. Health Economics 15: 345-61. Challen R. 2000. Institutions, Transaction Costs and Environmental Policy. Edward Elgar Publishing, Inc.: Northampton.
Chemmanur TJ, Ravid SA. 1999. Asymmetric Information, Corporate Myopia, and Capital Gains Tax Rates: An Analysis of Policy Prescriptions. Journal of Financial Intermediation 8: 205-231.
Chillemi O, Gui B. 1991. Uninformed customers and nonprofit organization : Modelling 'contract failure' theory. Economics letters 35: 5-8.
Chou SY. 2002. Asymmetric information, ownership and quality of care: an empirical analysis of nursing homes. Journal of Health Economics 21: 293-311.
3 4 5 6 7 8 9 10 11 12 13 14 15 16 17 18 19 20 21 22 23 24 25 26 27 28 29 30 31 32 33 34 35 36 37 38 39 40 41 42 43 44 45 46 47 48 49 50 51 52 53 54 55 56
For Peer Review
Clarke J, Shastri K. 2000. Social Science Research Network Electronic Paper Collection. http://ssrn.com/abstract=251938 [6 March 2006].
Clemons EK, Thatcher ME. 1997. Evaluating Alternative Information Regimes in the Private Health Insurance Industry: Managing the Social Cost of Private Information. Journal of
Management Information Systems 14: 9-32.
Competition Commission. 2000. Inquiry into the Proposed Merger between British United Provident Association Limited (BUPA) and Community Hospitals Group PLC (CHG). Francis Royle, Press Officer.
http://www.competition-commission.org.uk/press_rel/archive/2000_earlier/html/43-00.htm [6 October 2005]. Constantiou ID, Courcoubetis CA. 2001. Information Asymmetry Models in Internet Connectivity Markets. Athens University of Economics and Business.
Cowles M, Muse DN. 2003. In National Association for Home Care & Hospice, Vol. 2003. Culyer AX. 1989. The Normative Economics of Health Care Finance and Provision. Oxford
Review of Economic Policy 5: 34-58.
De Fraja G. 2000. Contracts for health care and asymmetric information. Journal of Health
Economics 19: 663-677.
Department of Health and Human Services, U.S. Analysis of the Joint Distribution of Disproportionate Share Hospital Payments.
http://aspe.os.dhhs.gov/search/health/reports/02/DSH/ch7.htm [22 January 2005].
Dranove D, Kessler D, McClellan M, Satterthwaite M. 2003. Is more information better? The effects of 'report cards' on health care providers. Journal of Political Economy 111: 555-586. Dranove D, White W. 1994. Recent Theory and Evidence on Competition in Hospital Markets.
Journal of Economics & Management Strategy 3: 169-209.
Eggleston K. 2005. Multitasking and mixed systems for provider payment. Journal of Health
Economics 24: 211-223.
Ehreth JL. 1994. The development and evaluation of hospital performance measures for policy analysis. Med Care 32: 568-87.
Eldenburg L, Hermalin BE, Weisbach MS, Wosinska M. 2004. Governance, performance objectives and organizational form: evidence from hospitals. Journal of Corporate Finance 10: 527-548.
Ellis RP, McGuire TG. 1996. Hospital response to prospective payment: Moral hazard, selection, and practice-style effects. Journal of Health Economics 15: 257-277.
Ernst CM. 2003. The interaction between cost-management and learning for major surgical procedures - lessons from asymmetric information. Health Economics 12: 199-215.
Evans M. 2006. CEO turnover slows--for now. Modern Healthcare 36: 10.
Evans RG. 1984. Strained Mercy: The Economics of Canadian Health Care. Butterworths: Toronto.
Fielding JE, Sutherland CE, Halfon N. 1999. Community health report cards. Results of a national survey. Am J Prev Med 17: 79-86.
Fishman A, Simhon A. 2000. Investment in quality under asymmetric information with endogenously informed consumers. Economics letters 68: 327-332.
Frank RG, Glazer J, McGuire TG. 2000. Measuring adverse selection in managed health care.
Journal of Health Economics 19: 829-854.
Frech HE, Wooley JM. 1989. Consumer Information, Price and Nonprice Competition Among Hospitals, University of California, Santa Barbara, Department of Economics. Working Paper
6-89. 3 4 5 6 7 8 9 10 11 12 13 14 15 16 17 18 19 20 21 22 23 24 25 26 27 28 29 30 31 32 33 34 35 36 37 38 39 40 41 42 43 44 45 46 47 48 49 50 51 52 53 54 55 56 57 58 59