行政院國家科學委員會專題研究計畫 成果報告
應用多源遙測資料於森林資源調查之研究
研究成果報告(精簡版)
計 畫 類 別 : 個別型 計 畫 編 號 : NSC 95-2313-B-004-001- 執 行 期 間 : 95 年 08 月 01 日至 96 年 12 月 31 日 執 行 單 位 : 國立政治大學地政學系 計 畫 主 持 人 : 詹進發 計畫參與人員: 大學生-兼任助理:陳青、鄭則元 報 告 附 件 : 出席國際會議研究心得報告及發表論文 處 理 方 式 : 本計畫涉及專利或其他智慧財產權,2 年後可公開查詢中 華 民 國 97 年 03 月 02 日
1
行政院國家科學委員會補助專題研究計畫
成 果 報 告
F期中進度報告
計畫名稱:應用多源遙測資料於森林資源調查之研究
計畫類別:
個別型計畫 □ 整合型計畫
計畫編號:
NSC95-2313-B-004-001
執行期間: 95 年 8 月 1 日至 96 年 12 月 31 日
計畫主持人:詹進發
共同主持人:
計畫參與人員:
鄭則元、陳青
成果報告類型(依經費核定清單規定繳交):
精簡報告 □完整報告
本成果報告包括以下應繳交之附件:
□赴國外出差或研習心得報告一份
□赴大陸地區出差或研習心得報告一份
出席國際學術會議心得報告及發表之論文各一份
□國際合作研究計畫國外研究報告書一份
處理方式:除產學合作研究計畫、提升產業技術及人才培育研究計畫、
列管計畫及下列情形者外,得立即公開查詢
□涉及專利或其他智慧財產權,□一年□二年後可公開查詢
執行單位:國立政治大學地政學系
中 華 民 國 97 年 2 月 7 日
2
摘要
本研究以福山試驗林為研究試區,蒐集多源遙測資料,包括:衛星影像、航空照片影 像、空載光達掃描資料等,以瞭解不同遙測資料於森林資源調查之應用潛力與限制,以及 結合多源遙測資料以提升資料分析結果之精度的可行性。本年度之工作重點為建立研究試 區之基本地形資料與植群調查資料庫,並利用數值航測與光達資料分析技術產生林分高度 模型,以及利用自由軟體建立植群調查資料 WebGIS 系統。林冠高度模型可由數值表面模 型推估,結果顯示以光達資料推估林冠高度模型之精度較航測自動匹配所產生之林冠高度 模型為佳,但於密林區因雷射光束穿透林冠之點雲密度不足,仍難以獲得精確的地面高程 推估值。另一方面,以自由軟體建立 WebGIS 系統,可節省購置商業軟體之經費,對於學 術研究與實務應用上均有其價值。 關鍵詞:空載雷射掃描(空載光達)、林冠高度模型、數值航測、數值表面模型、數值高程模 型。Abstract
The Fushan Experimental Forest was selected as the experimental site for this research. Multisource remote sensing data including satellite images, aerial photographs, and airborne lidar data were used in the study in order to understand the potentials and limitations of using different source of remote sensing data in forest resources inventory, and the feasibility of integrating multisource remote sensing data to improve the accuracy of data analysis. Major tasks of this research included establishing topographic database and forest inventory database; producing forest canopy height model by using both digital photogrammetric technique and lidar data analysis technique; and building a WebGIS for the forest inventory database using freeware. The forest canopy height model can be estimated by using digital surface model (DSM). The results indicate that the forest canopy height model derived using lidar data has better accuracy than that of the automatic matching technique used in digital photogrammetry. In those areas with dense vegetation, however, the density of lidar ground points was insufficient due to the fact that the laser pulses could not penetrate the forest canopy and reached the forest floor. Therefore, it was difficult to obtain accurate estimation of the ground elevation. Moreover, using freeware to establish a WebGIS can save the cost for purchasing commercial software product, which is worthwhile both for academic research and practical applications.
Key words: airborne laser scanning (airborne lidar), forest canopy height model, digital
1. 前言
遙測技術能迅速獲取大面積的資料,具 有節省人力、物力、經費與時間的優點,以 往在森林資源調查、環境變遷監測、災害調 查等方面已經有許多成功的應用實例。各種 遙 測 技 術 在 應 用 上 或 多 或 少 都 有 其 限 制 性,但彼此間也存在互補性,因此結合不同 來源遙測資料常可獲得更佳的結果。 台灣於 1950 年代引進航測技術,即為 了調查台灣森林資源之分布與土地利用情 形,首次利用空中照片進行林型判釋與土地 利用分類,並獲得良好成果,此後航測技術 即成為農、林調查上不可或缺之技術(楊榮 啟、林文亮,2003;焦國模,1993;林務局, 1995) 。航測技術可以獲得大比例尺的影 像,為辨識與測繪地形地物之有力工具,但 因影像涵蓋範圍較衛星影像小,調查範圍若 很大,仍需拍攝很多航照,且僅能獲得地物 表面之影像,無法獲得林冠之下的地面資 料。 美國於 1972 年發射 LANDSAT 資源衛 星,台灣即開始應用衛星遙測技術於各種領 域,包括:自然資源調查、森林火災調查、 野生動物棲息地調查、植生綠度分析、生態 環境變遷監測等。近年來遙測技術發展迅 速,遙測影像的光譜解像力與空間解像力均 提高甚多,如:QuickBird 衛星影像可達約 61cm 的空間解像力,WorldView-1 之空間解 像力更提高至 50cm,使得遙測技術對不同 地物之辨識能力大為增加,更大幅提昇遙測 技術之實用性。遙測技術有許多優點,然而 地形遮蔽與天候之影響,亦使其應用受到限 制。此外,由於多光譜影像對於植生覆蓋之 穿透能力不佳,因此無法直接測得林分結 構,其他如林分材積、生物量等森林資源重 要資訊,也僅能藉由模式間接推估(詹進 發,2005)。 空載雷射掃描(LIDAR,LIght Detection And Ranging)為主動式(active)遙測技術,由 於 LIDAR 遙測技術具有高解像力與穿透能 力,因此在國外各種不同學術研究領域均普 遍受到重視。國內於 2002 年四月間由農委 會引進 LIDAR 進行九二一地震災區形變測 量,此後即有以 LIDAR 資料進行研究之成 果陸續發表(詹進發,2005)。光達資料結合 遙 測 影 像 不 僅 可 供 測 繪 森 林 資 源 分 布 情 形,亦可供推估林分結構、樹冠高度、生物 量與林分蓄積,因此在林業之應用上可提供 更豐富的資源資訊,已成為航遙測技術發展 與應用上之重要研究課題(Harding et al., 2001; Lefsky et al., 1999; Lefsky et al., 2002; Lim et al., 2003; Næsset, 1997;詹進發, 2005)。本文主要目的乃在於探討以光達資料 與航測技術推估樹冠高度模型之方法,並評 估其準確度。此外,亦探討如何利用自由軟 體 (freeware) 建 構 網 際 地 理 資 訊 系 統 (web-based GIS, WebGIS)。
2. 研究材料與方法
2.1 研究材料
2.1.1 空載光達資料
空 載 光 達 系 統 主 要 包 括 雷 射 掃 描 儀 (laser scanner)與載具方位記錄系統(aircraft position and orientation system, POS),藉由全 球 定 位 系 統 (GPS) 量 測 載 具 之 空 間 位 置 (latitude, longitude, altitude),慣性量測系統 (inertial measurement unit, IMU)記錄載具姿 態(roll, pitch, heading),以及量測掃描儀與地 面的距離與掃描角度,便可解算反射雷射脈 衝之地面點的三維空間座標。為精確解算載 具之空間位置座標,在地面需架設 GPS 參 考站,於系統對目標物掃描時同步接收 GPS
衛星訊號,系統運作之架構如圖 1 所示 (Leica Geosystems, 2003;史天元、彭淼祥, 2002)。 圖 1. 空載光達系統架構圖 2.1.2 航空照片 為了解研究試區之林冠高度模型以及 過去幾年間的變化,本研究蒐集試區之航空 照片,以數值航測技術分析空照數位影像, 製作不同時期之林冠高度模型與試區正之 射影像圖。 2.1.3 圖籍資料與地面樣區調查資料 為檢核雷射掃描資料之估測成果,本 研究另取得多項圖籍資料包括:數值高程模 型、衛星影像、正射影像(1:5000)、地形圖 (1:1000)、行政區界圖、控制點圖與地面樣 區調查資料等,主要供判釋土地覆蓋類型、 座標校正與比較光達之測量成果。本研究並 蒐集福山長期森林動態樣區之調查資料,樣 區 中 每 一 株 胸 高 直 徑 (DBH, diameter at breast height)大於 1 cm 之林木均記錄其樹 種、胸高直徑,以及其空間坐標。 2.1.4 WebGIS 自由軟體工具 為建構 WebGIS 系統,本研究使用可免 費取得之自由軟體(freeware),包括:ZOPE, Plone, Python, PrimaGIS 等。
2.2 研究方法
本計畫之目的為應用雷射掃描技術獲 取林分之三維空間資料,並發展資料處理與 分析方法,期能迅速獲得精確之林分高度模 型,據以瞭解研究試區之林冠模型。研究流 程如圖 2 所示。 圖 2. 研究流程圖 蒐集與數化福山 長期森林動態樣區 基本圖籍資料 選定地面控制點 地面控制點測量 空載光達資料獲取 與航空攝影作業 光達資料與航照影 像分析 建立數值表面模型與製 作正射影像圖 分析光達點雲資料,萃 取林分高度模型 資料轉換、主題圖 層套疊分析 比較地面調查、光 達與航測資料,建 立以航遙測技術估 測林冠模型之模式3. 結果與討論
3.1 航空照片 本研究使用農航所拍攝之空中照片數 位影像檔,影像解析力為 21μm,涵蓋福山 試驗林與長期森林動態樣區,91、92、94 年拍攝之照片共 56 幅。 3.2 福山長期森林動態樣區地面調查資料 本研究所收集之福山長期森林動態樣 區地面調查資料包括:每木調查資料、地形 資料、樹種名錄,均已匯入地理資訊系統, 可透過 GIS 軟體與其他相關圖籍資料進行 套疊分析,以及交互查詢空間資料與屬性資 料。 圖 3. 每木調查資料 圖 4. 地形資料 圖 5. 每木調查樹種名錄 圖 6. 福山長期森林動態樣區樣木圖檔 3.3 數值航測成果 本研究以 Leica LPS 航測軟體進行空中 三角測量,並由航照立體模型以自動匹配方 式產生數值表面模型(digital surface model, DSM)與正射影像。圖 8. 94 年正射影像 3.4 光達資料分析 本研究以 TerraScan 軟體將原始資料分 類,可獲得地面(ground)與覆蓋面(surface) 點雲資料,點雲資料之剖面如圖 9 與圖 10 所示。 圖 9. 光達點雲資料剖面圖(林地) 圖 10. 光達點雲資料剖面圖(建物) 3.5 林分高度模型推估 欲從空載雷射掃描獲取之龐大的離散 三維點雲資料中獲取林分高度模型,必須先 於其中分離出地面點及非地面點如:植被、 建物等,並進一步內插使成為常用等間距之 網 格 (Grid) 形 式 或 是 不 規 則 三 角 網 (TIN, Triangulated Irregular Network),進而建立有 效 之 DEM (digital elevation model) 與 DSM,兩者之差距即可供推估林分高度模 型。綜合三條航帶之點雲資料,以 1m x 1m 為網格單元,計算各網格中點雲資料之最低 高程與最大高程,分別代表地面高程與林分 高度之估測值,並與利用 94 年度航空照片 以航測方法製作之 DSM 做比較,其結果如 圖 11-12 所示。 圖 11. 由 94 年度航空照片製作之 DSM 圖 12. 由光達點雲資料萃取之 DSM
為比較航測與光達測量林冠高度模型 之結果,將兩種方法所獲得之 DSM 相互比 較,以光達之 DSM 減去 94 年度航空照片經 航測程序獲得之 DSM,兩者之差距介於 -32.449m 至 20.532m 之 間 , 平 均 值 為 0.097m,即光達之 DSM 平均高於航測之 DSM 約 9.7cm,其統計值如表 1。 表 1. 光達 DSM 與航測 DSM 之差 平均值 最小值 最大值 標準差 0.097m -32.449m 20.532m 3.119m 圖 13 為光達與航測所產生之 DSM 的差 值之分布圖,圖中顯示其分布近於常態分 布,差異極大者佔極少數。光達測得林木高 度之誤差,以及航測影像自動匹配所產生之 DSM 的誤差,可能造成兩者所獲得之林冠 高度有所差異。一般而言,光達所測得之點 位座標,其高程精度優於平面精度,高程值 的誤差介於 10 至 30cm 之間(史天元、彭淼 祥,2003;Leica Geosystems, 2003)。航測的 高程誤差則約為等高線間距之 1/2,因此光 達測得之 DSM 精度應較航測之 DSM 為佳。 圖 13. 光達與航測所產生之 DSM 的差值之 分布圖 3.6 WebGIS 系統建置 本 研 究 以 自 由 軟 體 建 構 一 森 林 資 源 WebGIS,以福山森林動態樣區為例,建立 一個透過網際網路即可操作之介面,包含圖 層展示與套疊,空間與屬性資料查詢,資料 的上傳與下載等功能;在管理方面,提供森 林資源管理系統,方便管理者處理大量的調 查資料,以利日後的經營與規劃。 圖 14. WebGIS 管理者操作介面 圖 15. WebGIS 使用者操作介面 圖 16. WebGIS 圖層展示介面
4. 結論
1. 本研究所取得之空載光達資料點雲密度 約為 2 pt/m2,用於推估研究試區之數值 高程模型仍因植被過於茂密而難以獲得精確結果。若能測得準確之地面高程, 便可精確推估樹高,未來研究應提高光 達掃描密度,並嘗試以內政部測製之 5m 高精度數值高程模型與地面實測高程資 料作為輔助資料,以提高數值高程模型 估測之精度。為取得精確的地面實測高 程資料,本研究仍持續進行地面高程測 量工作。 2. 光達技術可用於估測林分高度模型,與 航測自動匹配產生之 DSM 相較,其差值 近 乎 常 態 分 布 , 兩 者 之 差 異 介 於 -32.449m 至 20.532m 之間,平均光達之 DSM 高於航測之 DSM 約 9.7cm,標準 差為 3.119m。兩種方法所獲得之 DSM 的差異可能受地形遮蔽、航照影像自動 匹配演算產生之誤差等因素之影響,至 於兩者之差距究竟是量測誤差所造成, 亦或確實為林冠高度在兩次資料獲取期 間之自然變化,以及其差距與空間分布 之關係,未來應多蒐集林木高度資料作 為驗證基礎,以提高估測之精確度。 3. 本研究用以建構 WebGIS 之軟體,皆為 開 放 原 碼 (open source) 之 自 由 軟 體 (freeware),對於程式開發而言,管理者 不需受限於如一般商業軟體之限制,可 自由進行編輯修改。以福山森林樣區之 資料為基礎,本研究期望能建立一網路 介面,將森林資源調查資料做分享,不 論是基本的瀏覽查詢,或進一步的統計 分析,使用者不需購買昂貴的 GIS 軟 體,只要上網便可對其所需資料作查 詢。且操作容易,不同於傳統的 GIS 軟 體,需要學習複雜的操作方法,Web GIS 的介面清晰易懂。 4. 自由軟體不論在作業系統、軟體開發工 具、應用軟體等方面,近年來都有明顯 的進步,甚至於在 GIS 應用的專業領 域,也有許多適用於單機作業與網路伺 服系統的免費 GIS 與遙測影像分析軟體 可供使用,基於科學研究上的需要,以 及考量節省購置商業軟體所需之龐大經 費,應推廣使用自由軟體,並鼓勵開發 各式工具,以促進自由軟體之應用與發 展。
謝誌
本研究承蒙行政院國家科學委員會計 畫補助(NSC 95-2313-B-004-001),行政院農業 委員會林務局、林業試驗所、農林航空測量 所等提供資料,始得以完成,謹此致謝。參考文獻
史天元、彭淼祥,2002,九二一地震災區空 載雷射掃描作業成果初步報告,第二十 一屆測量學術及應用研討會論文集,交 通大學,台灣新竹,449-456。 史天元、彭淼祥,2003。空載雷射掃描數據 精度評估程序之研究,第二十二屆測量 學術及應用研討會,中正理工學院,台 灣桃園,247-256。 林務局,1995。第三次台灣森林資源及土地 利用調查,行政院農業委員會林務局。 焦國模,1993。森林航空測計學,國立編譯 館。 詹進發,2005。空載雷射掃描資料於推估樹 冠 高 度 之 應 用 , 航 測 及 遙 測 學 刊 , 10(1):1-14。 楊榮啟、林文亮,2003。森林測計學,國立 編譯館。Harding D. J. , M. A. Lefsky , G. G. Parker, J. B. Blair, 2001, Laser Altimeter Canopy Height Profiles Methods and Validation for Closed-Canopy, Broadleaf Forests, Remote Sensing of Environment ,
76:283-297.
Lefsky, M.A., W.B. Cohen, A. Hudak, S. A. Acker, J. Ohmann. 1999. Integration of lidar, Landsat ETM+ and forest inventory data for regional forest mapping. ISPRS Workshop: Mapping Forest Structure and Topography by Airborne and Spaceborne Lasers, November 9-11, La Jolla CA. Lefsky, M.A., W.B. Cohen, G.G. Parker, and
D.J. Harding, 2002. Lidar Remote Sensing for Ecosystem Studies. BioScience, 52(1):19-30.
Leica Geosystems, 2003. ALS50 Airborne Laser Scanner Product Description, Atlanta, Georgia: Leica Geosystems, 1-10.
Lim, K., Paul Treitx, Michael Woulder, Benoit St-Onge and Martin Flood, 2003. LIDAR remote sensing of forest structure. progress in physical Geography 27( 1):88-106.
Næsset, E., 1997. Determination of mean tree height of forest stands using airborne laser data, ISPRS Journal of Photogrammetry & Remote Sensing, 52:49-56.
Sithole, G., and G. Vosselman, 2003. Comparison of Filtering Algorithms, Proceedings of the ISPRS working group III/3 workshop, 3-D reconstruction from airborne laser scanner and InSAR data, Dresden, Germany, 8-10 October 2003. Smith, G, A. Persson, J. Hohmgren, B.
Hallberg, J.E.S. Fransson, and L.M.H. Ulander, 2002. Forest Stem Volume Estimation Using High-Resolution Lidar and SAR Data, Geoscience and Remote Sensing Symposium, IGARSS’02, 2002 IEEE International, 4:24-28.
St-Onge, B. A. and N. Achaichia. 2001. Measuring forest canopy height using a combination of LIDAR and aerial photography data, Workshop on Land Surface Mapping and Characterization Using Laser Altimetry, Annapolis, Maryland, USA, October 22-24, 2001. Utkin, A.B., A.V. Lavrov, L. Costa, F. Simoes,
and R. Vilar, 2002. Detection of small forest fires by lidar, Applied Physics B, 74:77-83.
計畫成果自評
本研究之目的為結合多種遙測資料以 應用於森林資源調查,各種遙測技術所獲得 之資料包括:衛星遙測影像、航空照片、空 載光達、地面光達等,均有其應用潛力與限 制,若能整合應可發揮最大的功效。本文呈 現初步的研究成果,研究結果應可提供這方 面相關研究作為參考。初步成果已在國內與 國際學術研討會中發表論文,未來將持續收 集更多資料,進行更嚴密的比較分析,期能 在學術期刊發表成果。出席國際學術會議心得報告
計畫編號 NSC 95-2313-B-004-001- 計畫名稱 應用多源遙測資料於森林資源調查之研究 出國人員姓名 服務機關及職稱 詹進發 國立政治大學地政學系副教授 會議時間地點 12-16 November 2007 Kuala Lumpur, Malaysia會議名稱 (中文)第 28 屆亞洲遙測研討會
(英文) The 28th Asian Conference on Remote Sensing
發表論文題目
(中文)森林動態樣區開放源碼網際地理資訊系統之研究
( 英 文 ) BUILDING AN OPEN SOURCE WEBGIS FOR FOREST DYNAMICS PLOTS 此次亞洲遙測研討會在馬來西亞吉隆坡舉行,會議為期五天,總共與會發表論文人數約 七百餘人,主要參加國家為亞洲地區的國家,亦有少數歐美國家(如:美國、德國、荷蘭、芬 蘭、挪威等)的專家學者與會。台灣參加人數約 60 人,來自國內各大專院校與研究單位、行 政部門。會議主題涵蓋空間資訊領域的各種研究,如表 1 所示: 表 1. 研討會主題 A. Special sessions:
1. Innovative problem solving methodologies for Less Developed Countries 2. Spatial planning and decision support systems
B. GIS
1. Remote Sensing & GIS Integration 2. Spatial Database
3. GIS Decision Support and Models 4. Immersive Virtual GIS
C. Remote Sensing Applications
1. Hydrology
2. Agriculture, Soil & Crops 3. Disaster
5. Forestry
6. Climate/Environment
7. Coastal Zone
8. Ecology and Environmental Change
9. Geology
10. Archeology
11. Land Use/Land Cover
D. New Generation Sensors and Applications
1. Hyperspectral Sensing 2. Application of New Sensors 3. Airborne Sensing 4. Line Scanner 5. LiDAR 6. Digital Camera 7. Mobile GIS E. Data Processing 1. DEM/3D Generation 2. Change Detection 3. Data Fusion
4. Hyperspectral Data Processing 5. High Resolution Data Processing 6. Image Classification F. GPS & Photogrammetry 1. Navigation System 2. Digital Photogrammetry G. Other Topics 1. Capacity Building
本次研討會之主辦單位為亞洲遙測學會(Asian Association on Remote Sensing)與馬來西亞 的遙感探測中心(MACRES, Malaysian Centre for Remote Sensing),會議地點在 Putra World Trade Centre。會場之硬體設施相當不錯,且主辦單位延續亞洲遙測研討會之傳統,雖然與會 者之報名費僅美金 100 元,但在開會期間仍提供豐富的餐飲給所有與會者,讓參予會議的人 除了學術上的經驗交流之外,還可以享受馬來西亞的傳統美食。惟會場在網際網路設施的提
供上稍嫌不足,因此在上網方面有些限制,此乃美中不足之處。 一、與會心得 1. 本次會議的主辦國家為馬來西亞,對於籌劃大型國際會議之經驗較去年的蒙古為佳,因 此在會議資訊的提供、論文審查等方面,均較上軌道。但是在論文審查結果之通知上有 所延誤,且發生不少錯誤,導致議程安排上有些紊亂。此外,當地旅館訂房的服務亦有 些問題,因此在行程與住宿安排上均遭遇一些困難,幸好最後都能解決。我國將於 2011 年接辦亞洲遙測研討會,諸如此類之問題,日後應當設法避免。 2. 馬來西亞為回教國家,主辦單位所安排的開幕演出節目與開會期間的餐點,均充滿著濃 厚的馬來西亞風味。與會的各國代表多數為學校的教授與學生,以及政府機關的相關專 家,文化交流之夜各國代表均賣力演出,呈現本國的文化、傳統之特色。台灣、日本學 生所表現的青春活力、創意與團隊合作精神,尤其令人覺得印象深刻。本次台灣的表演 節目由中央與成功大學的學生擔綱,學生表演熱舞,展現無間的團隊合作默契,其活潑 熱情與頗具創意的舞步、服裝設計,贏得無數的掌聲,最後得到大會表演第一名的榮譽, 使所有參與的團員都感到很光榮。 3. 文化交流之夜在輕鬆的氣氛之下,讓所有與會者可以一窺各國文化的特色,另一方面, 在研討會期間看到遙測科技在許多不同領域的應用實例,以及與會各國專家的熱烈交 流,對於學術交流與各國人民間的互相了解,都是很好的機會。我認為應鼓勵國內年輕 的學子多參加此類研討會,以培養他們的國際觀,及拓展他們在學術研究上的視野。 4. 主辦單位有安排參觀馬來西亞遙感探測中心的衛星接收站,展示接收衛星訊號的實際操 作情形,看到巨大的碟型天線靈活的運轉,讓與會者大開眼界。此外,也安排參觀大象 的保育中心,讓與會者了解馬來西亞在保育野生動物方面的努力成果,這些都是參加此 次研討會的額外收穫。 5. 此次會議主題涵蓋範圍甚廣,包括各種航遙測技術與空間資訊領域的研究與應用。與會 學者專家來自世界各國,雖有不同的文化背景、使用不同語言,以及不同的專長領域, 惟對於科學探索的熱忱則為共通的特質。參與研討會,看到許多學者熱心的貢獻研究心 得,其對於科學研究的執著,以及樂於與他人分享研究心得的無私精神,著實令人感佩。 從研討會的論文發表與討論中,也可以知悉學術研究的發展趨勢,對於未來的研究也有 啟發作用。 6. 亞洲遙測研討會提供一個讓從事遙測研究的各國人才進行學術交流的平台,從參加的各 國代表中可以看出較先進的國家有較多的學生參與,如:台灣、日本、韓國、香港、新 加坡均有大量的學生與會,顯現先進的國家多數較重視人才的培育。個人覺得類似的研 討會應鼓勵年輕學子參與,讓他們有機會接受更多的刺激,以及拓寬視野,將有助於長 期在學術研究上的發展。 二、攜回資料名稱及內容 研討會論文集光碟,以及開會時所蒐集之報告、遙測系統簡介資料。 三、報告內容如附件。
BUILDING AN OPEN SOURCE WEBGIS FOR FOREST DYNAMICS PLOTS
Jihn-Fa JAN (Taiwan)
Associate Professor, Department of Land Economics National Chengchi University
64, Sec. 2, Chih-Nan Road, Taipei 116, Taiwan
Telephone: +886-2-29393091 ext. 51647 Facsimile: +886-2-29390251 E-mail: [email protected]
Hao-Hsiung HUANG (Taiwan)
Associate Professor, Department of Land Economics National Chengchi University
64, Sec. 2, Chih-Nan Road, Taipei 116, Taiwan
Telephone: +886-2-29393091 ext. 50606 Facsimile: +886-2-29390251 E-mail: [email protected]
Sheng-Hsin SU (Taiwan)
Assistant Scientist, Fu-Shan Research Center Taiwan Forestry Research Institute 53, Nan-Hai Road, Taipei 100, Taiwan
Telephone: +886-3-9228900 ext. 590 Facsimile: +886-2-23142234 E-mail:[email protected]
Li-Hao KUAN (Taiwan) Forest Planning Division
Forestry Bureau, Council of Agriculture 2, Sec. 1, Hangchou S. Road, Taipei 100, Taiwan
Telephone: +886-2-23515441 ext. 609 Facsimile: +886-2-23519702 E-mail: [email protected]
KEY WORDS: forest dynamics plot, LiDAR, photogrammetry, forest canopy
ABSTRACT: The objective of this study is to build a WebGIS for forest dynamics plots in Taiwan.
Forest dynamics plots (FDPs) are characterized by large plot size and standardized procedure for field data collection. A total of 13 FDPs with areas larger than 1 hectare have been established in Taiwan, among them the 25-hectare Fushan site is the largest. Every tree within these plots were sampled, and the species name, location, height, and DBH were recorded. The census of tree samples in the FDPs is done every five years, which result in a huge tree database valuable for scientists of various disciplines. As a pilot study, this study utilized a combination of open source software, i.e., PrimaGIS, Plone, and Zope, to build a WebGIS (web-based geographic information system) for the Fushan FDP in Taiwan. The WebGIS provides easy access for tree database and integration of various spatial and attribute data from different sources. In addition, by overlaying the tree data with satellite images, aerial photos, and a variety of thematic maps, the WebGIS can help
the scientists address research problems on more solid scientific basis.
1. INTRODUCTION
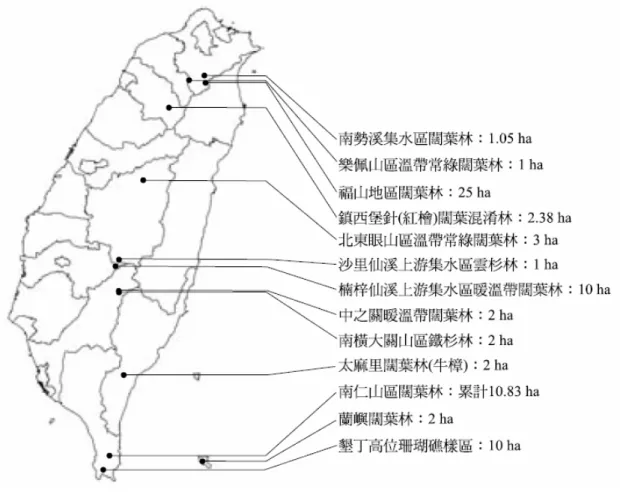
The Center for Tropical Forest Science (CTFS) program of the Smithsonian Tropical Research Institute (STRI) consists of a network of large-scale Forest Dynamics Plots (FDP) including 18 sites in 15 countries. The CTFS program is unique because each plot uses a standardized sampling methodology, which allows scientists to directly compare data collected at different sites. Using data from the network of field sites, the scientists can understand the forest diversity and change in Asia, Africa, and Latin America (CTFS, 2006). In 1989, researchers from Tunghai University and STRI initiated a 3-ha Forest Dynamics Plot in Najenshan Nature Reserve, Taiwan. Since then, with the joint efforts of many researchers from different institutions, a total of 13 Forest Dynamics Plots were established in Taiwan (Fig 1). Among these plots, the Fushan Nature Reserve site is the largest with an area of 25 hectares (Sun, 2006; Hsieh, 2006).
Fig 1. The Forest Dynamics Plots in Taiwan (Hsieh, 2006)
The data collected at different FDP sites form an invaluable database for forest related studies and regional forest management. Furthermore, the database provides ground truth data that are required for large-scale forest inventory using remote sensing data such as satellite imageries, aerial
photographs, radar data, and LiDAR (Light Detection And Ranging) data. By integrating remote sensing data and field data collected from Forest Dynamics Plots with other geographical data such
as topographic maps, soil maps, terrain data, and forest types, the scientists can address various problems from different perspectives at a broader scale. However, the field data must be registered to a coordinate system common to the other relevant data. To obtain a low-cost and robust system that can support the scientists of various disciplines, this research utilized open source software to establish a WebGIS (web-based geographic information system) for the FDP site in the Fu-shan Nature Reserve.
2. MATERIALS AND METHOD
2.1 Study area
The Fushan FDP was initiated in 2002. This site is located near the Fusan Experimental Forest, which is managed by the Taiwan Forestry Research Institute (TFRI). The experimental forest is located at 24°46’N, 121°43’E. Among all the FDPs in the CTFS global network, the Fushan FDP has the highest latitude. The elevation of the experimental forest ranges from 400 to 1,400 meters with a total area of 1,097 hectares. The annual mean temperature is 20°C, and the annual mean
precipitation is 2,900 mm (TFRI, 2006).
2.2 Data
2.2.1 Vector data: Topographic maps and soil maps were obtained for the study area. These maps
show soil characteristics and various topographic features of the study area, which include streams, roads, contours, and forest types.
2.2.2 Raster data: Digital orthophoto maps and satellite imageries were used to identify the land
cover types within the study area. Digital elevation model (DEM) are useful for understanding the terrain relief of the study area. In addition, environmental factors such as aspect, slope, and curvature can also be derived from DEM.
2.2.3 Field data: During 2003-2004, the research team of the 25-hectare Fu-shan Nature Reserve
FDP site completed the first census of the trees within the site. Based on a standard protocol followed by all the FDP sites of the CTFS program, every tree with DBH (diameter at breast height) larger than 1cm was measured and tagged. The species of each tree was identified, and the DBH and location of the tree was measured. A total of 114,508 trees was recorded, which belong to 110 species. In addition, a total of 1,705 ground points within the FDP were sampled, and the elevations of these points were measured using a total station. These ground points were used to construct a TIN (triangulated irregular network) model and subsequently a 1-meter DEM (digital elevation model) were derived from the TIN model.
The main objective of this research is to establish a WebGIS for the FDPs in Taiwan. Although all the FDPs follow the same protocol to collect tree censuses, the field data are maintained by
researchers from different universities or research institutes. Therefore, integration of the field data from different FDP sites are complicated because different software and database systems are used among the researchers. Another obstacle for data integration is lack of common coordinate system for all the field data.
In order to create a low-cost and easy access system that is available for all FDPs stie, this research used open source software to design all the software components. Major software used in this research include PrimaGIS, Plone, and Zope. All software run on Linux operating system installed on an IBM compatible personal computer.
3. RESULTS
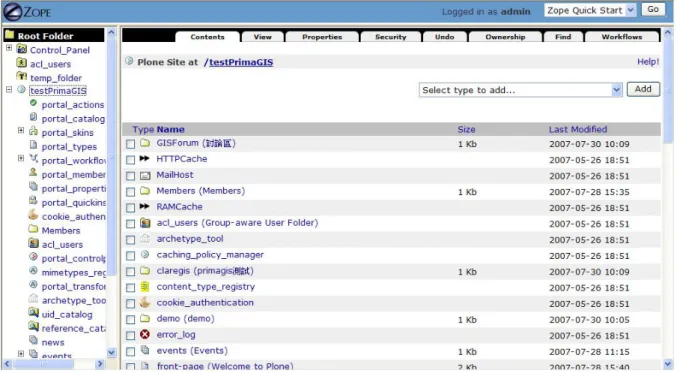
PrimaGIS is a web mapping application for Plone, a content management system built on the Zope application server. In addition, several software are required to support the functionalities offered by PrimaGIS. Due to deep dependency in the software configuration, it is difficult to setup a functional system. This study follows a much easier procedure to install all the required software components, i.e., the 'PrimaGIS Buildout' method by Lautaportti (2007) and SEA_RLC (2007). Zope is an application server for building web portals (Latteier et al., 2002). It has a built-in object database and numerous tools which make it ideal for developing a system that can manage field data of the FDPs as well as web contents. Fig. 2 shows the management interface of Zope.
Plone is a content management framework providing website managers with easy access tools to maintain and publish web pages (McKay, 2004). PrimaGIS enables spatial content types to be managed within the Plone framework. Together they provide users with friendly interfaces and tools for publishing spatial data from different sources, including shapefiles, PostGIS, rasters, WMS, WFS (Hänninen, 2006). Fig. 3 depicts tree samples within the Fushan FDP, with selected species shown in light-blue color.
Fig. 2. Management interface of Zope
Fig. 3. The map of tree samples within the Fushan FDP, with selected species shown in light-blue color.
The PrimaGIS/Plone/Zope combination provides ease of use interface for publishing spatial contents through the internet, which is very convenient to establish a WebGIS for various
applications. The results of this research show that it is feasible to create a low-cost WebGIS with minimal amount of efforts. With built-in object database and versatile application interface, the Zope system also allows users to develop sophisticated system to manage web contents, including spatial data and attribute data. In this pilot study of Fushan FDP site, the field data of FDP and various spatial data can all be integrated and managed by one system. Further research will focus on developing applications that can incorporate data of various sources from all the FDP sites in
Taiwan.
5. ACKNOWLEDGEMENT
The authors would like to thank the developers of all the open source software used in this study. We also appreciate the National Science Council and Forestry Bureau for sponsoring for this study.
6. REFERENCES
CTFS, 2007. CTFS web site: http://www.ctfs.si.edu, last accessed 25 July 2007.
Hänninen, K., 2006. PrimaGIS User Manual, URL:http://www.primagis.fi/documentation
Hsieh, T.H., 2006. The History and Experiences of Establishing Forest Dynamics Plots in Taiwan, Forestry Research Newsletter, 13(2):6-8.
Latteier, A., M. Pelletier, C. McDonough, and P. Sabaini, 2002. The Zope Book (2.6 Edition), URL:
http://www.zope.org/Documentation/Books/ZopeBook/
Lautaportti, K., 2007. The PrimaGIS buildout system,
URL:http://trac.gispython.org/projects/PrimaGIS/wiki/PrimaGISBuildout, last accessed 20 August 2007.
McKay, A., 2004. The Definitive Guide to Plone, Apress.
SEA-RLC, 2007. Plone PrimaGIS Installation Guidelines for Linux using the PrimaGIS Buildout method. URL:http://iwsea.org/IT/GIS/software/
Sun, I.F., 2006. A New Trend of Forest Ecology Research—Forest Dynamics Plot, Forestry Research Newsletter, 13(2):1-5.
TFRI (Taiwan Forestry Research Institute), 2006. Fu-shan Research Center: