Synthesis, Characterization, and Kinetic Study of
Compatible
SIN’S
Based on Diallyl Phthalate
and Epoxy Resin
MU-SHIH LIN* and CHINC-CHOU YEH
Department of Applied Chemistry, National Chiao Tung University, Hsinchu, Taiwan 30050, Republic of China
SYNOPSIS
Diallyl phthalate (DAP) was blended with diglycidyl ether of bisphenol A (DGEBA) in various weight ratios: 100/0, 75/25, 50/50, 25/75, and 0/100. These blends were then cured simultaneously with dicumyl peroxide (DCP ) and hexahydrophthalic anhydride (HHPA) in conjunction with 2-cyanoethyl-4-methyl immidazole (EMI-CN, 0.5% as cat- alyst ) to obtain simultaneous interpenetrating polymer networks ( S I N s ). H-bonding be- tween DAP and DGEBA was detected with FTIR. The SIN’s thus obtained were charac- terized with rheometric dynamic spectroscopy ( RDS ) and differential scanning calorimeter (DSC) to check the compatibility of components. Gel fractions were measured with a Soxhlet extractor. Viscosity increases of all SIN’s were measured with a Brookfield vis- cometer a t curing temperatures. Conversions of C = C and epoxide versus cure time were monitored with FTIR and kinetic parameters were calculated and discussed. Experimental results revealed that H-bonding in the DAP /DGEBA blends was evidenced from the shift of the IR band ( vc=o) to a lower wave number, as well as the shift of epoxide band ( va) to a higher wave number. Complete compatibility between DAP and DGEBA was supported from the single damping peak in DRS and single glass transition in DSC for each of SIN’s. Cure dynamic DSC showed shifts of exothermic peaks to higher temperatures for all SIN’s. During SIN formation, the slower viscosity increases of SIN’s were found, compared with pure DAP and pure DGEBA, indicating retarded cure rates for all SIN’s. In addition, lower gel fractions of SIN’s were observed, indicating incomplete cure of SINs. The retarded cure rate was further confirmed by kinetic study. Lower rate constants with higher activation energies for all SIN’s were found. An effect of network interlock was proposed to account for these findings. 0 1993 John Wiley & Sons, Inc.
Keywords: network interlock compatible viscosity increase SIN’s
I NTRO D U CTI 0 N
Although interpenetrating polymer networks ( IPN’s) are members of the large “polyblends”, 1-3 there is a significant difference between simple polyblends and IPNs. In general, multicomponent polyblends are more or less incompatible and thus are of microphase-separated structure. Compatible blends are not very common. To improve the com- patibility of a given polymer pair, various attempts
* To whom all correspondence should be addressed.
Journal of Polymer Science: Part A: Polymer Chemistry, Vol. 31,2093-2102 (1993)
0 1993 John Wiley & Sons, Inc. CCC 0887-624X/93/082093- 10
have been made. The use of interfacial agents (com- patibilizers) is one of the commonly employed ap- proaches; the incorporation of an attractive group for polymer-polymer interaction is a n ~ t h e r . ~ How- ever, IPN’s have unique characteristics in this re- gard. Crosslinking of either component tends to promote phase continuity. IPN materials with both polymers crosslinked tend to develop dual-phase continuity and thus improve the compatibility of the constituent polymers.
In our previous studies on compatible SIN ma- terials, 6-7 we found a much lower viscosity increase for SIN samples, compared with those of single con- stituent network formation. We proposed that net- work interlock probably played an important role
2094 LIN AND YEH
in governing the viscosity increase and that this network interlock should affect the kinetics during SIN formation. To understand such a possible effect, we carried out the synthesis, characterization, and kinetic study of this compatible SIN system.
EXPERIMENTAL
Materials
Diallyl phthalate (DAP) and dicumyl peroxide (DCP) were purchased from TCI and Merck Co. DCP was recrystallized from ethanol/water (50/50 by volume) before use. Hexahydrophthalic anhy- dride (HHPA) and 2-cyanoethyl-4-methyl imidazole (EMI-CN) were obtained from Ta-Fan Co. (Tai- wan) and were used (respectively) as curing agent and catalyst for DGEBA. Epoxy resin (DGEBA, Epikote 815) with an epoxy equivalent weight (EEW) of 194.5 was bought from Shell Co.
Instruments
A FTIR spectrometer (Nicolet model 520) with a resolution of 0.5 cm-' was used to detect H-bonding. Samples were cast on KBr plates and were sand- wiched. Conversion ( a ) of C = C bond and epoxide were obtained from the FTIR difference spectra ( A t - A,)
,
using 1598 cm-' (benzene absorption) as the internal standardwhere A,
,
At, and A, are absorbance of C = C ( 1645 cm-' ) or epoxide (830 cm-' ) before cure, at cure time t, and after postcuring respectively; and C,, Ct,and C , are the concentrations of functional group
at each corresponding time.
DSC thermograms were recorded with a Seiko model AM 100 instrument, ranging from room tem- perature to 350"C, at a heating rate of 10"C/min under nitrogen atmosphere. Dynamic mechanical
behaviors of SINs were obtained with a RDS, Rheo- metric 11, a t 1 Hz of frequency, temperature ranged from -100 to 200°C. Gel fractions were measured with a Soxhlet extractor for 48 h continuous ex- traction with acetone as a common solvent for both DAP and DGEBA. Viscosity changes during SIN formation were measured with a Brookfield viscom- eter at different curing temperatures: 120,130, 140, and 150°C. Samples were prepared by casting the SIN'S in molds and cured at the aforementioned temperatures.
Preparation of SIN's
The liquid DAP was blended with liquid DGEBA in different weight ratios: 100/0,75/25,50/50,25/75, and 0/100. DCP (1% based on DAP), HHPA (based on stoichiometric EEW of DGEBA) , and EMI-CN (0.5% based on total weight of DGEBA and HHPA) were mixed to each blend. All blends were cast in molds and were cured simultaneously at 12OOC for 8 h. The SIN's were further postcured at 180°C for 2 h.
RESULTS AND DISCUSSION
The calculated solubility parameters for DAP, DGEBA, and HHPA by Frisch's methodg are 9.39, 9.98, and 9.43, respectively. The close solubility pa- rameters would predict a possible miscibility of the three components. Fischer also reported the effect of solubility parameter and glass transition on the morphology of SINs to predict fully micissible IPNs."
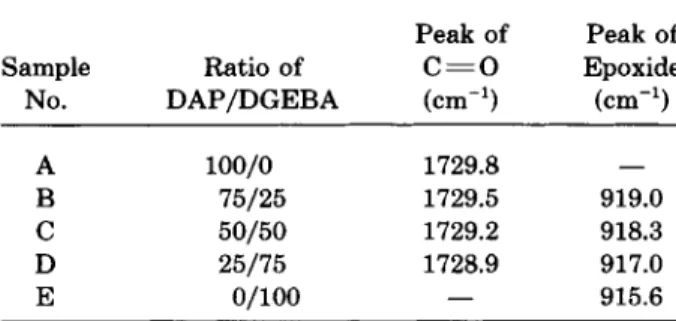
FTIR spectra indicated that the original absorp- tion peak of the unbonded C = 0 bond in DAP oc- curred at 1729.8 cm-', while the original absorption peak of H-bonded epoxide in DGEBA occurred at 915.6 cm-'. When various ratios of DAP/DGEBA were mixed, a new intermolecular H-bonding be- tween C = 0 of DAP and OH group of DGEBA re- placed the original intramolecular H-bonding in DGEBA as shown by the following:
COMPATIBLE SIN'S 2096 - - 0 COCH,CH=CH,
0';
COCH,CH=CH, 0 -Therefore, the carbonyl peak shifted to a lower wave number (Fig. 1 ) , while the epoxide peak shifted to a higher wave number (Fig. 2 ) . Table I lists the exact wave numbers of carbonyl and epoxide peaks for the various DAP/DGEBA ratios. Since the res- olution of the FTIR was set a t 0.5 cm-', and the exact peak location was found by the instrument
C A R B O N Y L GROUP
s.
~ . . . . : . . . . : . . . . : . , . . I
la00 1750 1700 1650 1600
W a v e n u m b e r ( c m - 1 )
searching system, the result is believed to be reliable. This intermolecular H-bonding is believed to further promote the miscibility of DAP and DGEBA in mo- lecular scale.
Figure 3 shows the dynamic DSC thermograms of the SIN curing behaviors. DAP (curve A ) shows a maximum exothermic peak at 183.7'C, while the maximum exothermic peak of DGEBA occurs a t a lower temperature of 171.3"C (curve E ) . Surpris- ingly, when DGEBA and DAP were mixed and
EPOXY GROUP
r , , , , , , I I , , I I I I I I I 1 I I
960 940 920 900 880
Wavenumber (cm-I )
Figure 1. Shift of absorption peak for C = O bond in FTIR. DAP/DGEBA = ( A ) 100/0, ( B ) 75/25, ( C ) 50/ 50, ( D ) 25/75.
Figure 2. Shift of absorption peak for epoxide group inFTIR. DAP/DGEBA = ( A ) 75/25, ( B ) 50/50, ( C ) 25/ 75, ( D ) 0/100.
2096 LIN AND YEH
Table I. in FTIR Spectra
Shifts of C = O and Epoxide Groups
Peak of Peak of
Sample Ratio of
c=o
EpoxideNo. DAP/DGEBA (cm-') (cm-') A 100/0 1729.8 - B 75/25 1729.5 919.0 C 50/50 1729.2 918.3 D 25/75 1728.9 917.0 E 0/100 - 915.6
cured, the maximum exothermic peak shifted to a higher temperature. The SIN'S of DAP/DGEBA = 75/25,50/50, and 25/75 shifted maximum peaks to 184, 187.2, and 185.5"C' respectively. As men- tioned earlier, the intermolecular H-bonding prob- ably restricted chain mobilities of both DAP and DGEBA. Furthermore, an additional barrier due to possible network interlock ( mutual entanglement ) would provide a sterically-hindered environment for cure reactions. Network interlock and decreased chain mobility would retard cure rates and could be possibly compensated by raising the cure tempera- ture; therefore, higher maximum curing peaks were observed for all SIN'S. Other similar phenomena were found in our laboratory.6 The observed exo- thermic peaks are all single shapes; presumably all samples are of homogeneous single-phase materials. Figure 4 shows the RDS of the SIN samples. A
maximum damping peak at 182°C for DAP (curve A) and a maximum damping peak a t 103°C for DGEBA (curve E ) are found. Each of other SIN's indicates a single damping peak a t 100°C (curve B, DAP/DGEBA = 75/25), 70°C (curve C, DAP/ DGEBA = 50/50), and 98°C (curve D, DAP/ DGEBA = 25
/
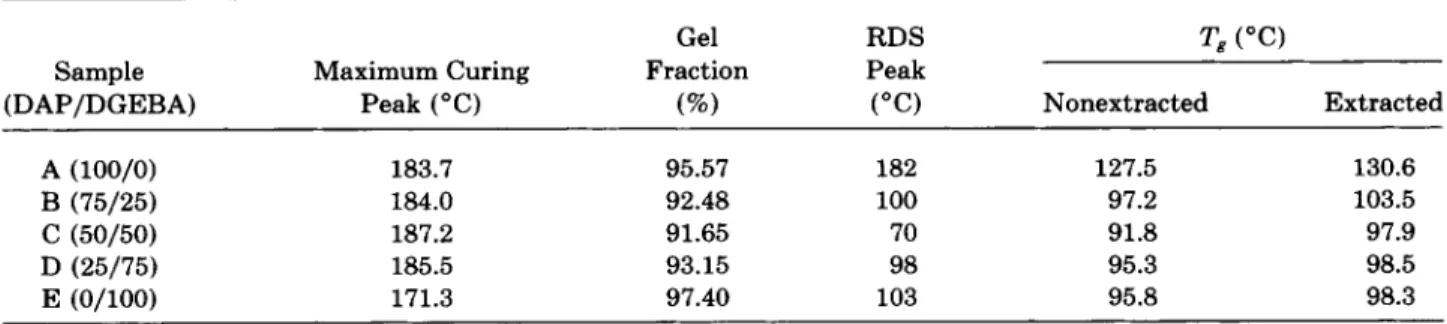
75). Table I1 lists the gel fractions for the SIN system. Each SIN apparently shows a lower gel fraction than its components, especially for the SIN of equal parts of components (sampleC ) , presumably because large steric hindrance due to network interlock make it difficult to complete cure. Sample C is believed to have the largest extent of network interlock during cure reaction because it contained the largest extent of chain entanglement between DAP and DGEBA. Therefore, sample C is expected to be the most difficult for complete cure, thus showing the lowest gel fraction.
Acetone is a common solvent for both uncured DAP and DGEBA. After SIN samples were contin- uously extracted with acetone for 2 days, the ex- tracted samples indicated higher
Tg's
than the cor-responding nonextracted ones. Figure 5 shows DSC thermograms of SIN's for both extracted and non- extracted samples. It is noted that all samples have single Tg's, indicating good compatibility between DAP and DGEBA. Nonextracted DAP has a Tg's of 127.5"C' compared with 130.6"C for the extracted sample; while nonextracted DGEBA has a
Tg
of 95.8"C, compared with 98.3"C for the extracted DGEBA. Nonextracted compositions B (DAP/ DGEBA = 75/25), C (DAP/DGEBA = 50/50), and D (DAP/DGEBA = 25/75) haveTg's
of 97.2, 91.8, and 95.3"C, respectively; while the corre- sponding extracted samples have Tg's of 103.5,97.9, and 98.5"C, respectively. Clearly, nontracted sam- ples have lower Tg's, presumably, partly because the uncured DAP and/or DGEBA act as plasticizers to the SIN'S. Furthermore, since SIN's have lower gel fractions, they may contain lower crosslinking den- sities, thus significantly lowering the transition temperatures as observed in RDS and DSC. Again, composition C shows the lowestTg
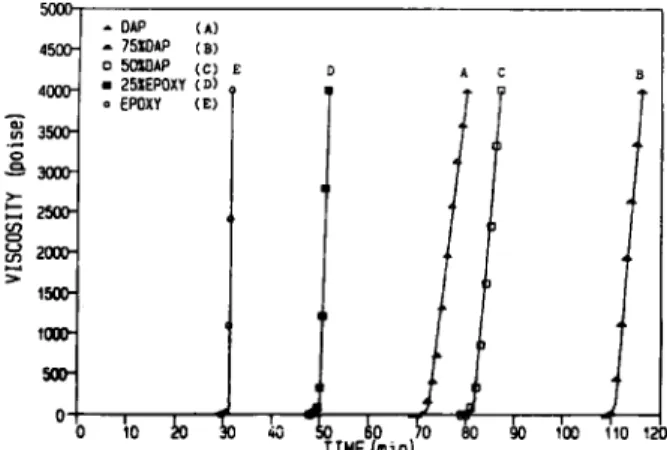
and lowest damping peak, because it contains the lowest gel fraction, due to the possible highest extent of net- work interlock between DAP and DGEBA. Both RDS and DSC evidence are in good agreement and strongly support the compatibility of the SIN sys- tem. One single transition for each SIN suggested that each SIN is of single-phase material. This ar- gument agrees well with Fischer's report dealing with the effect of solubility parameter and glass transition to predict fully miscible IPNs."Figure 6 shows the viscosity increases of the S I N s cured at 150°C. DGEBA (curve E ) shows the fastest
8
9 8 . 0 1 y . s
TEMP C 23! . 3
Figure 3. Exothermic curing peaks for SINs. DAP/
DGEBA = ( A ) 100/0, ( B ) 75/25, ( C ) 50/50, ( D ) 25/75,
COMPATIBLE SIN's 2097
-1 00 -40 20 80 140 200
TEMP., "C
Figure 4.
( C ) 50/50, ( D ) 25/75, ( E ) 0/100.
Damping peaks in RDS for SINs. DAP/DGEBA = ( A ) 100/0, ( B ) 75/25,
viscosity increase with a pot-life of 8 min. DAP (curve A) also indicates a fast cure behavior with a pot-life of 10 min. For the other SIN's, the viscosity increases are much slower. Compositions B, C, and D have a pot-life of 15,17, and 13 min, respectively. It is noted that composition C indicates the slowest viscosity increase with the longest pot-life presum- ably because it has the largest extent of network interlock as discussed earlier. Again, the network interlock has a measurable effect on viscosity in- crease during cure reactions. Figure 7 shows the vis- cosity increases of the SIN'S cured a t 120OC. By comparison with 150°C, the initiator DCP decom- posed a t a much slower rate at 12OoC, and the rel- atively low concentration of peroxide caused DAP
cure at a lower rate, subsequently reflecting in a slower viscosity increase with a longer pot-life. Ap- parently, the cure rate of DAP largely dominated the viscosity increases of the SINs. Thus, the more DAP the SIN contains, the longer the pot-life it has. Nevertheless, the effect of network interlock on the slower viscosity increase is obvious for compositions B and C.
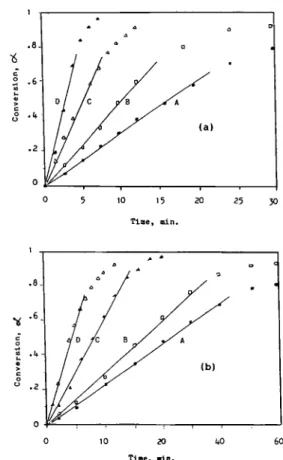
Figures 8 ( a ) and 8 ( b ) show typical difference spectra of epoxide and C=C bond. Figures 9 ( a ) and 9 ( b ) show plots of epoxide conversions versus cure time for DGEBA and for SINs. It is noted that, in general, DGEBA has higher cure rate than SIN'S. Many studies on kinetics of DGEBA cured by an- hydride can be found in the literature."-16 Tanaka
Table 11. Summary of Gel Fractions, Maximum Curing Peaks, Damping Peaks, and Glass Transitions
Gel RDS TB ("C)
Sample Maximum Curing Fraction Peak
(DAP/DGEBA) Peak ("C) (%) ("C) Nonextracted Extracted
A (100/0) B (75/25) C (50/50) D (25/75) E (0/100) 183.7 184.0 187.2 185.5 171.3 95.57 182 127.5 92.48 100 97.2 91.65 70 91.8 93.15 98 95.3 97.40 103 95.8 130.6 103.5 97.9 98.5 98.3
2098 LIN AND YEH I E X 0 4 H
I
ti E N D 0\
+
\.,
- -
A '1
- _
zn 65 I10 I 5 200 TrW C (VeatinglFigure 6. DSC thermograms showing T i s for nonex- tracted (A, B, C, D, E ) and extracted (A', B', C', D', E')
SIN'S. Same compositions as in Figure 4.
and Kakiuchi reported a first order on epoxide when DGEBA was cure by HHPA with tri-2,4,6-dimethyl- aminomethyl phenol; l5 while they reported a third
order on epoxide when DGEBA was cured by HHPA with triethylamine (catalyst) and alcohol (cocata- lyst ) .'la In a case where epoxide was cured by HHPA in conjunction with tertiary amine as catalyst, Fischer lo and Antoon and Koenig12 found a zeroth
order on epoxide with the reaction rate depending only on the catalyst ( a tertiary amine)
.
We found that when DGEBA was cured with an equimolar mixture of HHPA alone, the cure rate was too slug- gish to be detected. Therefore, 0.5% of EMI-CN ( a tertiary amine) , was added as a catalyst in our ex- periment. Kinetic data were tested and applied to different orders of epoxide. However, the best-fitted rate expression was a zeroth order on epoxide up to about 70% of conversion; beyond 70%, deviations were found. Our result is in good agreement withFigure 6. Viscosity increases for SIN'S cured at 150°C. DAP/DGEBA = ( A ) 100/0, ( B ) 75/25, ( C ) 50/50, ( D ) 25/75, ( E ) 0/100.
the reports of Fischer" and Antoon and Koenig.12 The kinetic data fitted a zeroth order on epoxide:
Integration of this expression gives
by neglecting epoxide concentration after postcure, [El,. Here [El,, [ E l , and k are the concentration of epoxide a t initial, time t , and rate constant, re- spectively. The value of
k/[
Elo can be obtained from slopes of straight lines at various temperatures [Fig. 9 ( a ) and 9 ( b )1.
Activation energies for DGEBA and for each SIN can be calculated from an ArrheniusFigure 7. Viscosity increases for SINS cured at 120°C. DAP/DGEBA = (A) 100/0, ( B ) 75/25, ( C ) 50/50, ( D ) 25/75, ( E ) 0/100.
COMPATIBLE SIN's 2099
'
A5-A0 1 -1 .z 0 0 5 10 15 20 25 30 Time, min.Figure 8. ( a ) Typical difference spectra of epoxide a t
830 cm-' , (A, - A,), and ( b ) difference spectra of C = C bond a t 1645 cm-', using the absorbance of benzene a t 1598 cm-' as internal standard ( t , in minutes).
plot (Fig. 10). The calculated kinetic parameters for epoxide are given in Table 111. By comparison with DGEBA, lower rate constants with higher ac- tivation energies were found for all SIN's. It is also noted that the more DAP the SIN contains, the lower rate constant and the higher activation energy the SIN has. This is probably due to an increase in steric hindrance when another DAP network is present during curing of DGEBA, i.e., the network interlock effect. Network interlock not only provides a sterically-hindered environment for cure reactions, but also may restrain DGEBA chain mobility and, consequently slow down the cure rate of DGEBA. This lower rate constant with higher activation en- ergy for SIN accounts for the slow viscosity increase for SINS (Fig. 6 and 7 ) . This difficulty of SIN cure may also interpret the lower gel fractions (Table 11) for SIN'S.
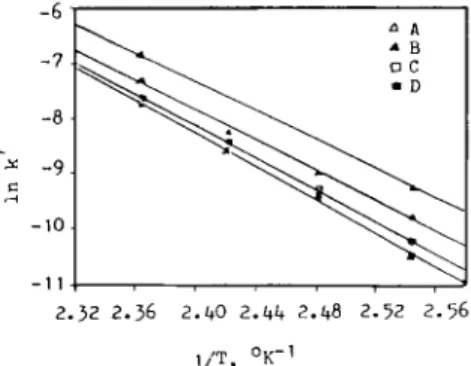
Figure 11 ( a ) shows plots of conversion of C = C bond for DAP versus time a t various temperatures. Figure 11 ( b ) shows similar plots for a typical SIN composition of 50/50 in DAP/DGEBA ratio. Again, by comparing Figures 11 ( a ) and 11 ( b )
,
pure DAP showed a higher cure rate than other SIN'S. Our data indicated a first order in C = C bond when DAP was cured with DCP, which is in accordance with a normal polymerization of vinyl monomer: l7-
d [ MI / d t = kp ( kdf [ I ] /kt) '"[ MI
( 30 10 a 40 60 Time, .in.
Figure 9. Plots of epoxide conversions versus cure time
a t different temperatures for ( a ) DGEBA and ( b ) SIN'S:
( A ) 120"C, ( B ) 130°C, ( C ) 140°C, ( D ) 15OOC.
where [ I ] is initiator concentration, f is initiator efficiency, kd is the dissociation constant of initiator, and
lz,
and k, are rate constants of chain propagation and chain termination, respectively.Integration of eq. ( 3 ) , gives:
0 - 1 1 ,-i c -2 -3 -4 2 i/T, OK-'
Figure 10. Plots of In k vs. 1 / T for epoxide and SIN'S
of various compositions. DAP/DGEBA = (A) 100/0, (B) 75/25, ( C ) 50/50, ( D ) 25/75, ( E ) 0/100.
2100 LIN AND YEH
Table 111. Kinetic Parameters for Epoxide in DGEBA and SINS
k x
lo4
(mol L-' s-l) Sample E (DAP/DGEBA) 120°C 130°C 140°C 150°C (kcal/mol) B (75/25) 1.38 2.58 5.28 9.56 22.51 C (50/50) 4.88 9.33 17.5 35.5 21.66 D (25/75) 10.2 18.7 31.8 71.7 20.94 E (0/100) 20.1 33.2 62.7 130.0 20.49Assume that at early stages of cure reaction, the initiator efficiency f and initiator concentration [ I ] did not change too much, then k' = kp( k d f [ I ] / k t )
''*
is nearly constant, and eq. ( 4 ) becomes:
- l n ( l - a ) = k't ( 5 ) Figures 12 ( a ) and 12 ( b ) show the plots of -In ( 1
- a) vs. t for DAP and for the SIN of DAP/DGEBA = 50/50. It was found that the experimental data fitted a first order up to about 30% of conversion for DAP. Beyond 30%, a deviation was observed, presumably because of the variety in f and [I] and the gel effect.17 Willard, in his kinetic study of DAP with DSC, also reported a first order on DAP.18 The kinetic data for SIN of DAP/DGEBA = 50/50 fit
the first order of C=C bond only up to 20% of
1 1 - 2 b I 4
-
0 20 40 60 80 1W l x ) Time, min. 0 x , l + 0 ~ 8 6 1 0 0 1 Time. pin. 0 20 4 0 6 0 80 1 0 0 1 2 0 Time. rin.Figure 11. ( a ) Plots of conversions of C = C bond ver- sus cure time for DAP and ( b ) the same plots for SIN of DAP/DGEBA = 50/50: ( A ) 120"C, ( B ) 130°C, ( C ) 140"C, ( D ) 150°C.
-
-ti I 4 C 4 I-
D-
.) * A 0 0 0 x ) 40 60 8C 100 120 Time, pin.Figure 12. ( a ) Plots of -In (1 - a ) versus time for DAP and ( b ) the same plots for SIN of DAP/DGEBA
COMPATIBLE SIN’s 2101
Table IV. Kinetic Parameters for C = C Bond in DAP and SIN’S k’ x
lo5
(S-l) Sample E’ (DAP/DGEBA) 120°C 130°C 140°C 150°C (kcal/mol) A (100/0) B (75/25) C (50/50) D (25/75) ~ 9.20 19.2 63.2 109 5.74 12.9 25.9 70.9 3.59 9.03 20.1 46.9 2.87 8.10 18.7 42.1 27.27 27.71 28.37 29.69conversion; the gel effect probably shifted to an ear- lier stage during SIN formation because network interlock restrained chain mobility and diffusion control occurred earlier. The apparent rate constant
12’ a t various curing temperatures can be found from
the slope of each line (Fig. 12). A plot of In lz‘ versus reciprocal absolute temperature 1
/
T gives the ap- parent activation energy E‘ (Fig. 1 3 ) , with E’ = Ep+
f
( Ed-
E , ).
Here Ed is the activation energy ofinitiator dissociation, and Ep and E, are activation energies of chain propagation and chain termination, re~pective1y.l~~ The results of kinetic parameters for DAP and SINs are listed in Table IV.
Again, it is noted that SINs indicates lower ap- parent rate constants with higher activation energies than pure DAP. The more DGEBA the SIN con- tains, the lower the apparent rate constant and the higher the apparent activation energy the SIN has. The effect of network interlock was again observed and this effect accounts for the slow viscosity in- crease (Figs. 6 and 7 ) and lower cure rates for SIN’s compared with pure DAP [Figs. 11 ( a ) and 11 ( b ) ]
.
CONCLUSIONS
complete compatibility. The observed single damp- ing peak in RDS and single
Tg
in DSC for each SIN strongly supported complete compatibility of the SIN’s. During SIN formation, the restriction of chain mobilities and network interlock between DAP and DGEBA were compensated by the higher temperature cure as it was observed from the shift of exothermic curing peaks to higher temperature. The network interlock also provided a sterically- hindered environment for the curing reactions. Therefore, a lower viscosity increase due to retarded cure reaction and incomplete cure were observed during SIN formation, which subsequently led to a lower gel fraction for all SIN’S. Because of incom- plete cure, SIN’s contained lower gel fractions, and, the uncured DAP and/or DGEBA acted as plasti- cizers in SIN’S. Thus, SIN’s have lower damping peaks in RDS and lower T i s in DSC.The network interlock is also reflected in the lower rate constant with higher activation energy for SIN as found from the kinetic study of epoxide and C = C bond.
The authors are grateful to the National Science Council for the financial support of this work under contract num- ber NSC 81-1404-E009-05.
Close solubility parameters and H-bonding between DAP and DGEBA predicted this SIN system in
REFERENCES AND NOTES -” -7 -a -9 -10 E 4 - 1 1 2.32 2.36 2.40 2.44 2.48 2 - 5 2 2.56 i j T ,
Figure 13. Plot of In k’versus reciprocal absolute tem- peratures 1/ T for DAP and SIN’S of various compositions.
1. J. A. Manson and L. H. Sperling, Polymer Blends and Composites, Plenum, New York, 1976, chapter 8. 2. D. A. Thomas and L. H. Sperling, “Interpenetrating
Polymer Networks,” in Polymer Blends, Vol. 2, D. R.
Paul and S . Newman, Eds., Academic, New York,
1978.
3. L. H. Sperling, Interpenetrating Polymer Networks and Related Materials, Plenum, New York, 1981. 4. D. R. Paul, Interfacial Agents (“Compatibilizers”) for
Polymer Blends, Vol. 2, D. R. Paul and S . Newman, Eds., Academic, New York, 1978.
5. P. Smith and A. Eissenberg, J. Polym. Sci. Polym. Lett. Ed., 21,2232 (1983).
2102 LIN AND YEH
6. M. S. Lin and K. T. Jeng, J. Polym. Sci. Part A: Polym.
7. M . S. Lin and R. J. Chang, J . Appl. Polym. Sci., 46,
8. J. Brandup and E. H. Immergut, Eds., Polymer Hand-
book, Wiley, New York, 1975, p. IV-339.
9. K. Frisch, Mat. Res. SOC. Symp. Proc., 171, 231 (1990).
10. ( a ) R. F. Fischer, Znd. Eng. Chem., 52, 321 (1960); (b) R. F. Fischer, J. Polym. Sci., 44, 155 (1960). 11. ( a ) Y. Tanaka and H. Kakiuchi, J. Appl. Polym. Sci.,
7,1063-1081 (1963); ( b ) Y. Tanaka and H. Kakiuchi,
J. Polym. Sci. A , 2,3405 (1964).
12. M. K. Antoon and J. I. Konig, J. Polym. Sci. Polym.
Chem. Ed., 1 9 , 5 4 9 (1981).
13. V. Tanaka and T. F. Mika, in Epoxy Resins, C. A.
Chem., 30, 1941-1951 (1992). 815-827 ( 1992).
May and T. Tanaka, Eds., Dekker, New York, 1973, chapter 3.
14. R. A. Fava, Polymer, 9, 137 (1968).
15. Y. TanakaandH. Kakiuchi, J . Macromol. Chem., 1, 307 ( 1966).
16. P. Peyser and W. D. Bascom, in Analytical Calorim- etry, Vol. 3, R. S. Porter and J. F. Johnson, Eds.,
Plenum, New York, 1974, p. 537.
17. ( a ) G. Ordian, Principles of Polymerization, Wiley,
New York, 1981, chapter 3; ( b ) T. R. Cuadrado, J. Barrajo, and R. J. J. Williams, J. Appl. Polym. Sci., 28,485-499 ( 1983).
18. P. E. Wilard, Polym. Eng. Sci., 17( 2 ) , 120 (1972).
Received May 5, 1992