Journal of the Chinese Institute of Environmental Engineering, Vol. 15, No. 4, pp. 223-231 (2005)
MASS TRANSFER OF PERCHLOROETHYLENE FROM TX-100 CONTAINING
SOLUTION TO GAS-PHASE IN A PACKED-BED STRIPPING TOWER
Chung-Hsuang Hung,1, * Tai-Hung Hsieh1 and Ching Yuan2
1 Department of Safety, Health and Environmental Engineering
National Kaohsiung First University of Science and Technology Kaohsiung 811, Taiwan
2 Department of Civil and Environmental Engineering
National University of Kaohsiung Kaohsiung 811, Taiwan
Key Words : TX-100, PCE, Henry’s constant, surface tension, air stripping, mass transfer coefficient,
modeling
ABSTRACT
The main objective of this study was to investigate the mass transfer of perchloroethylene (PCE) from surfactant-containing solution to the air in a packed bed stripping tower. TX-100, which was a commercially using nonionic surfactant, was examined in the study. The effects of TX-100 dosage ranging from 0.00208 to 20.8 mM on the transfer rate of PCE were particularly interested in the study. A set of empirical model for predicting mass transfer coefficients of PCE based on various concentrations of TX-100 was developed. Experimental results showed little change in both density and viscosity of the solution by adding less than 2.0 mM of TX-100. Nevertheless, solution surface tension declined with TX-100 concentration from 71.8 to 34.7 dynes/cm while its concentration below 0.25 mM and the surface tension approached to a constant value of about 34.7 dynes/cm as its concentration above 0.25 mM. The results also indicated that the critical micelle concentration (CMC) of TX-100 was about 0.25 mM. There was little variation in Henry’s constant (Hc) respected to PCE for 100 concentration below its CMC (0.25 mM), but the Hc decreased quickly with TX-100 concentration above its CMC. The accumulation of surfactant monomers rather than its micelles at the interface between gas and water not only resulted in the reduction of solution surface tension, but also blocked the transfer of PCE between phases. A smaller mass transfer coefficient of PCE was detected in TX-100 containing solution.
* To whom all correspondence should be addressed. E-mail address: [email protected]
INTRODUCTION
Surfactants are the molecules having both hy-drophilic and hydrophobic portions and can alter the interface properties of solution. The hydrophilic por-tions of surfactants are water-soluble, which are usu-ally polar or ionic functional groups. In contrast, the hydrophobic portions are water-insoluble, which are usually long fatty or hydrocarbon chains. This dual functionality, hydrophobic and hydrophilic, provides the basic characteristics useful in cleaner and deter-gent formulations. Typical characteristics of surfac-tants are surface tension modification, emulsification and foaming. Surfactants usually can be classified by the characteristics or types of hydrophilic groups into four major categories including nonionic, anionic, cationic and amphoteric surfactants. Formation of a micelle structure is an important property for a
surfac-tant. “Micelle” is an aggregated structure composing many surfactant monomers. The critical micelle con-centration (CMC) is the surfactant concon-centration at which an appreciable number of micelles are formed. Micelle formation can enable emulsification, solubili-zation and dispersion of otherwise non-compatible materials.
Surfactants have been widely used as cleaners and detergents for cleaning purposes. Recently, sur-factants are also applied to pollution control [1]. Soil washing technology was developed in late 1970’s. They have been applied to contamination control of groundwater or soil since 1980’s. Because surfactants can increase solubility of hydrophobic organic com-pounds (HOCs), the essential principle for soil wash-ing technologies with surfactants is based upon higher partition of HOCs in surfactant-containing solution than those in pure water [2-4]. Thus, being as the
Table 1. Properties of Triton(R) X-100 (TX-100).
Items Properties of TX-100
Category Non-ionic
Formula C34H62O11
Molecular Weight 646.85 g/mole
Critical Micelle Concentration (CMC)* 2.50×10⁻⁴ M
Molecule Structure
*measured in this study.
flushing agents, surfactants are usually injected into subsurface through injection wells on one side of a polluted site (the upwind in general) and then are withdrawn with groundwater from the other side of the area. A shorter period for site cleaning-up is the most important advantage for this technology. How-ever, the withdrawn groundwater containing both HOCs and injected surfactants may cause some diffi-culties in post treatment. The disposal of this kind of wastewater, which contains both HOCs and surfac-tants, becomes a potential problem of concern.
As a matter of fact, there may be some important issues that should be concerned when surfactants are applied to soil wash. One of them is that residual sur-factants may contaminate the soil due to their high af-finity to soil. Less toxic or bio-degradable surfactants are preferred [5]. Due to less adverse effect to the en-vironment than other kind of surfactants, none-ionic surfactants have been used more and more widely. Besides, another potential issue of concern is the withdrawn wastewater containing both the extracted HOCs and injected surfactants. Most of the HOCs in the contaminated groundwater are volatile organic compounds (VOCs). These high concentration surfac-tants and volatile organic species generally have ad-verse effect to the organisms in most wastewater bio-treatment units, and both of them usually can not be removed efficiently, either. More efforts are required for establishing a more efficient control technology for treating the withdrawn wastewater.
For the removal of VOCs from water, air strip-ping is one of the most promising unit operations [6-10]. Nerveless, the air stripping technology is also based on the change in HOCs partition between gase-ous and liquid phases, any composition (or impurity) that can change the equilibrium partition relationships between liquid and gaseous phases also can affect the transfer rates of VOCs between the phases. Since most surfactants have the tendency to increase the solubility of HOCs, the higher solubility of HOCs in water re-sulting from the addition of surfactants may alter the partition relationships between water and gas phases. The effects of surfactants on transfer rates in stripping process only reported in some investigations [1, 11]. More deep investigation is required.
Hence, this study aimed to monitor transfer rate of PCE from nonionic surfactant-containing solution to the air in a packed-bed air stripping tower. The ef-fects on mass transfer rate of PCE by the addition of TX-100 are particularly interested in this investigation. The effects of different dosages of nonionic surfactant (Triton® X-100, TX-100) on partition relationships between aqueous and gas phases were investigated, too. This study developed a set of empirical models for predicting the mass transfer coefficient of PCE versus different concentrations of TX-100.
MATERIALS AND MTHODS
I. Measurement of Basic Properties of Surfactant- containing Solution
The investigated nonionic surfactant in this study is TX-100, which has a formula of C34H62O11 and a
molecular weight of 645.9 g/mole. Table 1 tabulates the basic properties of TX-100. As mention previously, the critical micelle concentration is an important prop-erty for a surfactant, but it may change with the com-positions or impurities in a solution. The surfactants produced from different companies may have differ-ent values for CMCs, too. Accordingly, the CMC of TX-100 is measured in the study.
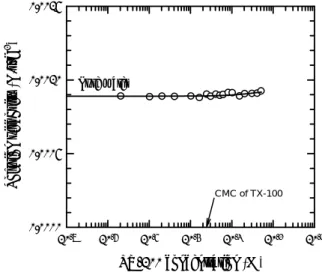
The CMC of TX-100 is defined at the concen-tration of which solution surface tension begins to ap-proach a constant value [2, 5]. The solution surface tension was determined with a tensic meter (DU Nouy) in the research. As the change in surface tension as shown in Fig. 1, the CMC for TX-100 was found to be about 0.25 mM. Besides, for collecting more complete information of the solution, the rest solution properties such as, conductivity and viscosity were also meas-ured in this study. They were monitored by a conduc-tivity meter and an Ostward viscosity meter (Vis-cometer 25, Kimax), respectively.
II. Measurement of Henry’s Constant of PCE in TX100-containing Solution
Packed-Bed Stripping Tower TX-100 concentration (M) 10-7 10-6 10-5 10-4 10-3 10-2 10-1 Sol ut ion sur face t ens io n ( dynes /cm ) 0 10 20 30 40 50 60 70 80 CMC of TX-100 pure water = 71.8 dynes/cm
Fig. 1. Solution surface tension versus added TX-100 concentration.
late the partition relationships of hydrophobic species between gaseous and aqueous phases. As shown in Eq. (1), Henry’s constant (Hc) of a HOC is defined as the ratio of equilibrium concentration of the HOC in the gas phase to that in liquid phase. A dimensionless Hc can be achieved while the concentrations of organic species in both phases have same units.
L G
C C
Hc= (1)
For determining the Hc of PCE in the solution respected to various concentrations of TX-100, an “equilibrium-partitioning-in-closed-system (EPICS)” method was applied [7, 11, 12]. The procedures for Hc measurement by the EPICS method were to pre-pare solution containing different concentrations of PCE or TX-100, and then the solution was sealed in 240-mL Pyrex glass bottles. The bottles were incu-bated in a 30-rpm rotation water bath shaker for a given temperature of 25 oC. After more than 12 hr
pe-riod of incubation, the equilibrium concentration of PCE in the solution was analyzed by a GC/ECD (HP 4890) accompanied with a Purge & Trap (Tekmar 3000) as a pre-concentrator. The major analytic condi-tions for the Purge & Trap and GC/ECD were tabu-lated in Table 2.
III. Set-up of Packed-bed Air Stripping Tower A bench-scale air stripping tower (see Fig. 2) was assembled for the particular purpose of this study for investigating the mass transfer rate of PCE from the TX-100-containing solution to the air. The strip-ping tower, which had been packed with “double-cross” Teflon packing material of 45 cm in height, was made with a Pyrex glass column with an interior diameter of 12.7 cm and a total height of 72.0 cm. The packing material has a specific surface area of 313
Table 2. Analytic conditions for PCE analyses by a GC/ECD with purge & trap.
Pure water=71.8 dynes/cm
Purge & Trap
Purge Ready temp. 35 oC
Tube temp. 40 oC
Purge time 11 mins
Desorb preheat 245 oC
Desorb time 2 mins
Desorb temp. 250 oC
Back time 10 min
Back temp. 260 oC
G.C.
Carrier gas High purity N2 gas
Carrier gas flowrate 16.6 mL/min
Split ratio 2.55
Separation column VOCOL (60 m×0.53 mm) Injector temperature 150 oC
Detector (ECD) temperature 290 oC
Temperature ramping programming for G.C. operation Initial temperature 50 oC (1 min)
First temperature ramping rate 5 oC/min up to 120 oC
Secondary temperature ramping rate 15 oC/min up to 190 oC
120mm Sampling pore Sampling pore 150 mm 200L Sampling pore 100 mm Packing Packing Sampling pore Packing 127 mm 100 mm Screen 150 mm
Screen & Demister
P T Sampling pore T Vent Discharge 200L Storage Tank Gas tide Tank M Mixer Air Air Compressor Desiccant Activated Carbon FIT SG FIT VOC injection Flowmete
Flowmeter Regulator Air Regulator Safety Valve Liquid:0~5 L/min Gas:0-100 L/min Solution Valve Sampling pore Sampling pore Sampling pore
Fig. 2. Schematics of packed bed air stripping tower. m2/m3. Some important properties of the packing ma-terial are tabulated in Table 3.
For conducting the experiments, the feeding wastewater containing different concentrations of both
Table 3. Characteristics of packing material. Items Characteristics Type Double-cross Material PTFE Outer diameter (mm) 12 Inner diameter (mm) 9 Height (mm) 15
Specific surface area (m2/m3) 313
Density (kg/m3) 80 Cavity (%) 91 Photo-picture TX-100 concentration (M) 10-7 10-6 10-5 10-4 10-3 10-2 10-1 S olu tio n den sitr y ( g/m L ) 0.0 0.2 0.4 0.6 0.8 1.0 1.2 1.4 CMC of TX-100
Fig. 3. Solution density versus added TX-100 concentration.
TX-100 and PCE was stored in a 200-L gas-tide stainless steel tank. The stripping unit was operated counter-currently. The air, which was provided by an air compressor, was purified by both desiccant and ac-tivated carbon columns before going into the stripping tower. As operating the stripping tower, it usually took less than 15 minutes to reach a steady state. Ac-cordingly, all the tests of this study were continually conducted for more than one hour for collecting steady state experimental results.
IV. Calculation of Mass Transfer Coefficients of PCE
Equation (2) was applied to calculating the mass transfer coefficient (KLa) of PCE in the stripping tower.
L A Z A A C C KLa L(1 L )/ ] ) 1 )( / ln[( 2 1 − − = (2) TX-100 concentration (M) 10-7 10-6 10-5 10-4 10-3 10-2 10-1 S oluti on vi sc osi ty (N/s -m 2 ) 0.0000 0.0005 0.0010 0.0015 pure water Pure water CMC of TX-100
Fig. 4. Solution viscosity versus added TX-100 concentration.
The tested TX-100 concentration ranged from 0.00208 to 20.8 mM. The gas flowrate was from 5 to 20 L/min and the liquid flowrate was from 1.0 to 2.5 L/min. This study also tried to develop a set of em-pirical equations for simulating the mass transfer coef-ficient of PCE respected to different concentrations of TX-100 in the stripping column. These equations were based on the prediction model developed by Onda [10, 13, 14]. The major parameters including operation conditions, solution properties and characteristics of VOCs were involved in the model. Based on a differ-ent kind of packing material and stripping tower, a new set of empirical coefficients for the Onda’s model was proposed in this study for achieving a more con-sistent simulation results.
RESULTS AND DISCUSSION
I. Effects of TX-100 Concentrations on Solution Prosperities
Figures 3 and 4, respectively, shows both density and viscosity of solution containing various concentrations of TX-100. At 25 oC, the density and
viscosity of pure water was about 1.0 g/cm3 and 8.9×10⁻⁴ N/s-m2, respectively. Since the highest
concentration of added TX-100 was about 20 mM in the study, the solution density or viscosity would not change much. Based upon our observation, less than 5% enhancement in solution viscosity was observed for the added TX-100 concentration higher than 1.0 mM. However, it was observed that solution surface tension declined with TX-100 concentration from 71.8 dynes/cm to 34.7 dynes/cm as the added TX-100 con-centration less than 0.25 mM, and the surface tension approached to a constant value of about 34.7 dynes/cm as the added TX-100 concentration higher than 0.25 mM.
Packed-Bed Stripping Tower TX-100 concentration (M) 10-7 10-6 10-5 10-4 10-3 10-2 10-1 Soluti on s urf ac e te nsion (dy nes /c m) 0 20 40 60 80 100 H enr y' s constant o f PC E (di mens ionl es s) 0.0 0.2 0.4 0.6 0.8 1.0 surface tension Henry's constant CMC of TX-100
Fig. 5. Solution surface tension and Henry’s constant of PCE versus TX-100 concentration.
The decrease in solution surface tension was mainly corresponded to the addition of TX-100. It has been well known that surfactant molecules have the capabilities of associating with one another at inter-faces and in solution. As surfactant concentration be-low critical micelle concentrations, most of the surfac-tant molecules (surfacsurfac-tant monomers) are located at the interface between air and water. A thin film of sur-factant monomers spreads over the interface by the ways that hydrophobic ends of surfactant monomers head to air and the hydrophilic ends head to water, causing the reduction of solution surface tension. Ac-cordingly, this thin film formed by surfactant mono-mers may reduce mass transfer rates of VOCs be-tween them. As the surfactant concentration above critical micelle concentrations, on the other hand, sur-factant monomers amass as spherical aggregates by the ways that the hydrophobic ends head to centers of the aggregates and the hydrophilic ends are as the out-side perimeter of the aggregates. These aggregates are well known as micelles. In the solution in which sur-factant micelles have been formed, the concentration of nonaggregated surfactant monomers in the solution can not be higher than a specific maximum level be-cause any additional surfactant molecules will be in-corporated into as a new surfactant aggregate (mi-celle). Therefore, further decrease in surface tension can not be observed at surfactant concentrations greater than the CMC. As mention previously, the de-crease in surface tension can be applied as an indicator for monitoring the formation of micelles. The critical micelle concentration of a surfactant is usually near the flecting point of the curve representing solution surface tension versus surfactant concentration. Based on the experimental results as depicted in Fig. 1, which expresses the surface tension versus added TX-100 concentration, the CMC for TX-TX-100 is at about 0.25 mM.
In comparison of the declining pattern in solu-tion surface tension versus added concentrasolu-tion of
TX-100, different declining pattern of Henry’s con-stant of PCE versus TX-100 concentration was ob-served (see Fig. 5). There is little variation in the Hc of PCE while TX-100 concentration below its CMC (0.25 mM), but the Hc decreases quickly with TX-100 concentration above the CMC. As mentioned previ-ously, surfactant forms micelles at the concentrations above its CMC. The surfactant micelles seems to have more contribution to reducing the Hc than the surfac-tant monomers do, even though both of them are able to enhance the solubility of PCE. One major reason may be that PCE is embodied inside micelle structures and isolated from water molecules. The equilibrium relationships among PCE, water and surfactants have been changed after the addition of TX-100, especially after the formation of micelles. It is proposed that at least three-phases including a gas phase, a surfactant micelle phase and a pure liquid phase without surfac-tant micelles are involved in the system. PCE is in a state of partition equilibrium among these phases. The partition relationship between gas/liquid phases fol-lows the Henry’s Law. The partition equilibrium of PCE also can be observed between pure liquid and surfactant micelles. Because PCE is embodied inside the micelles and isolated from water molecules, less PCE can be distributed in the pure liquid phase. So, it results in a lower equilibrium concentration for PCE in the gas phase and causes smaller Henry’s constant for PCE as well.
Surface tension Henry’s constant
For quantifying the change in the major charac-teristics of surfactant-containing solution and PCE, the empirical equations as shown from Eqs. (3) to (6) are proposed in the study. These equations correlate the characteristics with TX-100 concentration ranging from 2.08¯10-6 to 5.20¯10-3 M.
ρ= 0.993-0.008¯ln([TX-100]) (3)
μ= 10-3¯(0.9291+0.0037¯ln([TX-100]) (4)
σ= 34.32+27.02¯exp(-18307.29¯[TX-100]) (5) Hc= -95.89¯exp([TX-100])+96.67 (6)
II. Effects of TX-100 Concentrations on Mass Transfer Rates of PCE
The impacts of TX-100 dosage on both stripping efficiency and mass transfer coefficient of PCE are depicted in Figs. 6 and 7, respectively. The stripping efficiency of PCE is defined as the reduction ratio of PCE concentration in wastewater through the packed-bed stripping tower. It was observed that the stripping efficiency declined with TX-100 concentration below its CMC and the efficiency approached to a constant value at the TX-100 concentration above its CMC (Fig. 6). A maximum reduction of 36% of the strip-ping efficiency for PCE was observed in surfactant-containing solution, corresponding to less efficient mass transfer of PCE. Based on our calculation, up to
TX-100 concentration (M) 10-7 10-6 10-5 10-4 10-3 10-2 10-1 PC E re m ova l e ffi ci enc y (%) 0 20 40 60 80 100
Liquid flowrate = 1.5 L/min Gas flowrate = 5.0 L/min
CMC of TX-100
Fig. 6. Striping efficiency of PCE in the packed column for various concentration of TX-100 ( Liquid flowrate= 1.5 L/min; gas flowrate= 5.0 L/min).
TX-100 concentration (M) 10-7 10-6 10-5 10-4 10-3 10-2 10-1 M ass tr an sf er co ef fi cie nt ( m in -1 ) 0.0 0.1 0.2 0.3 0.4 0.5
Liquid flow = 1.5 L/min Gas flow = 5.0 L/min
CMC of TX-100
Fig 7. Mass transfer coefficient of PCE between liquid and gas phases in the packed column for various concentration of TX-100 ( Liquid flowrate= 1.5 L/min; gas flowrate= 5.0 L/min).
60% of decrease in the mass transfer coefficient of PCE was detected while TX-100 concentration is above the CMC (Fig. 7).
Besides, it is interesting to find that the decline patterns for stripping efficiencies or mass transfer co-efficients versus TX-100 dosage are similar as the de-cline patterns of solution surface tension, but these patterns are totally different from the declining pattern of Henry’s constant versus TX-100 dosage. The de-crease in stripping efficiency of PCE mainly results from the addition of TX-100 which is in the form of monomers. The TX-100 monomers accumulating at the interfaces between gas and water to form thin films become barriers to block the transfer of PCE be-tween liquid and gaseous phases. This phenomenon is
KLa from experiments (min-1)
0.0 0.5 1.0 1.5 KL a from pro psed m odel (m in -1 ) 0.0 0.5 1.0 1.5 Experimental data
ig. 8. Comparison of overall mass transfer coefficient
by th dition of surfactant monomers.
at interprets the m
the e F
(KLa) in packed tower for stripping PCE out of
TX-100-containing solution based on both experimental results and the proposed model. e ad
Based on the “two films theory” th
ass transport phenomena between air and liquid phases [15], most mass transfer resistance is at the thin film of liquid side. More mass transfer surface area (or interface area) available is usually beneficial for the transport. However, the presence of surfactant in solution can reduce mass transfer rates of PCE in striping units. It is also due to the accumulation of sur-factant monomers at the interface between gas and water to block the transfer of PCE into gaseous phase.
For simulating the mass transfer rates of PCE in xamined stripping tower, an empirical prediction model is developed to correlate the relationships be-tween mass transfer coefficients of PCE and concen-trations of TX-100. The empirical model is based on the model proposed by Onda [13-14] as shown in the Eqs. (7) to (9). The coefficients for the Eqs. (7) to (9) had been justified for satisfying the particular packing material applied herein.
5 . 0 67 . 0 0028 . 0 − ⎟⎟ ⎠ ⎞ ⎜⎜ ⎝ ⎛ × ⎟⎟ ⎠ ⎞ ⎜⎜ ⎝ ⎛ ⎞ ⎛ ρ = × ⎟⎟ ⎠ ⎜⎜ ⎝ L L L L w L L L D a L g k ρ μ μ μ (7)
( )
2.0 33 . 0 7 . 0 32 . 5 ⎟⎟ × − ⎠ ⎞ ⎜⎜ ⎝ ⎛ × ⎟⎟ ⎠ ⎞ ⎜⎜ ⎝ ⎛ × = t p G G G G t G t G ad D a G D a k ρ μ μ (8) ⎢ ⎢ ⎣ ⎡ ⎟⎟ ⎠ ⎞ ⎜⎜ ⎝ ⎛ × ⎟ ⎠ ⎞ ⎜ ⎝ ⎛ × − − = 1 . 0 75 . 0 52 . 2 exp 1 L t C t w a L a a μ σ σ ⎥ ⎥ ⎦ ⎤ ⎟⎟ ⎠ ⎞ ⎜⎜ ⎝ ⎛ × ⎟ ⎟ ⎠ ⎞ ⎜ ⎜ ⎝ ⎛ × −0.05 2 0.2 2 2 t L L t a L g a L σ ρ ρ (9)Figure 8 compares the simulated mass transfer coefficients of PCE (KLa) versus the collected mass
Packed-Bed Stripping Tower
Table 4. Change in mass transfer coefficient of PCE, solution surface tension and Henry’s constant of PCE versus
Concentr nge in
mass transfe ts of PCE b
Change in solutio sion c Change in Henry’s PCE d various TX-100 concentrations. ation of TX-100a Cha
(mM) r coefficien n surface ten constant of
0.00208 -37.1% -12.7% 5.9% 0.0208 -58.5% -29.1% 15.2% 0.166 -50.6% -49.7% 5.8% 0.416 -52.0% -53.1% -0.7% 0.624 -62.1% -52.5% -2.0% 1.040 -60.3% -52.4% -2.2% 2.080 -57.5% -52.2% -32.4%
Note: a The CMC for TX-100 is 0.25 Mm.
is 5 L/min; the mass transfer coefficient in pure water is 0.404 min-1.
onless). transfer coefficients of PCE from the experiments.
summarizes the variation of mass trans-fer c
CONCLUSIONS
he effects of TX-100 dosage on mass transfer rate
t solution surface tension
de-• irical equations, as shown from Eqs. (3)
tion density, viscosity and surface tension. Both
•
fer of
NOMENCLATURE
b Water flow rate is 1.5 L/min; air flow rate
c The solution surface tension of pure water is 71.8 dynes/cm . d The Henry’s constant of PCE in pure water is 0.7466 (dimensi
The simulated results well fits the experimental results, indicating the proposed model can be applied to pre-dicting the mass transfer rates of PCE from the surfac-tant-containing solution to the air in the packed strip-ping tower.
Table 4
oefficients, solution surface tension and Henry’s constant of PCE in TX-100 containing solution. Again, it is observed that both stripping efficiencies and solu-tion surface tension decline quickly with TX-100 con-centration below the CMC of TX-100 and they ap-proach to constant levels while TX-100 concentration above the CMC. Alternatively, Henry’s constant of PCE has little change respected to TX-100 concentra-tion below the CMC, but it decreases quickly with TX-100 concentration above the CMC. There is about 50% reduction in both mass transfer coefficient and solution surface tension while TX-100 concentration at about 0.25 mM, but it is almost no change in Hc of PCE in this condition. It shows that the reduction in mass transfer rate of PCE in the stripping tower is mainly due to the formation of transfer-blocking films by surfactant monomers at gas/liquid interfaces.
T
of PCE in a packed-bed air stripping tower were investigated in the study. The important results are concluded as follows:
• It was observed tha
clined with TX-100 concentration from 71.8 dynes/cm to 34.7 dynes/cm as the added TX-100 concentration was less than 0.25 mM. The surface tension approached to a constant value of about 34.7 dynes/cm for TX-100 concentration above 0.25 mM.
Some emp
to (9), were proposed in the study to predict
solu-Henry’s constant of PCE and mass transfer coeffi-cient of PCE respected to various concentrations of TX-100 were also proposed in the equations. The surfactant monomers accumulated at the inter-faces between gas and water to block the trans PCE between liquid and gaseous phases, causing the decrease in mass transfer rate of PCE in the packed tower. ρ Den ρL Density of water (997.3 kg/m3) σ 70.9 dynes/cm) g material μG (1.85¯10 N/m -s) 8.94¯10-4 N/m2-s).
a-CL ation in liquid phase
ir (8.48¯10-6 G ading (kg/m -hr) coefficient (L/hr) fficient L ading (kg/m -min) sity (g/mL)
Surface tension of liquid ( σC Critical surface tensio of packin
(0.0281 kg/s2) μ Viscosity (N/s-m2)
Viscosity of air -5 2
μL Viscosity of water (
A Stripping factor (dimensionless) at Total specific surface area of packing m
terial (313 m2/m3)
aw Specific wetted area of packing material
(m2/m3)
CG Concentration in gas phase
Concentr
DG Molecular diffusivity in a
m2/s)
DL Molecular diffusivity in water (1. 30¯10-9
m2/s)
dp Nominal packing size (0.015 m)
Gas lo 2
Hc Henry’s constant (dimensionless) kG Gas phase mass transfer
kL Liquid phase mass transfer coe
(L/hr)
KLa Mass transfer coefficient (L/min)
Liquid lo 2
[TX-100] Surfactant concentration (M)
ACKNOWLEDGEMENTS
The au e National
Science Council of the Re ic of China, Taiwan for finan
REFERENCES
1. Oma, K. H., A . Megehee and D.
J. Wilson, “Soil Clean-up by Surfactant Washing:
2.
ments of DDT and Trichlorobenzene by
3.
r Partitioning of Volatile
4.
5.
hn Wiely & Sons Inc., NY 6.
“Monograph for Air Stripping of VOC
7.
ncoff, “Mass Transfer
8. . E. Mullins and T.
9. and Mass
10.
11. . C. Mar and E. E.
12. f Henry’s Law
13. Takeuchi and Y. Okumoto,
“Liquid-14. ., Sada E. and Murase Y., “Liquid-side
15. ting Engineers, Inc.,
iscussions of this paper may appear in the discus-thors would like to thank th
publ
cially supporting this research under Contract No. NSC 92-2211-E-327-008.
. N. Clarke, M. M
III Design and Evaluation of the Integrated Pilot-scale Surfactant Recycle System,” Separation
Science and Technology, 28(15&16), 2319-2349
(1993).
Kile, D. E. and C. T. Chiou, “Water Solubility Enhance
Some Surfactants below and above the Critical Micelle Concentration,” Environ. Sci. Technol., 23(7), 832-838 (1989).
Vane, L. M. and E. L. Giroux, “Henry’s Law Constants and Micella
Organic Compounds in Surfactant Solutions”, J. of
Chemical and Engineering Data, 45, 38-47 (2000).
Anderson, M. A., “Influence of Surfactants on Vapor-liquid Partitioning”, Environ. Sci. Technol., 26, 2186-2191 (1992).
Rosen, M. J., Surfactants and Interfacial
Phenomena, 3rd Ed., Jo
(2004).
Speece R. E., M. Asce, N. Nirmalakhandan and Y. H. Lee,
from Water”, J. of Environmental Engineering, 113(2), 434-443 (1987).
Gosset, J. M., C. E. Cameron, B. P. Eckstrom, C. A. Goodman and A. H. Li
Coefficients and Henry’s Constants for Packed-Tower Air Stripping of Volatile Organics: Measurements and Correlation,” Final report,
Engineering & Services Laboratory, Air Force Engineering & Services Center, Tyndall Air Force Base, FL, US, June (1985).
Ashworth, R. A., G. B. Howe, M
N. Rogers, “Air-water Partitioning Coefficients of Organics in Dilute Aqueous Solution,” J. of
Hazardous Materials, 18, 25-36 (1988).
Munz, C., “Air-Water Phase Equilibria
Transfer of Volatile Organic Solutes,” Ph.D. Thesis, Stanford University, Stanford, CA (1985). Roberts, P. V., G. D. Hopkins, C. Munz and A. H.
Riojas, “Evaluating Two-resistance Model for Air Stripping of Volatile Organic Contaminants in a Countercurrent Packed Column,” Environ. Sci.
Technol., 19, 164-173 (1985).
Chiang, P. C., C. H. Hung, J
Chang, “Henry’s Constants and Mass Transfer Coefficients of Halogenated Organic Pollutants in Air Stripping Packed Column,” Wat. Sci. and
Technol., 38(6), 287-294 (1998).
Gossett, J. M., “Measurement o
Constants for C1 and C2 Chlorinated
Hydrocarbons,” Environ. Sci. Technol., 21, 202-208 (1987).
Onda, K., H.
side Mass Transfer Coefficients in Packed Towers,” J. Chem. Eng. of Japan, 1(1), 56-62 (1968).
Onda K
Mass Transfer Coefficients in Packed Towers”, J.
AIChE, 5(2), 235-239 (1959).
James M. Montgomery Consul
Water Treatment Principles and Design, John
Wiley & Sons, Inc., NY (1985). D
sion section of a future issue. All discussions should be submitted to the Editor-in-chief within six months.
Manuscript Received: April 28, 2005 Revision Received: June 28, 2005 and Accepted: September 6, 2005
Packed-Bed Stripping Tower
ঈ೩̚
TX-100 ܧᗓ̄ݭࠧࢬ߿ّӣณ၆
αന˙̝ঈ೩ड़ਕᇆᜩ̶ژ
߸ૣ1,*! ᔁخ᾿1! ਿය2 1઼ϲฯௐ˘ࡊԫ̂ጯᒖဩᄃщБϠ̍ր 2઼ϲฯ̂ጯ˿͢ᄃᒖဩ̍ጯր ᙯᔣෟĈTX-100ăαന˙ăқӀ૱ᇴăܑࢬૺ˧ăঈ೩ăኳ็ܼᇴăኳ็ሀёၡ! ! ࢋ
ࠧࢬ߿ّ(surfactant)ܼ˘̶࣎̄̚ĂТॡѣᏐͪૄ(hydrophilic group)ᄃழͪૄ(hydrophilic group) ۞ѣ፟ۏĂࠧࢬ߿ّಏវ(monomers)ົ֭Еٺͪ໘୵ܑࢬ˯Ăֹͪ໘୵ܑ̝ࢬૺ˧ࢫҲĂ҃ࠧࢬ߿ّ ፧ޘ̝ᜈᆧΐĂࠧࢬ߿ّಏវົԛј˘̶̄ဥĂѩ̶̄ဥ૱Ⴭ̝ࠎĶࡪķĂԛјࡪ̝̈፧ޘჍ ࠎĶᓜࠧࡪ፧ޘ(critical micelle concentration, CMC)ķĂͪ໘୵˵Яࠧࢬ߿ّ̝ΐĂጱ໘ྋдͪ໘୵ ̝̚ณѣ፟ۏ۞ۏ̼পّĂ˵ᐌ̝ԼតĄώࡁտͽαന˙(PCE)ࠎϫᇾѳߖۏĂ੫၆ PCE дӣ TX-100 ܧᗓ̄ݭࠧࢬ߿ّᒖဩ˭Ăΐͽଣঈ୵มঈ୵πᏊᄃኳณ็Ꮾன෪Ă֭ޙϲӣࠧࢬ߿ّ˭ኳ็ܼᇴ ീሀёĄࡁտඕڍពϯĂΐ TX-100 ፧ޘٺତܕ CMC ॡĂқӀ૱ᇴົѣ಼̈ޘ۞˯̿Ăҭ༊ΐณ ࿅ CMC ޢқӀ૱ᇴົЯ TX-100 ፧ޘᆧΐ҃ഴ͌Ăѩࡪ၆ٺ PCE ̝Ķᆧ໘ड़ᑕķĂጱѩன෪۞Я ৵ćѩγĂ༊ٙΐ۞ TX-100 ፧ޘҲٺ CMC ࣃॡĂ໘୵۞ܑࢬૺ˧ᐌࠧࢬ߿ّ፧ޘᆧΐ҃ᅍഴĄҭ༊ TX-100 ፧ޘ྿ᓜ CMC ޢĂ໘୵ܑ̝ࢬૺ˧̙Гјּͧгഴ͌Ă҃ͅೀͼј˘ؠࣃćΩγĂ༊ TX-100 ፧ޘ ҲٺCMC ޘĂPCE צזࠧࢬ߿ّ̝ᓠቯԛјّᄃଵЕপّĂౄј୵ቯݓޘᆧΐĂ̙Ӏኳณ็ᏮĂֹ PCE дՠ೩̚۞ኳ็ܼᇴĂᐌ TX-100 ፧ޘᆧΐ҃ᅍഴĄ҃༊ TX-100 ፧ޘ࿅ CMC ޢĂαന˙ኳ็ ܼᇴᅍഴᔌ๕႙႙ᔌቤĂѩޢĂГᐌTX-100 ፧ޘᜈΐĂᅈ࿅ CMC ޢĂࠧࢬ߿ّࡪ PCE Β ᖬٺ̚Ăᆧ໘ड़ᑕֹPCE Հटٽхдٺ୵࠹̚Ăαന˙ኳ็ܼᇴГᜈᅍഴĄ