Computation of Conformational Entropy from Protein
Sequences Using the Machine-Learning
Method—Application to the Study of the Relationship
between Structural Conservation and Local Structural
Stability
Shao-Wei Huang1and Jenn-Kang Hwang1,2,*
1Institute of Bioinformatics, National Chiao Tung University, Taiwan, Republic of China
2Department of Biological Science & Technology, National Chiao Tung University, Taiwan, Republic of China
ABSTRACT A complete protein sequence can
usually determine a unique conformation; however, the situation is different for shorter subsequences— some of them are able to adopt unique conforma-tions, independent of context; while others assume diverse conformations in different contexts. The conformations of subsequences are determined by the interplay between local and nonlocal interac-tions. A quantitative measure of such structural conservation or variability will be useful in the understanding of the sequence–structure relation-ship. In this report, we developed an approach using the support vector machine method to compute the conformational variability directly from sequences, which is referred to as the sequence structural entropy. As a practical application, we studied the relationship between sequence structural entropy and the hydrogen exchange for a set of well-studied proteins. We found that the slowest exchange cores usually comprise amino acids of the lowest se-quence structural entropy. Our results indicate that structural conservation is closely related to the local structural stability. This relationship may have interesting implications in the protein folding pro-cesses, and may be useful in the study of the sequen-ce–structure relationship. Proteins 2005;59:802– 809.
©2005 Wiley-Liss, Inc.
Key words: structural conservation; sequence struc-tural entropy; strucstruc-tural profile; sup-port vector machines; hydrogen ex-change
INTRODUCTION
Studies1– 4 showed that both designed and naturally occurring subsequences may assume different secondary structures in different contexts. For example, Minor and Kim2have designed an 11-amino acid sequence that forms an ␣-helix in one context while a -sheet in another; systematic search1,3,4for protein fragments in the Protein Data Bank5 revealed that identical subsequences could have very different conformations—for example, the pen-tapeptide AVLAE forms an␣-helix in a potassium channel but forms a-sheet in cytidine deaminase. On the other
hand, a similar pentapeptide AALAE (the second amino acid is changed from V from A) remains the same␣-helical conformation in different proteins. Such structural conser-vation or variability is dictated by the interplay between local and nonlocal interactions. Studies6 –9 showed that protein folding is facilitated by the existence of some structured regions, dominated by stronger local interac-tions that are compatible with the native conformation. Hydrogen isotope exchange rates provide a useful probe of the equilibrium folding pathway of proteins.10 –12The slow hydrogen exchange regions usually consist of the amino acids that are either buried or involved in the hydrogen-bonding network.13,14 Hence, it is reasonable to assume that the amino acids involved in the slow amide proton exchange will have more conserved local structures. In this work, we developed an approach based on the machine learning method to compute conformational entropy from sequences. We applied this approach to a set of proteins with known hydrogen exchange data, and we found a close correlation between structural conservation and the slow hydrogen exchange.
METHODS Theory
A protein sequence ␣ of length L is denoted by ␣ ⫽ ␣1␣2. . .␣L, where␣iis the amino acid at the ith position.
The structural profile of␣ can be expressed in terms of an L⫻ N matrix M,15where N is the number of structural descriptors (to be given later)
Mⴝ(P1,P2, . . . PL) , (1)
where the column vector Piis the probability distribution
of the structural descriptors at␣i, that is,
Grant sponsor: National Science Council, National Research Pro-gram for Genomic Medicine; Grant sponsor: University System of Taiwan—Veterans General Hospital.
*Correspondence to: Jenn-Kang Hwang, Department of Biological Science and Technology, National Chiao Tung University, HsinChu 30050, Taiwan, ROC. E-mail: [email protected]
Received 15 November 2004; Accepted 14 December 2004
Published online 12 April 2005 in Wiley InterScience (www.interscience.wiley.com). DOI: 10.1002/prot.20462
because it is derived directly from sequences. SSE provides a straightforward measure of the structural conservation or variability of the residues. Lower SSE indicates a more conserved structure (or a context-independent conforma-tion), stabilized mainly by local interactions, while higher SSE indicates a higher degree of structural variability. Note that the definition of the structural descriptor is not unique, and in principle, it may be any structure-related properties like the secondary structural elements, the backbone torsion angles, or the solvent-accessible areas. Previous study15 showed that the secondary structural element is a more convenient and useful structure descrip-tor in the computation of conformational entropy. In this work we use the secondary structures defined by the widely used DSSP method,17whose assignment of second-ary structures is based on the hydrogen bonding patterns of protein structures. The DSSP method defines eight secondary structures:␣-helix (H), 310-helix (G),-helix (I), extended-strand (E), isolated -strand (B), turn (T), bend (S), and coil (U). Indeed, there are a number of secondary structure assignment methods (see the review by Andersen and Rost18) based on various algorithms such as the aforementioned hydrogen bonding patterns,17 backbone dihedral angles,19or combination of both,20,21 quantifica-tion of backbone curvature,22or the distance matrices of structural fragments.23In general, these methods make similar secondary structure assignments for the more common conformations such as␣-helix or -strand; how-ever, due to difference in assigning secondary structures, these methods may define different secondary structure types for particular conformations. For example, the DSSP method does not define the polyproline II helix (PII) but assigns it to T, S, or U according to the corresponding hydrogen-bonding patterns; on the other hand, the tool PROSS,19which assigns secondary structures based solely on backbone torsional angles, defines PII but does not define G, I, S, or B. However, as long as these methods provide a complete, consistent description of the protein conformations, Equation (3) will provide a useful quantita-tive measure of the structural conservation or variation of a protein.
The Support Vector Machines
The support vector machine method (SVM)24has been successfully applied to secondary structure prediction,25–27 protein fold assignment,28,29subcellular localization pre-diction30,31and other biological pattern classification prob-lems.32–35 The original idea of the SVM is to find the separating hyperplane with the largest distance between
Generation of Structural Profiles and Sequence Structural Entropy
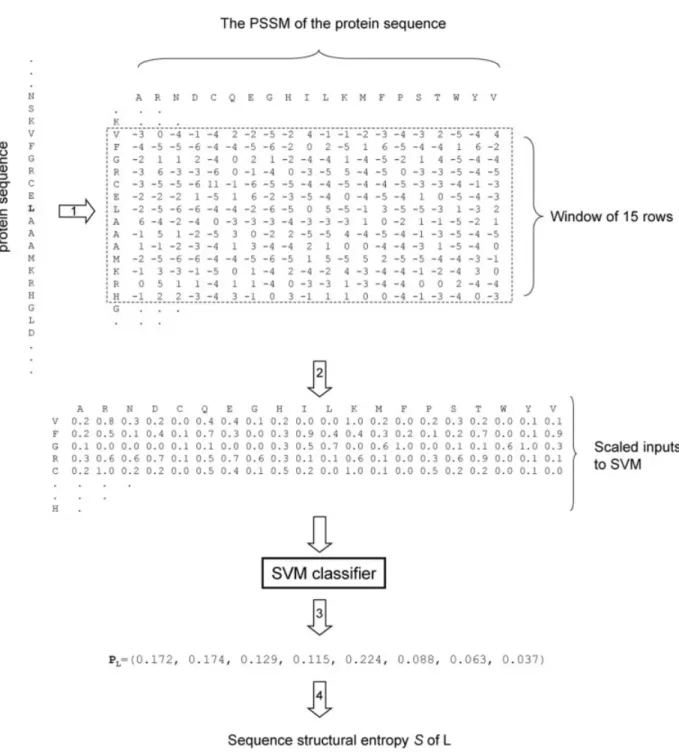
We compute the probability distribution of the second-ary structures using the method illustrated in Figure 1. The inputs to the SVM are in the form of W ⫻ 20 PSI-BLAST profiles or the position-specific scoring matrix (PSSM),37where W is the size of the sliding window of the sequence. The window size W is chosen to be an odd number so that the target residue is always centered in the sliding window. In this work, a 15⫻ 20 scoring matrix is used as an input to the SVM. The PSI-BLAST profile was obtained after three iterations with the E-value threshold set to 1⫻ 10⫺3against the nonredundant protein sequence database.38 Each element of the matrix represents the log-odds score of a particular residue substitution at that position, and its value is usually in the range⫾7. These matrix elements are normalized to the range [0,1] by the following scaling function.26
共x兲 ⫽
再
0.0 if x ⱕ ⫺5 0.5 ⫹ 0.1x if ⫺5 ⱕ x ⱕ 5 1.0 if x ⱖ 5
(4) where x is the original value of the matrix element. The SVM output for the target residue (i.e., the central amino acid of the sliding window) is an eight-element vector O⫽ (o1,o2,. . ., o8), where oiis the decision value of secondary
structure type i. Because the SVM does not provide estimates of the posterior probability of class membership, we transform this decision value oi by the function
[arctan(oi)⫹ ] to the range [0,1]. We then normalize the
resultant values to obtain pi, that is, the probability of
secondary structure type i of the target residue. With P⫽ (p1,p2, . . .p8), we compute SSE of the target residue using Equation (3). We train the SVM model using the standard data set RS126,39a nonhomologous data set that the pair wise sequence identity is less than 25% over a length of more than 80 residues. An important issue of optimizing SVMs is the selection of parameters such as the penalty parameters and the kernel parameters of the kernel function, which must be determined in advance. We use the cross validation on different parameters for the model selection.40
RESULTS Hen Egg-White Lysozyme
Hen egg-white lysozyme (HEWL) has two subdomains: the␣-domain composed of four ␣-helices (A, B, C, and D), two 310 helices (E and F), and the -domain formed by
three contiguous-strands. In the native form of HEWL, the study41showed that slowest exchange amide protons are located in the ␣-domain: helix A (M12), helix B (W28 –A31), and helix C (A95, K96, I98); and the next slowest in strand3 (I58). Figure 2 shows the SSE profile of HEWL. The lowest entropy regions are A11–K13 (helix A), W28 –K33 (helix B), and N93–V99 (helix C),
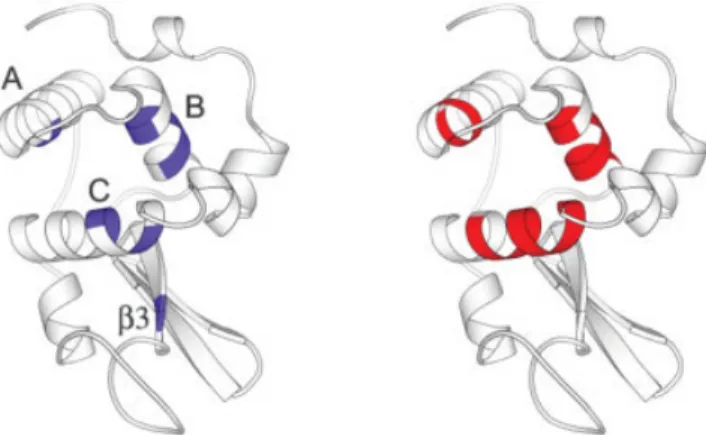
respec-tively. These amino acids overlap well with the slow exchange amide proton in helices A, B, and C. Note the residues in helix D (V109 –R114) have relatively higher entropy. This is consistent with the experiment that helix D amide protons exchange much more rapidly.41Figure 3 compares the spatial arrangements of the low SSE and the slow exchange regions in the ribbon diagrams of HEWL.
Fig. 1. The method to compute SSE from the protein sequence. The protein sequence is shown on the left and the target residue (in this example, a leucine residue) is in the shaded area. In step 1, the position-specific scoring matrix of the protein sequence is generated by the iterative PSI-BLAST. In step 2, each element of the window of 15 rows (in the dotted frame) centered on the leucine residue is rescaled to the range [0,1] [using Eq. (4)] as input to the SVM. In step 3, the outputs of the SVM are mapped to posterior probabilities PLof secondary structures. Finally, in step 4, the SSE of the target
Chymotrypsin Inhibitor 2
Chymotrypsin inhibitor 2 (CI2) has a unique ␣-helix that packs against the-sheets to form the hydrophobic core of the protein. The hydrogen exchange studies42,43 showed that the exchange behavior of CI2 is determined by its native structure. Figure 4 shows that two residues (I20 –L21) in the helix, which are the most buried in the helix, and the residues (V47, L49 –V51) on the central strand of the -sheet (4) have the slowest hydrogen exchange rates; the other slowest exchange amide protons are K11 (2), I30 and L32 (3).14,42,43These residues are among those of the lowest SSE (with the exception of K11), most of which are in sheet3 and 4, and helix ␣. Figure 5 compares the relative spatial distributions of the slow exchanging regions and the low entropy regions on the ribbon diagrams of CI2.
Cytochrome c
In the native horse heart cytochrome c (Cyt c), the slowest exchange regions are located in the N- and
C-helices.44 Specifically, F10 (N– helix) and L94 –K99 (C-helix) carry the slowest exchanging amide protons.44 Figure 6 shows that I9 –V11 and D93–L98 have the lowest SSE values, which coincide well with those with the slowest exchange amide protons. Note that the amino acids in the 60s helix also have relatively low SSE, which are consistent with the experiment that the next slowest exchange amide protons are in the 60s helix. Figure 7 compares the spatial orientations of the observed and the calculated exchange regions on the ribbon diagrams of Cyt c. Note that the two helices that carry the residues of the lowest SSE are close to each other in space.
Fig. 2. The SSE profile of HEWL. The secondary structural elements of HEWL together with their notations are shown on the top of the figure. On the bottom, we label the positions of the low SSE and the slow exchange regions by the red and blue circles, respectively. The entropy is rescaled to the range [0, 1]. The boundary of the SSE region is set by allowing deviations in SSE of 0.2 around the local minimum.
Fig. 3. Comparison of the slow exchange and the low SSE regions of HEWL. The slow exchange regions are colored in blue (left), and the low SSE regions in red (right). The secondary structure elements are also labeled for the corresponding slow exchange regions. Ribbon diagrams are drawn with Molscript.56
Fig. 4. The SSE profile of CI2. The notations of the secondary structural elements follows those of Otzen et al.57
Fig. 5. Comparison of the slow exchange and the low SSE regions of CI2 in ribbon diagrams.
Equilibrium Protein Folding
Cyt c provides a good model system for folding stud-ies.45– 47Under native conditions, protein molecules, con-tinually folding and unfolding, explore all possible un-folded conformation states in accordance with thermodynamic principles. The native state hydrogen exchanges studies45– 47 have identified four cooperative structural unfolding units in the Cyt c molecule, which are designated as the Blue bihelix (B), the Green⍀ loop and helix (G), the Yellow (Y) and the Red⍀ loops (R), respec-tively, in the order of decreasing free energy of unfolding. These structural units, through various combinations, may produce the intermediates that define the folding and unfolding pathways of Cyt c. Figure 8 shows the SSE profiles of these structural units together with their respec-tive average structural entropies. The B structural unit has the lowest average SSE, and G has the second lowest average SSE, and then Y, and R, which contains the residues of the largest SSE (A83–I85) in Cyt c and is also the least stable structural unit. The order of increasing average SSE follows that of decreasing free energy of unfolding.45,46The SSE appears to be closely related to the local structural stability.
Other Examples
We compute the SSE for the following proteins: Ribo-nuclease T1 (RNase T1),48 cardiotoxin analogue (CTX
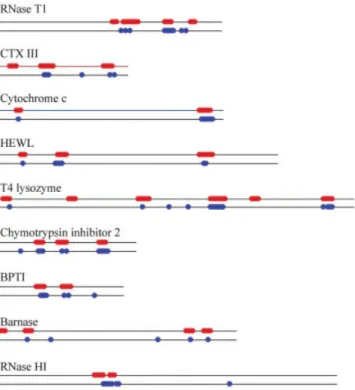
III),49T4 Lysozyme,50bovine pancreatic trypsin inhibitor (BPTI),51barnase,52,53and Ribonuclease HI (RNase HI).54 All exchange data are for the native proteins.14Figure 9 summarizes the results for these proteins as well as the examples presented in the previous sections. Figure 10 compares the spatial arrangements of the computed and observed slow exchange regions of these proteins. Specifi-cally, Figure 10(A) shows the native form of RNase T1 whose slowest exchange amide protons are located in strands2–4 of the central -pleated sheet.48As shown in the figure, the agreement between the observed and the computed is quite good. Figure 10(B) shows the snake venom CTX III, a small protein with a two-stranded and a three-stranded-sheet (3–5). Under native conditions, 5 and 3 are the most protected strands, followed by 4.49 Our calculations show that5 and 3 are indeed of the lowest SSE among the five strands, and that the residues near the C-terminal4 strand also have low SSE. Figure 10(C) shows that T4 lysozyme has two domains: the N-domain is mainly a -sheet structure, and the C-terminal domain is predominantly␣-helical. In the native T4 lysozyme, slow exchanges are observed in helices␣1, ␣3-␣5, and ␣10. The slow exchange amide protons are mostly in␣5 and ␣10. Our results show that most residues in␣5 and ␣10 have low SSE. Figure 10(D) shows that most slow exchange regions of the native BPTI are in the antiparallel strands, that is, strand 1 and 2,51which also have the lowest SSE. Figure 10(E) and 10(F) shows barnase and RNase HI, respectively. The observed slow
Fig. 7. Comparison of the slow exchange and the low SSE regions of Cyt c in ribbon diagrams.
Fig. 8. The SSE profiles of Cyt c with the unfolding structural units (R, Y, G, and B) colored in their respective colors (red for R, yellow for Y, green for G, and blue for B). The average SSE of each structural unit is indicated by the solid line. (The dotted lines are visual aids for comparing the relative magnitude of the average SSE of each structural unit.)
Fig. 9. A summary of the comparison of the low SSE and the slow exchange regions for RNase T1, CTX III, Cyt c, HEWL, T4 Lysozyme, CI2, BPTI, barnase, and RNase HI. The solid lines indicate the relative lengths of these sequences. The slow exchange and the low SSE regions are shown in red and blue circles, respectively.
exchange regions and the computed low SSE regions are in good agreement with each other.
DISCUSSION
Previously, Hilser and Freire11developed a combinato-rial algorithm to generate a large ensemble of conforma-tional states by partitioning the protein into blocks along the sequence. By assigning each block an arbitrary confor-mational state, they generated all possible combinational states and computed the Gibbs energy for each state. Using this approach, they were able to compute the hydrogen exchange protection factors for five proteins. Hespenheide et al.55simulated the incremental thermal denaturation of protein structures by breaking the tertiary network of hydrogen bonds and salt bridges one by one. Using these procedures, they were able to identify the structural stable and flexible regions, and found that they
were closely related to the slow hydrogen exchanging regions for proteins with different architectures. Both approaches are structure-based and require well-param-eterized energy functions (or scoring functions). In this report, we develop a sequence-based approach to compute the SSE of protein sequences, which provides a straightfor-ward measure of structure diversity of local sequences. Using this approach, we found a close relationship be-tween the low SSE and the slow hydrogen exchange regions. These results suggest that SSE is closely related to the local structural stability, as revealed by the hydro-gen exchange data. These findings are consistent with our recent results that conformational variability is related to thermal stability.15 In summary, we have developed a sequence-based machine-learning method to compute con-formational entropy directly from sequences, which may provide a useful tool in predicting local structural stability
Fig. 10. Comparison of the slow exchange (left, in blue) and the low SSE regions (right, in red) in ribbon diagrams of (A) RNase T1, (B) CTX III, (C) T4 lysozyme, (D) BPTI, (E) barnase, and (F) RNase HI.
on the sequence level. Such information should be useful in the studies of sequence–structural relationship such as folding processes and protein de novo design.
ACKNOWLEDGMENTS
We are grateful to both hardware and software support from the Structural Bioinformatics Core at National Chiao Tung University. We are also grateful to the reviewer for suggesting the term “sequence structural entropy,” which is subsequently used in the text.
REFERENCES
1. Kabsch W, Sander C. On the use of sequence homologies to predict protein structure: identical pentapeptides can have completely different conformations. Proc Natl Acad Sci USA 1984;81:1075– 1078.
2. Minor DL Jr, Kim PS. Context-dependent secondary structure formation of a designed protein sequence. Nature 1996;380:730 – 734.
3. Mezei M. Chameleon sequences in the PDB. Protein Eng 1998;11: 411– 414.
4. Sudarsanam S. Structural diversity of sequentially identical subsequences of proteins: identical octapeptides can have differ-ent conformations. Proteins 1998;30:228 –231.
5. Berman HM, Westbrook J, Feng Z, Gilliland G, Bhat TN, Weissig H, Shindyalov IN, Bourne PE. The Protein Data Bank. Nucleic Acids Res 2000;28:235–242.
6. Leopold PE, Montal M, Onuchic JN. Protein folding funnels: a kinetic approach to the sequence-structure relationship. Proc Natl Acad Sci USA 1992;89:8721– 8725.
7. Bryngelson JD, Onuchic JN, Socci ND, Wolynes PG. Funnels, pathways, and the energy landscape of protein folding: a synthe-sis. Proteins 1995;21:167–195.
8. Shoemaker BA, Wang J, Wolynes PG. Structural correlations in protein folding funnels. Proc Natl Acad Sci USA 1997;94:777–782. 9. Onuchic JN, Wolynes PG. Theory of protein folding. Curr Opin
Struct Biol 2004;14:70 –75.
10. Betz SF, Marmorino JL, Saunders AJ, Doyle DF, Young GB, Pielak GJ. Unusual effects of an engineered disulfide on global and local protein stability. Biochemistry 1996;35:7422–7428. 11. Hilser VJ, Freire E. Structure-based calculation of the
equilib-rium folding pathway of proteins. Correlation with hydrogen exchange protection factors. J Mol Biol 1996;262:756 –772. 12. Clarke J, Itzhaki LS. Hydrogen exchange and protein folding.
Curr Opin Struct Biol 1998;8:112–118.
13. Woodward C, Li R. The slow-exchange core and protein folding. Trends Biochem. Sci 1998;23:379.
14. Li R, Woodward C. The hydrogen exchange core and protein folding. Protein Sci 1999;8:1571–1590.
15. Chan CH, Liang HK, Hsiao NW, Ko MT, Lyu PC, Hwang JK. The relationship between local structural entropy and protein thermo-stability. Proteins 2004;57:684 – 691.
16. Shannon CE. A mathematical theory of communication. The Bell Syst Tech J 1948;27:379 – 423, 623– 656.
17. Kabsch W, Sander C. Dictionary of protein secondary structure: pattern recognition of hydrogen-bonded and geometrical features. Biopolymers 1983;22:2577–2673.
18. Andersen CA, Rost B. Secondary structure assignment. Methods Biochem Anal 2003;44:341–363.
19. Rose GD. PROSS: dihedral angle-based secondary structure assign-ment. http://roselab.jhu.edu/utils/runpross.html.
20. Frishman D, Argos P. Knowledge-based protein secondary struc-ture assignment. Proteins 1995;23:566 –579.
21. Heinig M, Frishman D. STRIDE: a Web server for secondary structure assignment from known atomic coordinates of proteins. Nucleic Acids Res 2004;32:W500-2.
22. Sklenar H, Etchebest C, Lavery R. Describing protein structure: a general algorithm yielding complete helicoidal parameters and a unique overall axis. Proteins 1989;6:46 – 60.
23. Richards FM, Kundrot CE. Identification of structural motifs from protein coordinate data: secondary structure and first-level super-secondary structure. Proteins 1988;3:71– 84.
24. Vapnik V. The Nature of statistical learning theory. New York; Springer; 1995.
25. Hua S, Sun Z. A novel method of protein secondary structure prediction with high segment overlap measure: support vector machine approach. J Mol Biol 2001;308:397– 407.
26. Kim H, Park H. Protein secondary structure prediction based on an improved support vector machines approach. Protein Eng 2003;16:553–560.
27. Ward JJ, McGuffin LJ, Buxton BF, Jones DT. Secondary structure prediction with support vector machines. Bioinformatics 2003;19: 1650 –1655.
28. Ding CHQ, Dubchak I. Multi-class protein fold recognition using support vector machines and neural networks. Bioinformatics 2001;17:349 –358.
29. Yu C-S, Wang J-Y, Yang J-M, Lyu PC, Lin C-J, Hwang J-K. Fine-grained protein fold assignment by support vector machines using generalized n peptide coding schemes and jury voting from multiple-parameter sets. Proteins Struct Funct Genet 2003;50: 531–536.
30. Hua S, Sun Z. Support vector machine approach for protein subcellular localization prediction. Bioinformatics 2001;17:721– 728.
31. Yu CS, Lin CJ, Hwang JK. Predicting subcellular localization of proteins for Gram-negative bacteria by support vector machines based on n-peptide compositions. Protein Sci 2004;13:1402–1406. 32. Brown MP, Grundy WN, Lin D, Cristianini N, Sugnet CW, Furey TS, Ares MJ, Haussler D. Knowledge-based analysis of microar-ray gene expression data by using Support Vector Machine. Proc Natl Acad Sci USA 2000;97:262–267.
33. Dobson PD, Doig AJ. Distinguishing enzyme structures from non-enzymes without alignments. J Mol Biol 2003;330:771–783. 34. Chen YC, Lin YS, Lin CJ, Hwang JK. Prediction of the bonding
states of cysteines using the support vector machines based on multiple feature vectors and cysteine state sequences. Proteins 2004;55:1036 –1042.
35. Kim H, Park H. Prediction of protein relative solvent accessibility with support vector machines and long-range interaction 3D local descriptor. Proteins 2004;54:557–562.
36. Chang C-C, Lin C-J. LIBSVM: a library for support vector machines. 2001. Software available from http://www.csie.ntu.edu. tw/⬃cjlin/libsvm
37. Altschul SF, Madden TL, Schaffer AA, Zhang J, Zhang Z, Miller W, Lipman DJ. Gapped BLAST and PSI-BLAST: a new generation of protein database search programs. Nucleic Acids Res 1997;25: 3389 –3402.
38. Bairoch A, Apweiler R. The SWISS-PROT protein sequence database and its supplement TrEMBL in 2000. Nucleic Acids Res 2000;28:45– 48.
39. Rost B, Sander C. Prediction of protein secondary structure at better than 70% accuracy. J Mol Biol 1993;232:584 –599. 40. Duan K, Keerthi SS, Poo AN. Evaluation of simple performance
measures for tuning SVM hyperparameters. Neurocomputing 2003;51:41–59.
41. Radford SE, Buck M, Topping KD, Dobson CM, Evans PA. Hydrogen exchange in native and denatured states of hen egg-white lysozyme. Proteins 1992;14:237–248.
42. Itzhaki LS, Neira JL, Fersht AR. Hydrogen exchange in chymotryp-sin inhibitor 2 probed by denaturants and temperature. J Mol Biol 1997;270:89 –98.
43. Neira JL, Itzhaki LS, Otzen DE, Davis B, Fersht AR. Hydrogen exchange in chymotrypsin inhibitor 2 probed by mutagenesis. J Mol Biol 1997;270:99 –110.
44. Jeng MF, Englander SW, Elove GA, Wand AJ, Roder H. Struc-tural description of acid-denatured cytochrome c by hydrogen exchange and 2D NMR. Biochemistry 1990;29:10433–10437. 45. Bai Y, Sosnick TR, Mayne L, Englander SW. Protein folding
intermediates: native-state hydrogen exchange. Science 1995;269: 192–197.
46. Bai Y, Englander SW. Future directions in folding: the multi-state nature of protein structure. Proteins 1996;24:145–151.
47. Hoang L, Bedard S, Krishna MM, Lin Y, Englander SW. Cyto-chrome c folding pathway: kinetic native-state hydrogen ex-change. Proc Natl Acad Sci USA 2002;99:12173–12178.
48. Mullins LS, Pace CN, Raushel FM. Conformational stability of ribonuclease T1 determined by hydrogen-deuterium exchange. Protein Sci 1997;6:1387–1395.
49. Sivaraman T, Kumar TK, Chang DK, Lin WY, Yu C. Events in the kinetic folding pathway of a small, all beta-sheet protein. J Biol Chem 1998;273:10181–10189.