國立交通大學
環境工程研究所
碩士論文
對-甲苯對於以硫酸還原菌降解菲之影響
Versatility of p-cresol in the degradation of phenanthrene
by sulfate reducing bacteria
研究生:郭信杰
指導教授:林志高 博士
對-甲苯對於以硫酸還原菌降解菲之影響
Versatility of p-cresol in the degradation of phenanthrene
by sulfate reducing bacteria
研究生:郭信杰 Student:Hsin-Chieh Kuo
指導教授:林志高 博士 Advisor:Dr. Jih-Gaw Lin
國立交通大學 環境工程研究所
碩士論文
A Thesis
Submitted to Institute of Environmental Engineering College of Engineering
National Chiao Tung University In Partial Fulfillment of the Requirements
For a Degree of Master of Science
In
Environmental Engineering March 2010
Hsinchu, Taiwan, Republic of China
對-甲苯對於以硫酸還原菌降解菲之影響
研究生:郭信杰 指導教授:林志高 博士
國立交通大學環境工程研究所
摘要
菲(phenanthrene, PHE)為多環芳香烴物質(polycyclic aromatic hydrocarbons, PAHs)之化合物,為環境中具頑抗性及毒性之分難解物質。已知可利用硫酸還 原菌(sulfate-reducing bacteria, SRB)做為優勢菌種降解菲;然而在我們的研究 中發現到之前研究未曾測出的對-甲苯(p-cresol)為其代謝產物,並且當兩化合 物同時存在時,對-甲苯對於菲的降解有著些許抑制性的影響。 本實驗的操作參數依照之前研究中所找出之最佳條件,改變菲及對-甲苯的 濃度以不同比例混合進行批次式之實驗。實驗規劃分為兩部分,第一部分固定菲 的濃度在 18.5 mg/L,而對-甲苯的濃度由 0 增加到 11.1 mg/L;第二部分依序降 低菲的濃度從 18.5 至 0 mg/L,而對-甲苯的濃度一樣由 0 增加到 11.1 mg/L。藉 由實驗結果探討對-甲苯對於菲之降解是否有其影響。 實驗結果顯示,在無對-甲苯的影響下菲的零階和一階動力反應 k 值分別為 0.35 mg/L・d 及 0.03/d;隨著對-甲苯的濃度增加降至最低的 0.1 mg/L・d 及 0.016/d, 顯示會逐漸抑制菲的降解效率。而對-甲苯本身的降解情形並未明顯地受到菲的 影響,初始濃度越高的對-甲苯其降解濃度值也越多。不論如何,對-甲苯相對於 菲的分子量及毒性較低,在此次實驗中是較優先利於 SRB 分解之化合物。 關鍵字:菲、對-甲苯、硫酸還原菌、抑制
Versatility of p-cresol in the degradation of phenanthrene
by sulfate reducing bacteria
Student: Hsin-Chieh Kuo Advisor: Dr. Jih-Gaw Lin
Institute of Environmental Engineering
National Chiao Tung University
Abstract
Phenanthrene (PHE) is one of the persistent polycyclic aromatic hydrocarbons (PAHs), which could produce toxicity for the environment. It is well known that PHE could be degraded by sulfate-reducing bacteria (SRB). Nevertheless, it is reported that
p-cresol is the metabolite of PHE. When these two compounds exist in the
environment at the same time, i.e. PHE and p-cresol, p-cresol is likely to have inhibition in the biodegradation of PHE.
The batch biodegradation experimental conditions were followed from the optical parameters by our previous study (Ref.). The experimental design was separated into two parts: in Part-1, the PHE concentration was kept constant at 18.5
mg/L whereas the p-cresol concentration was increased from 0 to 11.1 mg/L; in Part-2, the PHE concentration was decreased from 18.5 to 0 mg/L, and at the same time
p-cresol concentration was increased from 0 to 11.1 mg/L.
The experimental outcomes indicate that the k values of PHE degradation without p-cresol following the zero-order and first-order kinetics were 0.35 mg/L・d and 0.03/d. In the presence of p-cresol, the k-values were decreased to 0.1 mg/L・d and 0.016/d. These observations demonstrate that p-cresol addition has significant inhibition in the biodegradation of PHE. However, the p-cresol degradation is not significantly affected by PHE. The degradation of p-cresol was increased with the increase in the addition of p-cresol concentration. The molecular weight and toxicity of p-cresol are lower than PHE; thus, p-cresol is preferred over PHE by the SRB.
Contents
中文摘要……….i Abstract………..ii Contents……….iv List of Figures………..vii List of Tables……….ix Chapter 1 Introduction………...1 1.1 Background………..1 1.2 Objective………...2 1.3 Subject………..2Chapter 2 Literature Review………..3
2.1 Characteristics………..3
2.1.1 Phenanthrene……….3
2.1.2 p-Cresol……….3
2.2 Anaerobic Biodegradation under Sulfate-Reducing Condition………5
2.2.1 Anaerobic Biodegradation……….5
2.2.2 Sulfate-Reducing Bacteria………5
2.3.1 Contaminant Concentration……….…..7
2.3.2 Concentration of Electron Acceptor………..8
2.3.3 Biomass Concentration……….8
2.3.4 pH and Temperature………..9
2.4 Metabolites and Probable Inhibition………9
Chapter 3 Material and Methods………..13
3.1 Introduction………....13 3.1 Materials………...………..13 3.2.1 Phenanthrene………...13 3.2.2 p-Cresol………...13 3.3 Bacterial Enrichment………..17 3.3.1 Composition of Medium……….17 3.3.2 Incubation of SRB………...17
3.4 Experimental Methods and Design………19
3.4.1 Background……….19
3.4.2 Sampling………..21
3.4.3 Experiment Design………..21
3.5 Analytical Techniques……….………...24
3.5.2 Phenanthrene Concentration………25
3.5.3 p-Cresol Concentration………...26
3.5.4 Sulfate Concentration………..27
Chapter 4 Results and Discussion………28
4.1 pH variation………28
4.2 Variation of SRB biomass………..30
4.3 Sulfate Reduction……….………..31
4.4 Phenanthrene Degradation……….33
4.4.1 Degradation of Single Compound………...33
4.4.2 Effect of Different p-Cresol Concentrations on PHE………..34
4.5 p-Cresol Variation………...38
4.5.1 Produced from Phenanthrene………..38
4.5.2 The Degradation of p-Cresol………...39
4.6 Kinetics under Different Phenanthrene and p-Cresol Concentrations………...45
4.7 The effect of p-cresol on phenanthrene biodegradation……….48
Chapter 5 Conclusions……….50
List of Figures
Fig. 2-1 Degradation pathway of phenanthrene by SRB………..11
Fig. 3-1 Experimental flowchart………..14
Fig. 3-2 Schematic diagram of incubation system………...18
Fig. 3-3 SRB Biomass calibration curve……….….24
Fig. 3-4 Phenanthrene calibration curve………...25
Fig. 3-5 p-Cresol calibration curve………...26
Fig. 4-1 pH variation in Part-1...………..29
Fig. 4-2 pH variation in Part-2……….29
Fig. 4-3 Variation of Bacterial Biomass in Part-1...………...30
Fig. 4-4 Variation of Bacterial Biomass in Part-2………31
Fig. 4-5 Degradation of phenanthrene without p-cresol………...33
Fig. 4-6 Degradation of phenanthrene in Part-1...………36
Fig.4-7 Degradation of phenanthrene in Part-2………....37
Fig. 4-8 Degradation of phenanthrene and variation of p-cresol in Run-1….…...39
Fig. 4-9 Degradation of p-cresol without phenanthrene………...40
Fig.4-10 The actual variation and the theoretical quantity of p-cresol production…..43
Fig.4-12 The correlation between phenanthrene/p-cresol consumption and SRB biomass………...49
List of Tables
Table 2-1 The physicochemical properties of the phenanthrene and p-cresols………..4
Table 2-2 Literature on the degradation parameters of phenanthrene and p-cresol…...6
Table 2-3 Inhibition of metabolites in the degradation of cresols………12
Table 3-1 Chemicals and reagents used in this study………...15
Table 3-1 Chemicals and reagents used in this study (continued)………...16
Table 3-2 Experiment optimal parameter condition……….23
Table 3-3 Experiment design for 2 parts………..20
Table 4-1 PHE and p-cresol degradation and sulfate reduction percentages in the anaerobic system………..32
Table 4-2 Quantity of p-Cresol Degradation………44
Chapter 1
Introduction
1.1 Background
Phenanthrene (PHE) is one of the polycyclic aromatic hydrocarbons (PAHs), which are toxic, persistent in the environment and resistance to microbial degradation (Coates et al., 1996). Previous studies have demonstrated that PAHs can be effectively degraded under anaerobic conditions (Coates et al., 1997; Chang et al., 2002). The most effective degradation rate of PAHs was observed under sulfate reducing conditions (Chang et al., 2002). In our previous study, p-cresol was identified as the major metabolite of PHE. At the same time, several studies have established that
p-cresol was degraded under sulfate reducing conditions (Smolenskit and Suflita,
1987; Londry et al., 1999). Recently, our research group has identified that p-cresol is the metabolite of PHE degradation by sulfate-reducing bacteria (SRB) (Tsai et al., 2009). In addition, the initial concentration of PHE (5 mg/L) was decreased to 0.6 mg/L (89% removal) after 21 days of incubation. When 5 mg/L of p-cresol was added in the same system, the degradation rate of PHE was reduced to 83%. This result indicates that the presence of p-cresol has inhibitory effect on the degradation of PHE.
1.2 Objective
The main objective of the present study is to investigate the effect of various p-cresol concentrations on the degradation of PHE under a set of optimized sulfate-reducing condition. Subsequently, to compare the degradation rates and kinetics obtained in this study with the literature data.
1.3 Subject
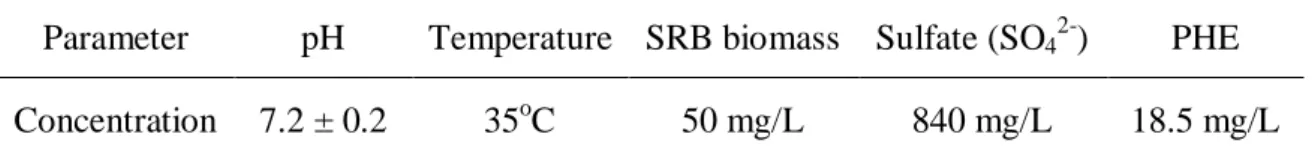
The batch experiments include (1) single compound either PHE or p-cresol, and (2) mixture of them. The experiments were evaluated by measuring pH, sulfate concentration, SRB biomass, PHE and p-cresol concentrations. The experiments were conducted under predetermined optimal conditions estimated by Tsai et al. (2009) i.e. pH ~ 7.2 ± 0.2, temperature 35oC, initial concentration of SRB biomass ~ 50 mg/L and sulfate concentration ~ 840 mg/L. PHE initial concentration is 18.5 mg/L and
p-cresol is calculated to 11.1 mg/L by the stoichiometry (1).
In the present study, the PHE concentration was maintained at 18.5 mg/L. Using the stoichiometric equation (1) (assuming complete conversion of PHE into p-cresol), the quantity of p-cresol produced in the system is found to be 11.1 mg/L.
Chapter 2
Literature Review
2.1 Characteristics
2.1.1 Phenanthrene
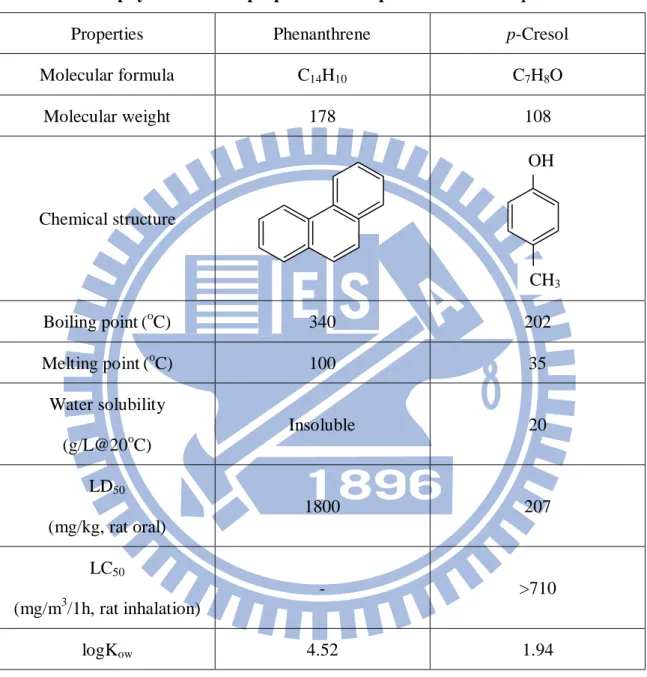
Phenanthrene (PHE) is a three-ring polycyclic aromatic hydrocarbon (PAH). It is a common pollutant released from many anthropogenic processes such as incomplete combustion of fossil fuels, vehicle exhaust and petroleum refining. The physicochemical properties of PHE are listed in Table 2-1. Chang et al. (2002) demonstrated that two- and three-ring PAHs could be degraded anaerobically, and biodegradation is the most likely removal mechanism for three-ring PAHs.
2.1.2 p-Cresol
p-Cresol is highly soluble in water and can be found in many wastewater streams
originate from petroleum refinery plants (Charest et al., 1999). The physicochemical properties of p-Cresol are listed in Table 2-1. The presence of p-cresol in wastewaters is inhibitory to the bioactivity of microorganisms (Londry and Fedorak, 1992). The treatment of these wastewaters containing high concentrations of cresol compounds by an anaerobic process may be a viable option from the perspective of increasingly
tight environmental regulations.
Table 2-1 The physicochemical properties of the phenanthrene and p-cresols
Properties Phenanthrene p-Cresol
Molecular formula C14H10 C7H8O Molecular weight 178 108 Chemical structure Boiling point(oC) 340 202 Melting point(oC) 100 35 Water solubility (g/L@20oC) Insoluble 20 LD50 (mg/kg, rat oral) 1800 207 LC50 (mg/m3/1h, rat inhalation) - >710 logKow 4.52 1.94 CH3 OH
2.2 Anaerobic Biodegradation under Sulfate-Reducing Condition
2.2.1 Anaerobic Biodegradation
Degradation of p-cresol under aerobic condition was considerably faster than anaerobic condition (Khoury et al., 1992). However, aerobic bioremediation processes were quite expensive, since it relies on aeration (Coates et al., 1996). Anaerobic bioremediation was desirable because many of the contaminated sites were already anaerobic and the effectiveness and cost of oxygen delivery to the contaminated sites might be formidable (So and Young, 1999).
2.2.2 Sulfate-Reducing Bacteria
Several researchers demonstrated the degradation of PHE and p-cresol under various anaerobic conditions such as methanogenic, sulfate-reducing, and nitrate-reducing (Londry et al., 1999). Chang et al. (2002) reported that the most effective degradation rate of PAHs was observed under sulfate reducing condition. The high-to-low degradation rates for PAHs occurred in the order of sulfate-reducing conditions > methanogenic conditions > nitrate-reducing conditions. In addition, the degradation of cresols were favored under sulfate-reducing and nitrate-reducing conditions, but no significant loss was observed from methanogenic conditions unless a prolonged incubation time was provided (Smolenski and Suflita, 1987).
Most commonly, SRB are associated with freshwater and marine sediments (Riser-Roberts, 1998). SRB prefer strict anaerobic condition, utilize organic substrates as sources of carbon and energy, and sulfate as electron-acceptor. These bacteria are capable of degrading aromatic compounds such as PAHs, cresols, benzoate and phenols. (Odom and Singleton, 1993; Paul and Clark, 1996). Table 2-2 shows a list of PHE and p-cresol (or m-cresol, an isomer with p-cresol) degradation studies carried out using SRB.
Table 2-2 Literature on the degradation parameters of phenanthrene and
p-cresol Compound Inoculum pH Temperature (℃) Sulfate Concentration (mg/L) Initial Concentration (mg/L) Degradation Rate (%) Degradation Time (d) Reference Phenanthrene PAH-contaminated sediment 7.2 30 1920 16.2 100 150 Zhang and Young, 1997 Phenanthrene PAH-contaminated sediment - 20 2880 160 40 130 Lei et al., 2005 p-Cresol Desulfotomaculum sp. strain Groll 7.0 32 - 37 - 10.8 100 18 Londry et al., 1999 p-Cresol Shallow anaerobic sand aquifer - 30 160 21.6 90 10 Smolenskit and Suflita, 1987 m-Cresol Desulfotomaculum sp. strain Groll 7.3 32 960 32.4 100 20 Müller et al., 1997 m-Cresol Anoxic aquifer slurries 7.0 - 200 32.4 100 38 Ramanand and Suflita, 1991
2.3 Factors Affecting PAH Biodegradation
The degradation rate of PAH in the environment depends on various factors including contaminant characteristics, concentration of electron acceptor, biomass concentration, presence of other carbon sources, nutrient limitations, pH and temperature (Tsai et al., 2009). The effects of these parameters on PAH biodegradation are described in the following sections.
2.3.1 Contaminant Concentration
Contaminant (electron donor) concentration can influence the biodegradation efficiency. Tsai et al. (2009) indicated that the cessation of biodegradation can be explained by the growth limitation of PAH-degrading microorganisms when the aqueous phase concentration of the PAH is below the threshold concentration. In other words, an electron donor present in low concentration could only be adequate to maintain the energy requirement, but will not support the growth of microorganisms. However, a high concentration of PAH could also decrease the degradation rate of PAH by inhibiting the activity of microorganisms. The inhibitory effects are manifested as reduced microbial growth rates, lower biomass yields, and decreases in PAH biodegradation rates. Therefore, it is very important to evaluate the range of PAH concentration that can be treated by SRB.
2.3.2 Concentration of Electron Acceptor
In the anaerobic biodegradation of PAHs under sulfate-reducing conditions, the concentration of the electron acceptor, i.e. sulfate, plays a significant role. Numerous researchers studied the anaerobic biodegradation of PAHs under sulfate-reducing conditions with various initial sulfate concentrations. They demonstrated that the extent of sulfate reduction depend on the feed sulfate concentration (Baskaran and Nemati, 2006). Moreover, the high sulfate concentration during biodegradation of PHE inhibited the enzyme synthesis activity of SRB and reduced the biodegradation rate of PHE. Kleikemper et al. (2002) also proposed that sulfate reduction in the sediment was more limited by the availability of sulfate than by that of organic carbon sources.
2.3.3 Biomass Concentration
The presence of active microorganisms capable of degrading PAHs is a necessary factor for efficient and rapid biodegradation of PAHs. Microorganisms must be present in sufficient numbers and produce necessary enzymes to perform the degradation process. It is widely accepted that the rate and extent of PAH biodegradation are related to the biomass concentration (Tsai et al., 2009). However,
at too high biomass concentration, the cells will compete for space, nutrients and carbon dioxide.
2.3.4 pH and Temperature
pH and temperature play important roles in microbial activity and controlling the nature and extent of degradation. The most preferred pH range for many microorganisms is 5 - 8, and the optimal pH for SRB growth is around 7 (Tsai et al., 2009). Usually, both metabolic activity and biodegradation rate decrease in response to a temperature drop. At low temperatures, the activity of enzymes is reduced, and subsequently slow down the biodegradation rate. In addition, increase in temperature increases the diffusion rates of organic compounds, which leads to increases in the bioavailability of hydrophobic contaminant.
2.4 Metabolites and Probable Inhibition
In the previous study conducted by our research group, p-cresol was identified as the major metabolite of PHE (Tsai et al., 2009). Moreover, when PHE and p-cresol were co-existed, p-cresol had slight inhibition to the degradation of PHE. In the past, a variety of mechanisms have been reported for the removal of cresols under anaerobic
conditions. The degradation pattern of cresol by anaerobic bacteria is similar to that of aerobic bacteria (Holliger and Zehnder, 1996). First, cresol is transformed into few central intermediates, such as p-hydroxybenzaldehyde, p-hydroxybenzoate, and benzoate (Bossert and Young, 1986; Smolenski and Suflita, 1987; Londry et al., 1997). Subsequently, the aromatic ring is activated and cleaved, and the resulting non-cyclic compounds are converted into central metabolites. Fig. 2-1 shows the biodegradation pathway of PHE by the activity of SRB.
Phenanthrene
Spontaneous compounds p-Cresol
OH CH3 OH CH2OH OH CHO OH COOH Hydrocarbon / H2O COOH
p-Hydroxybenzyl alcohol acid
p-Hydroxybenzaldehyde acid
p-Hydroxybenzoate acid
Benzoate acid
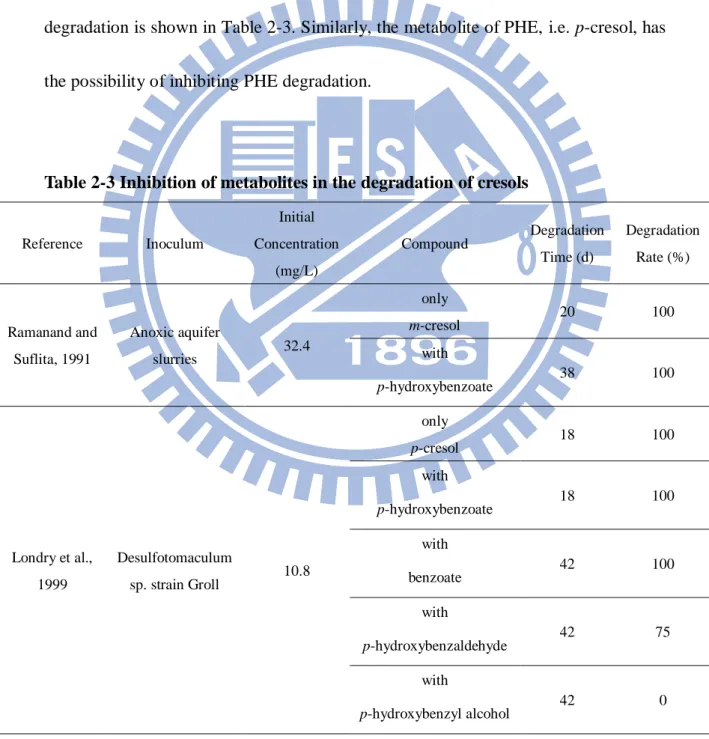
Ramanand and Suflita (1991) demonstrated that the metabolites of cresol, i.e.
p-hydroxybenzoate, has inhibition on cresol degradation. In addition, the degradation
of p-hydroxybenzoate was preferred over cresol in anaerobic condition. The consumption of cresol was unlikely until p-hydroxybenzoate was decarboxylated and converted to phenol. The other analogous reference to the inhibition of p-cresol degradation is shown in Table 2-3. Similarly, the metabolite of PHE, i.e. p-cresol, has the possibility of inhibiting PHE degradation.
Table 2-3 Inhibition of metabolites in the degradation of cresols
Reference Inoculum Initial Concentration (mg/L) Compound Degradation Time (d) Degradation Rate (%) Ramanand and Suflita, 1991 Anoxic aquifer slurries 32.4 only m-cresol 20 100 with p-hydroxybenzoate 38 100 Londry et al., 1999 Desulfotomaculum sp. strain Groll 10.8 only p-cresol 18 100 with p-hydroxybenzoate 18 100 with benzoate 42 100 with p-hydroxybenzaldehyde 42 75 with p-hydroxybenzyl alcohol 42 0
Chapter 3
Materials and Methods
3.1 Introduction
The optimal condition for PHE degradation identified in our previous study was followed in the present work. Fig. 3-1 shows the research flowchart of this study.
3.2 Materials
3.2.1 Phenanthrene
PHE (>97%) was purchased from Fluka Chemical (Germany). The PHE stock solution was prepared in N,N-dimethylformamide (DMF) at 18500 mg/L and stored in dark at 4oC. Dichloromethane (DCM) was used as the extraction solution of PHE.
3.2.2 p-Cresol
p-Cresol (>99.5%) was purchased from Sigma-Aldrich (USA). The p-cresol stock solution was prepared in DI-water at 11100 mg/L and stored in dark at 4oC. All chemicals, reagents and solvents used in this experiment are listed in Table 3-1.
SRB enrichment
Experiment study
Single compound
Mixed compound
Conclusion
Degradation Rate
Comparison
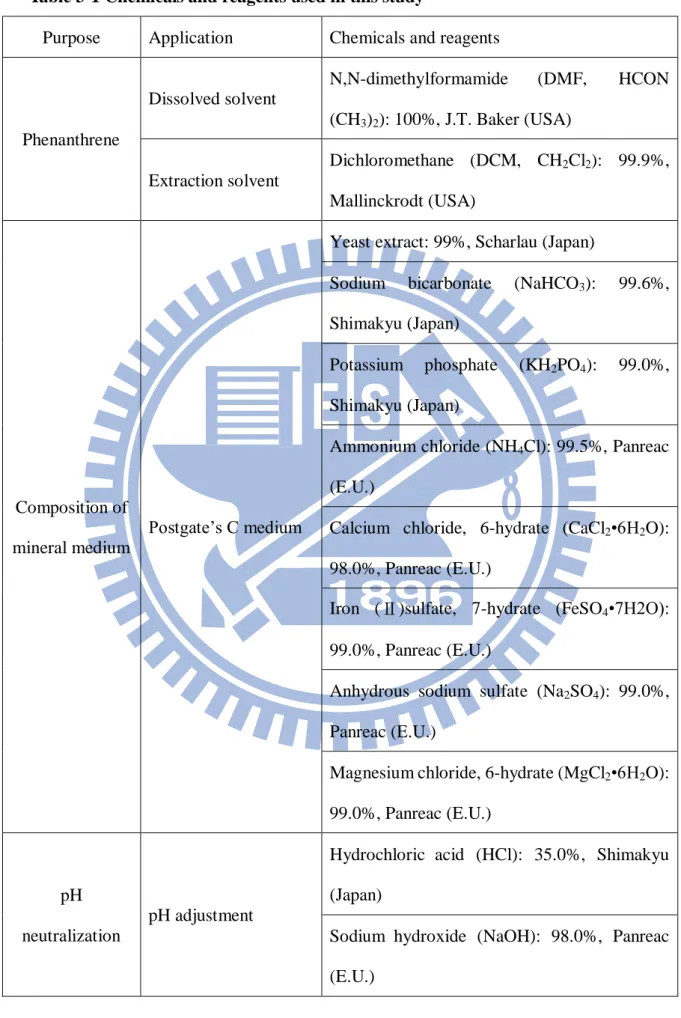
Table 3-1 Chemicals and reagents used in this study
Purpose Application Chemicals and reagents
Phenanthrene Dissolved solvent N,N-dimethylformamide (DMF, HCON (CH3)2): 100%, J.T. Baker (USA) Extraction solvent Dichloromethane (DCM, CH2Cl2): 99.9%, Mallinckrodt (USA) Composition of mineral medium Postgate’s C medium
Yeast extract: 99%, Scharlau (Japan)
Sodium bicarbonate (NaHCO3): 99.6%,
Shimakyu (Japan)
Potassium phosphate (KH2PO4): 99.0%,
Shimakyu (Japan)
Ammonium chloride (NH4Cl): 99.5%, Panreac
(E.U.)
Calcium chloride, 6-hydrate (CaCl2•6H2O):
98.0%, Panreac (E.U.)
Iron (Ⅱ)sulfate, 7-hydrate (FeSO4•7H2O):
99.0%, Panreac (E.U.)
Anhydrous sodium sulfate (Na2SO4): 99.0%,
Panreac (E.U.)
Magnesium chloride, 6-hydrate (MgCl2•6H2O):
99.0%, Panreac (E.U.)
pH neutralization
pH adjustment
Hydrochloric acid (HCl): 35.0%, Shimakyu (Japan)
Sodium hydroxide (NaOH): 98.0%, Panreac (E.U.)
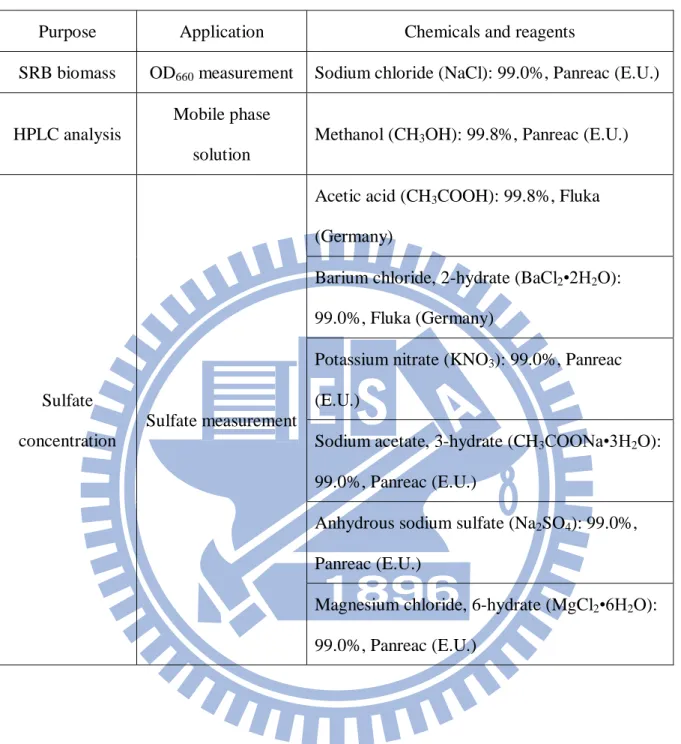
Table 3-1 Chemicals and reagents used in this study (continued)
Purpose Application Chemicals and reagents
SRB biomass OD660 measurement Sodium chloride (NaCl): 99.0%, Panreac (E.U.)
HPLC analysis
Mobile phase solution
Methanol (CH3OH): 99.8%, Panreac (E.U.)
Sulfate concentration
Sulfate measurement
Acetic acid (CH3COOH): 99.8%, Fluka
(Germany)
Barium chloride, 2-hydrate (BaCl2•2H2O):
99.0%, Fluka (Germany)
Potassium nitrate (KNO3): 99.0%, Panreac
(E.U.)
Sodium acetate, 3-hydrate (CH3COONa•3H2O):
99.0%, Panreac (E.U.)
Anhydrous sodium sulfate (Na2SO4): 99.0%,
Panreac (E.U.)
Magnesium chloride, 6-hydrate (MgCl2•6H2O):
3.3 Bacterial Enrichment
3.3.1 Composition of Medium
A modified Postgate’s C medium (Postgate, 1984) was used as the growth substrate for culturing SRB. The medium contains the following constituents in 1L DI-water: 2.84 g Na2SO4, 0.5 g yeast extract, 1 g NH4Cl, 0.02 g FeSO4·7H2O, 2.52 g NaHCO3, 0.5 g
KH2PO4, 0.06 g MgCl2·6H2O and 0.06 g CaCl2·6H2O. Na2SO4 was added as the
electron acceptor. The yeast extract and NH4Cl were used as organic and inorganic
nitrogen sources, respectively. FeSO4.7H2O was used as a scavenger of the produced
sulfide to minimize the sulfide toxicity (Bedessem et al., 1997). After nutrient addition, the final pH was adjusted to 7.0-7.2 with HCl and/or NaOH. The medium was sterilized by using autoclave at 121oC for 30 min and cooled over night to room temperature prior to use.
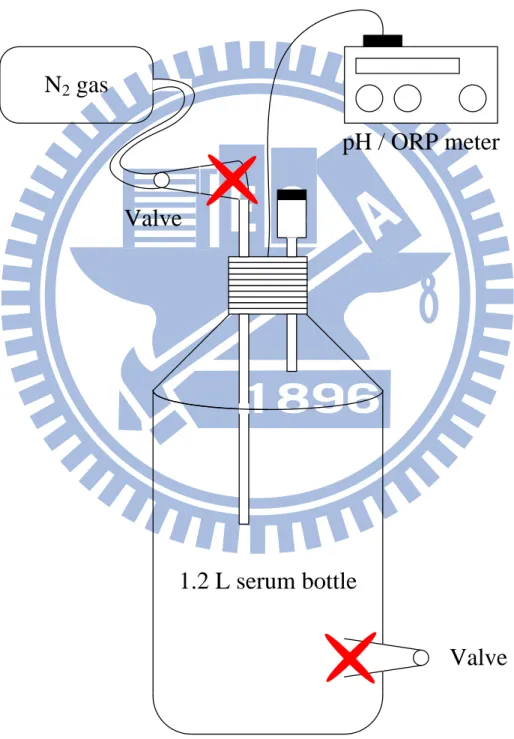
3.3.2 Incubation of SRB
A specially-designed 1.2-L serum bottle (Schott, Germany) fitted with pH and oxidation reduction potential (ORP) probes was used as an incubator (Fig. 3-2). The concentrated SRB biomass after centrifugation was diluted to 50 mg/L with modified Postgate’s C medium (no Na2SO4 adding); and Na2SO4 was added to result a final
filter-sterilized high purity nitrogen gas (99.99%) for 10 min at a flow rate of 10 L/min to remove the residual dissolved oxygen in the medium and then the pH was adjusted to 7.2 0.2 by using HCl and/or NaOH.
N
2gas
pH / ORP meter
Valve
Valve
1.2 L serum bottle
Subsequently, PHE and/or p-cresol was added as per the experiment design. Immediately after the addition of PHE and/or p-cresol, the incubator was sealed with a Teflon-lined cap and the headspace of the incubator was replaced again with nitrogen gas. Finally, the incubator was placed in a temperature-controlled dark chamber at 35oC for 30 d.
3.4 Experimental Methods and Design
3.4.1 Background
The pre-optimized growth conditions were followed, (Table 3-2). From the stoichiometry (1).
The mineralization ratio of PHE (C14H10) to p-cresol (C7H8O) under anaerobic sulfate
reducing condition is 1 : 0.6. Considering the maximum molecular reduction of phenanthrene to p-cresol as 1 : 0.6, the PHE and p-cresol concentrations are designed between 0 to 18.5 mg/L and 0 to 11.1 mg/L, respectively. Batch experiments were carried out to estimate the effect of various p-cresol concentrations on the rate of PHE biodegradation.
Table 3-2 Experiment optimal parameter condition
Parameter pH Temperature SRB biomass Sulfate (SO42-) PHE
3.4.2 Sampling
During the experimental period, i.e. 30 days, samples were collected on 0, 3, 6, 9, 12, 18, 21 and 30 days. At each sampling day, the serum bottles were taken from 35oC temperature-controlled chamber and stirred on the magnetic stirrer. The 45-mL centrifugal tubes were used to collect about 20-30 mL of sample for analysis. Exactly 10 mL of DCM was added in the Teflon tubes with 10 mL sample and shaken for 24 h at room temperature. Subsequently, 1 mL of sample was added into a 1.5 mL micro centrifugal tube and centrifuged at 10,000 rpm for 3 min, and the clear supernatant liquid was analyzed for p-cresol. Eventually, the residual samples were measured for pH. At the same time, 10 mL of sample was centrifuged, and the supernatant was replaced with 0.8% NaCl to measure SRB biomass.
3.4.3 Experiment Design
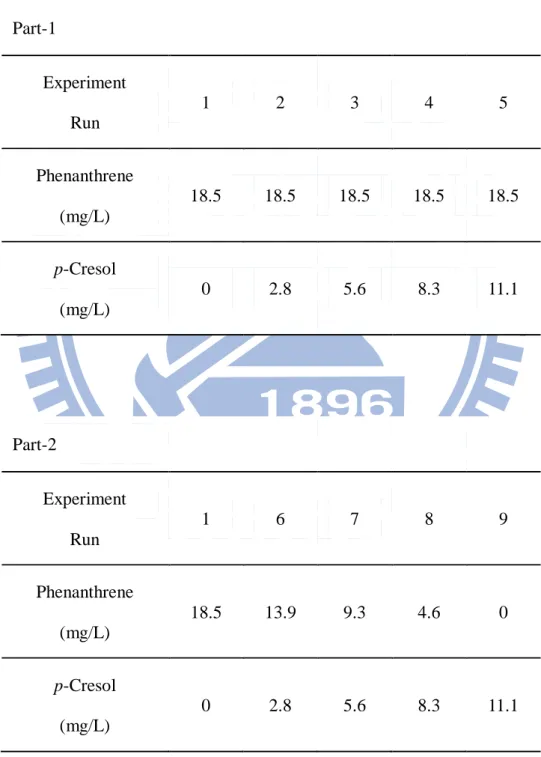
The experiments were conducted individually (in the presence of p-cresol or PHE), and with mixture (both p-cresol and PHE). Single compound experiments were used to represent the degradation of PHE or p-cresol only, and the mixture compounds experiments were used to evaluate the effect of p-cresol on PHE biodegradation. The Experiments were divided into two parts (Table 3-3): Part-1 was the fixed concentration of PHE at 18.5 mg/L, and the p-cresol concentration was varied from 0
to 11.1 mg/L. In Part-2, the p-cresol concentration was equally increased from 0 to 11.1 mg/L, but the PHE concentration was decreased from 18.5 to 0 mg/L (Table 3-3). The experimental Run-1 and Run-9 were conducted with only PHE and p-cresol, at 18.5 and 11.1 mg/L, respectively.
Table 3-3 Experiment design for 2 parts, (I) phenanthrene fixed at 18.5 mg/L and
p-cresol increased from 0 to 11.1 mg/L , (II) phenanthrene decreased from 18.5 to
0 mg/L and p-cresol increased from 0 to 11.1 mg/L.
Part-1 Experiment Run 1 2 3 4 5 Phenanthrene (mg/L) 18.5 18.5 18.5 18.5 18.5 p-Cresol (mg/L) 0 2.8 5.6 8.3 11.1 Part-2 Experiment Run 1 6 7 8 9 Phenanthrene (mg/L) 18.5 13.9 9.3 4.6 0 p-Cresol (mg/L) 0 2.8 5.6 8.3 11.1
3.5 Analytical Techniques
3.5.1 Quantification of SRB
Before analyzing the biomass concentration, a calibration curve was established between the mixed liquid volatile suspended solid (MLVSS) concentration and OD660.
The MLVSS was indicated as the bacterial cell density. The OD660 measurements were
taken using an UV digital spectrometer at 660 nm where 0.8% NaCl reagent was used as a blank. The calibration curve for quantifying SRB, i.e. VSS versus absorbance (biomass concentration), is shown in Fig. 3-3.
Fig. 3-3 SRB Biomass calibration curve
R² = 0.99 0 20 40 60 80 100 0 0.04 0.08 0.12 0.16 V S S ( m g/ L ) Abs
3.5.2 Phenanthrene Concentration
The sample and DCM were added into a Teflon tube and shaken for 24 h. After 24 h, the extracted PHE in the bottom layer was separated and taken for analysis in GC-FID. For the operative condition of GC-FID, hydrogen gas and air flow rates were maintained at 40 and 400 mL/min, respectively. Nitrogen gas was used as carrier and make-up gases supplied at a rate of 3 and 22 mL/min, respectively. The oven was maintained initially at 120oC for 1 min, and then increased at 20oC/min to 280oC, where it was held at that temperature for 2 min. Both injector and detector temperatures were maintained at 280oC. The total runtime was 11 min and the peak area was converted to concentrations by the calibration curve of PHE (Fig. 3-4).
Fig. 3-4 Phenanthrene calibration curve
R² = 0.99 0 300 600 900 1200 1500 1800 0 10 20 30 40 50 60 Peak ar ea Phenanthrene concentration (mg/L)
3.5.3 p-Cresol Concentration
p-Cresol was analyzed by using HPLC with UV-VIS detector. The mobile phase
consisted of a mixture of methanol and water (1:1, v:v) at a flow rate of 1 mL/min, and the p-cresol was identified at a wavelength of 254 nm. Under this condition,
p-cresol was detected at 8.8 min and quantified using the calibration curve as shown in
Fig. 3-5.
Fig. 3-5 p-Cresol calibration curve
R² = 0.99 0 100000 200000 300000 400000 500000 0 10 20 30 40 P ea k ar ea p-Cresol concentration (mg/L)
3.5.4 Sulfate Concentration
The sample collected at various time intervals were filtered through 0.2 m filter papers and taken for sulfate measurement by turbidimetric method (Method 4500-SO42--E) as described in the Standard Methods (APHA et al., 2005). In this
method, barium chloride (BaCl2) was used for crystallization of sulfate ion to barium
sulfate (BaSO4). The calibration curve was established for each measurement, and it
Chapter 4
Results and Discussion
4.1 pH Variation
In the first 3 days of experiments, a slight decrease in pH was observed. This could be due to the decomposition of PHE/p-cresol attributed to the acidogenic process. Thereafter, the pH of the system was increased as a result of fermentation. Moreover, the Postgate’s C medium was used for cultural medium, which includes NaHCO3 (pH
buffer). Therefore, the variations of pH were not significant in these experimental runs. The pH variations in Part-1 and Part-2 are shown in Fig. 4-1 and Fig.4-2, respectively.
Fig. 4-1 pH variation in Part-1. The presented data are mean values of duplicate incubations.
Fig. 4-2 pH variation in Part-2. The presented data are mean values of duplicate incubations. 6.0 6.5 7.0 7.5 8.0 0 5 10 15 20 25 30 pH Time (d) Run-1 Run-2 Run-3 6.0 6.5 7.0 7.5 8.0 0 5 10 15 20 25 30 pH Time (d) Run-1 Run-6 Run-7 Run-8 Run-9
4.2 Variation of SRB biomass
The profiles of SRB biomass are shown in Fig. 4-3 (Part-1) and Fig.4-4 (Part-2). The initial biomass concentrations in all the experiment runs were at 50 mg/L. The increase in biomass was observed when PHE and p-cresol were consumed as the carbon sourced by the SRB. In the initial period, the SRB biomass was increased without a lag phase. This has a positive correlation with the biodegradation of PHE and p-cresol. After 30 days of Part-1, the maximum bacterial biomass was observed at 157 mg/L in Run-5, which has the highest PHE and p-cresol concentration. In Part-2, the maximum bacterial biomass was observed in Run-1 at the end of 30 days. However, the SRB biomass was maximum in Run-9 at the end of 10 days.
Fig. 4-3 Variation of SRB biomass in Part-1. The presented data are mean values
0 50 100 150 200 0 5 10 15 20 25 30 C o n ce n tra ti o n , m g/L Time (d) Run-1 Run-2 Run-3
Fig. 4-4 Variation of SRB biomass in Part-2. The presented data are mean values of duplicate incubations.
4.3 Sulfate Reduction
Sulfate is utilized as a final electron acceptor during the PHE and p-cresol biodegradation by SRB. Therefore, biodegradation can be estimated from the sulfate consumption. The percentages of sulfate reduction, PHE and p-cresol degradation in Run-1 to Run-9 were shown in Table 4-1. Although the PHE degradation rate (58%) was lower than p-cresol (71%), the sulfate reduction was 28% and 24% in Run-1 and Run-9, respectively. This could be due to the higher molecular weight of PHE than
p-cresol. However, the highest sulfate reduction was 34% in Run-5 with highest PHE
(18.5 mg/L) and p-cresol (11.1 mg/L) concentration. 0 50 100 150 200 0 5 10 15 20 25 30 C o n ce n tra ti o n , m g/L Time (d) Run-1 Run-6 Run-7
Table 4-1 PHE and p-cresol degradation and sulfate reduction percentages in the anaerobic system. Run PHE degradation (%) p-Cresol degradation (%) Sulfate reduction (%) 1 58 - 28 2 55 - 29 3 51 - 30 4 44 - 33 5 36 - 34 6 54 - 23 7 61 - 20 8 70 - 19 9 - 71 24
4.4 Phenanthrene Degradation
4.4.1 Degradation of Single Compound
In Run-1, the degradation of PHE (without p-cresol) had a rapid initial phase followed by a slower and longer phase (Fig. 4-5). PHE concentration was reduced from 17.6 to 7.3 mg/L. More than 50% of PHE was degraded within 18 days, and nearly 60% of PHE was degraded in 30 days. PHE degradation was in good agreement with the growth of SRB biomass. Both these profiles have shown acute variation in the beginning of experiment period and became slow in the later period.
Fig. 4-5 Degradation of phenanthrene without p-cresol. The concentration of degradation, mg/L (●); the percentage of degradation, % (○). The presented
0 20 40 60 80 100 0 4 8 12 16 20 0 5 10 15 20 25 30 D e gr ad at io n , % C o n ce n tra ti o n , m g/L Time (d)
4.4.2 Effect of Different p-Cresol Concentrations on PHE
In Part-1, PHE concentration was stabilized at 18.5 mg/L, and the concentration of
p-cresol was increased gradually from 0, 2.8, 5.6, 8.3, 11.1 mg/L. The result of
increasing p-cresol concentration in the degradation of PHE is shown in Fig. 4-6. It was observed that the runs with lower p-cresol concentration (2.8, 5.6 mg/L) were almost without the effect of inhibition. But at higher concentration (8.3, 11.1 mg/L) of
p-cresol, it could distinguish evidently the inhibitive effect from lower p-cresol
concentration. PHE removal was reduced from 59 to 36% when the concentration of
p-cresol was increased from 0 to 11.1 mg/L.
In Part-2, the concentration of p-cresol was the same as Part-1, but PHE concentration was decreased from 18.5, 13.9, 9.3 to 4.6 mg/L, respectively. The profiles of PHE in Part-1 and Part-2 are shown in Fig. 4-7. It was evident that the lower initial concentration of PHE, i.e. 4.6 mg/L, had higher removal percentage (71%) even at higher concentration of p-cresol, i.e. 8.3 mg/L. The result shows that SRB activity was decreased at higher concentration of PHE, which could be attributed to the preference in the utilization of simpler compounds in the presence of PHE by the SRB (Samanta et al., 1999).
In comparison with our previous study by Tsai et al. (2009), the PHE degradation by using SRB was separated into two experimental parts; one was only PHE degradation without phenol and p-cresol, and the other one was in the presence of phenol and
p-cresol. In the absence of phenol and p-cresol, the first-order kinetic k value of PHE
degradation rate was 0.099/d and 89% PHE removal was observed. On the other hand, in the presence of phenol and p-cresol, the first-order kinetic k value of PHE degradation rate was decreased to 0.077/d, and the PHE removal was 83%.
Fig. 4-6 Degradation of phenanthrene in Part-1. The concentration of p-cresol was (a) 2.8, (b) 5.6, (c) 8.3 and (d) 11.1 mg/L, respectively. The concentration of degradation, mg/L (●); the percentage of degradation, % (○). The presented data are mean values of duplicate incubations.
0 20 40 60 80 100 0 4 8 12 16 20 0 5 10 15 20 25 30 D egr ad at io n , % C o n ce n tra ti o n , m g/L Time (d) 0 20 40 60 80 100 0 4 8 12 16 20 0 5 10 15 20 25 30 D eg ra d a ti o n , % C o n ce n tra ti o n , m g/L Time (d) 0 20 40 60 80 100 0 4 8 12 16 20 0 5 10 15 20 25 30 D eg ra d a ti o n , % C o n ce n tra ti o n , m g/L Time (d) 0 20 40 60 80 100 0 4 8 12 16 20 0 5 10 15 20 25 30 D eg ra d a ti o n , % C o n ce n tra ti o n , m g/L Time (d) (a) (b) (c) (d)
Fig.4-7 Degradation of phenanthrene in Part-2. The concentration of p-cresol was (a) 2.8, (b) 5.6 and (c) 8.3, respectively. The concentration of degradation, mg/L (●); the percentage of degradation, % (○). The presented data are mean values of duplicate incubations.
0 20 40 60 80 100 0 3 6 9 12 15 0 5 10 15 20 25 30 D egr ad at io n , % C o n ce n tra ti o n , m g/L Time (d) 0 20 40 60 80 100 0 2 4 6 8 10 0 5 10 15 20 25 30 D egr ad at io n , % C o n ce n tra ti o n , m g/L Time (d) 0 20 40 60 80 100 0 2 4 6 0 5 10 15 20 25 30 D egr ad at io n , % C o n ce n tra ti o n , m g/L Time (d) (a) (b) (c)
4.5 p-Cresol Variation
4.5.1 Produced from Phenanthrene
As per the stoichiometry of PHE degradation to p-cresol (1 : 0.6), about 6.2 mg/L of
p-cresol could be produced in Run-1 after 30 days. However, the highest p-cresol
concentration observed was 1.5 mg/L on 6 day, and degraded to almost 0 mg/L in the end of experiment period. The measurement of p-cresol concentration was always below the theoretical production of p-cresol. This demonstrates that p-cresol was degraded continually without the inhibition of PHE. Nevertheless, this result confirms that p-cresol was indeed the metabolite of PHE. The relationship between PHE degradation, production and reduction of p-cresol are shown in Fig. 4-8.
Fig. 4-8 Degradation of phenanthrene and variation of p-cresol in Run-1. Phenanthrene degradation (●); measurement (○) and theoretical production (◇) of p-cresol. The presented data are mean values of duplicate incubations.
4.5.2 The Degradation of p-Cresol
In Run-9, no PHE was added along with p-cresol. The degradation profile of p-cresol in this system is shown in Fig. 4-9. It had shown a slow degradation rate within 3 days and degraded rapidly in subsequent days. At the end of 30 days, p-cresol concentration decreased from 11.6 to 3.4 mg/L, which corresponding to a p-cresol removal of 71%. In comparison with our previous study by Tsai et al. (2009), there were two experiment runs of p-cresol degradation. The p-cresol concentration in these two runs were 5 and 10 mg/L. The p-cresol removal percentages were 88% and 65%
0 4 8 12 16 20 0 5 10 15 20 25 30 Co n cen tr at io n , mg /L Time (d)
in the end of 21 days. However, the degradation rate observed in this study is similar to Tsai et al. (2009).
Fig. 4-9 Degradation of p-cresol without phenanthrene. The concentration of degradation, mg/L (●); the percentage of degradation, % (○). The presented data are mean values of duplicate incubations.
In this study, p-cresol is degraded by SRB but it is also produced continually due to the degradation of PHE. To estimate the actual consumption of p-cresol degradation, the theoretical quantity of p-cresol production from PHE degradation has to be deducted from the actual observed p-cresol concentration in each experiment run. Therefore, △p was used to represent the actual consumption of p-cresol degradation.
0 20 40 60 80 100 0 3 6 9 12 15 0 5 10 15 20 25 30 D egr ad at io n , % C o n ce n tra ti o n , m g/L Time (d)
The actual variation and the theoretical quantity of p-cresol produced in each run are shown in Fig. 4-10. In addition, the quantity of p-cresol degradation is listed in Table 4-2.
0 2 4 6 8 0 5 10 15 20 25 30 C o n ce n tra ti o n , m g/L Time (d) 0 2 4 6 8 10 0 5 10 15 20 25 30 C o n ce n tra ti o n , m g/L Time (d) 0 3 6 9 12 0 5 10 15 20 25 30 C o n ce n tra ti o n , m g/L Time (d) 0 3 6 9 12 15 0 5 10 15 20 25 30 C o n ce n tra ti o n , m g/L Time (d) 0 4 8 12 16 0 5 10 15 20 25 30 C o n ce n tra ti o n , m g/L Time (d) (a) (b) (c) (d) (e)
Fig.4-10 The actual variation and the theoretical quantity of p-cresol production. The experiment run for each one was (a) 1-1, (b) 2-1, (c) 2-2, (d) 2-3, (e) 2-4, (f) 3-1, (g) 3-2, (h) 3-3 and (i) 1-2, respectively. The theoretical quantity of p-cresol production added the initial concentration (●); the actual variation of p-cresol (○) in each experiment run. The presented data are mean values of duplicate incubations. 0 2 4 6 8 0 5 10 15 20 25 30 C o n ce n tra ti o n , m g/L Time (d) 0 3 6 9 0 5 10 15 20 25 30 C o n ce n tra ti o n , m g/L Time (d) 0 3 6 9 12 0 5 10 15 20 25 30 C o n ce n tra ti o n , m g/L Time (d) 0 3 6 9 12 15 0 5 10 15 20 25 30 C o n ce n tra ti o n , m g/L Time (d) (f) (g) (h) (i)
Table 4-2 Quantity of p-Cresol Degradation Experiment Run Initial Concentration (mg/L) Theoretical Productiona (mg/L) Actual Concentrationb (mg/L) △p 1 0 6.2 0.4 5.8 2 2.8 8.6 2.9 5.7 3 5.6 10.9 4.9 6 4 8.3 13 6.3 6.7 5 11.1 14.9 7.1 7.8 6 2.8 6.7 2.5 4.2 7 5.6 7.9 4.4 3.5 8 8.3 9.7 5.7 4 9 11.1 11.6 3.4 8.2
Where a : The sum of initial concentration and the theoretical produced concentration. b : The actual concentration observed in the end of experiment period.
4.6 Kinetics under Different Phenanthrene and p-Cresol Concentrations
The extent of PHE and p-cresol degradation can be determined by calculating the degradation rate constant. In this study, the PHE and p-cresol degradation rate in Run-1 and Run-9 were evaluated using zero-order and first-order kinetics. The zero-order PHE and p-cresol degradation rate constants were 0.34 mg/L-d (R2 of 0.9) and 0.3 mg/L-d (R2 of 0.88), and the first-order PHE and p-cresol degradation rates were 0.03/d (R2 of 0.94) and 0.045/d (R2 of 0.95), respectively, as shown in Fig. 4-11. The first-order model provided a slightly superior fit to the PHE and p-cresol degradation data than the zero-order model. However, Chang et al. (2002) reported that the degradation rate of PAHs was found to fit well with the first-order kinetics.
Fig.4-11 Kinetics of phenanthrene and p-cresol biodegradation. (a) zero-order and (b) first-order kinetics in Run-1; (c) zero-order and (d) first-order kinetics in Run-9. The presented data are mean values of duplicate incubations.
y = -0.3436x + 16.106 R² = 0.9028 0 4 8 12 16 20 0 5 10 15 20 25 30 C o n ce n tra ti o n , m g/L Time (d) y = -0.03x + 2.8023 R² = 0.9405 0.0 1.0 2.0 3.0 0 5 10 15 20 25 30 ln C Time (d) y = -0.2956x + 10.719 R² = 0.8835 0 3 6 9 12 15 0 5 10 15 20 25 30 C o n ce n tra ti o n , m g/L Time (d) y = -0.0453x + 2.4216 R² = 0.947 0.0 1.0 2.0 3.0 0 5 10 15 20 25 30 ln C Time (d) (a) (b) (c) (d)
The calculated zero-order (k0) and first-order (k1) PHE biodegradation rates in Part-1
and Part-2 are shown in Table 4-3. The results indicate that k0 and k1 values are
decreasing with the increasing concentration of p-cresol in Part-1. The highest k0
(0.34 mg/L.d) and k1 (0.03/d) values were observed in Run-1 (degradation of PHE
without p-cresol); whereas, the lowest k0 (0.23 mg/L.d) and k1 (0.016/d) values were
observed in Run-5. The reason for the decrease in k0 and k1 values can be attributed to
the decrease in PHE concentration and the simultaneous increase in p-cresol concentration in Part-2.
Table 4-3 Rates of phenanthrene biodegradation in the inhibition study
Parameter
Part I & II Part I Part II
Run-1 Run-2 Run-3 Run-4 Run-5 Run-6 Run-7 Run-8
k0 0.35 0.34 0.32 0.27 0.23 0.23 0.15 0.1
k1 0.03 0.028 0.026 0.02 0.016 0.026 0.029 0.041
Where k0 : The k value of zero-order kinetic (mg/L.d)
4.7 The effect on p-cresol to phenanthrene degradation
In Part-1, PHE was significantly inhibited due to the increase in addition of p-cresol, and at the same time, more quantity of p-cresol was degraded. In Fig. 4-12, the first-order kinetic k value was decreased from 0.03 to 0.016/d with the increase in
p-cresol concentration. Nevertheless, △OD660 was increased with the decrease in PHE
degradation; the reason for the increase in △OD660 might be due to the increase in
p-cresol degradation with the increase in addition of p-cresol. Similarly, the △p (the
theoretical concentration of p-cresol production minus the actual p-cresol concentration observed in the end of experiment period) has good correlation with △ OD660. These results illustrate that p-cresol was more suitable for SRB biodegradation
than PHE. This could be due to the lesser toxicity and molecular weight of p-cresol compared to PHE.
Fig.4-12 The correlation between phenanthrene/p-cresol consumption and SRB biomass.
Chapter 5
Conclusions
1. p-Cresol is inevitably the metabolite of PHE, which is clear from Run-1. This confirms the experimental observation of the previous study.
2. The addition of p-cresol has considerable reduction in the degradation of PHE. However, the degradation of p-cresol was increased with the increase in the addition of p-cresol concentration. This could be due to the lesser toxicity and molecular weight of p-cresol compared to PHE.
3. As a whole, this investigation indicates that the presence of simpler metabolite of PHE, i.e. p-cresol, is also a preferred substrate for the SRB used in this study. However, the presence of p-cresol has the tendency to be utilized as a much more preferred substrate than PHE.
References
• Acuña A.M.E., Olguin L.P., Razo F.E. (2003) Toxicity and kinetic parameters of the aerobic biodegradation of the phenol and alkylphenols by a mixed culture.
Biotechnology Letters 25, pp. 559-564.
• Baskaran V., Nemati M. (2006) Anaerobic reduction of sulfate in immobilized cell bioreactors, using a microbial culture originated from an oil reservoir. Biochemical
Engineering Journal 31, pp. 148-159.
• Bamforth S.M., Singleton I. (2005) Review bioremediation of polycyclic aromatic hydrocarbons: current knowledge and future directions. Journal of Chemical
Technology and Biotechnology, pp. 723–736.
• Bedessem M.E., Swoboda-Colberg N.G., Colberg P.J. (1997) Naphthalene mineralization coupled to sulfate reduction in aquifer-derived enrichment. FEMS
Microbiology Letter 152, pp. 213-218.
• Bossert I.D., Rivera M.D., Young L.Y. (1986) p-Cresol biodegradation under denitrifying conditions: isolation of a bacterial coculture. FEMS Microbiology
Ecology 38, pp. 313-319.
• Bossert I.D., Young L.Y. (1986) Anaerobic oxidation of p-cresol by a denitrifying bacterium. Applied and Environmental Microbiology, pp. 1117-1122.
• Boyd S.A., Shelton D.R., Berry D., Tiedje J.M. (1983) Anaerobic biodegradation of phenolic compounds in digested sludge. Applied and Environmental
Microbiology 46, pp. 50-54.
• Chakraborty R., Coates J.D. (2004) Anaerobic degradation of monoaromatic hydrocarbons. Applied Microbiology and Biotechnology 64, pp. 437-446.
• Chang B.V., Shiung L.C., Yuan S.Y. (2002) Anaerobic biodegradation of polycyclic aromatic hydrocarbon in soil. Chemosphere 48, pp. 717–724.
• Coates J.D., Anderson R.T., Lovley D.R. (1996) Oxidation of polycyclic aromatic hydrocarbons under sulfate-reducing conditions. Applied and Environmental
Microbiology, pp. 1099–1101.
• Coates J.D., Woodward J., Allen J., Philp P., Lovley D.R. (1997) Anaerobic degradation of polycyclic aromatic hydrocarbons and alkanes in petroleum-contaminated marine harbor sediments. Applied and Environmental
Microbiology, pp. 3589–3593.
• Ehrlich G.G., Goerlitz D.F., Godsy E.M., Hult M.F. (1982) Degradation of phenolic contaminants in ground water by anaerobic bacteria: St. Louis Park, Minnesota. Ground Water 20, pp. 703-710.
• Feio M.J., Beech I.B., Carepo M., Lopes J.M., Cheung C.W.S., Franco R., Guezennec J., Smith J.R., Mitchell J.I., Moura J.J.G., Lino A.R. (1998) Isolation and characterization of a novel sulphate-reducing bacterium of the desulfovibrio genus. Anaerobe 4, pp. 117-130.
• Haggblom M.M., Rivera M.D., Bossert I.D., Rogers J.E., Young L.Y. (1990) Anaerobic biodegradation of para-cresol under three reducing conditions.
Microbiology Ecology 20, pp. 141-150.
• Hajji K.T., Lépine F., Bisaillon J.G., Beaudet R. (1999) Simultaneous removal of phenol, ortho- and para-cresol by mixed anaerobic consortia. Canadian Journal of
Microbiology 45, pp. 318–325.
• Holliger C., Zehnder A.J. (1996) Anaerobic biodegradation of hydrocarbons.
Current Opinion in Biotechnology 7, pp. 326-330.
• Karthikeyan R., Bhandari A. (2001) Anaerobic biotransformation of aromatic and polycyclic aromatic hydrocarbons in soil microcosms: a review. Journal of
Hazardous Substance Research 3, pp. 1-18.
• Khorasani M.T., Balchshandeh G.R. (1992) Preparation and activity of sterically hindered phenol antioxidants for NR and SBR. Iranian Journal of Polymer
• Kleikemper J., Pelz O., Schroth M.H., Zeyer J. (2002) Sulfate-reducing bacterial community response to carbon source amendment in contaminated aquifer microcosms. FEMS Microbiology Ecology 42, pp. 109-118.
• Londry K.L., Fedorak P.M., Suflita J.M. (1997) Anaerobic degradation of m-cresol by a sulfate-reducing bacterium. Applied and Environmental Microbiology, pp. 3170–3175.
• Londry K.L., Suflita J.M., Tanner R.S. (1999) Cresol metabolism by the sulfate-reducing bacterium desulfotomaculum sp. strain Groll. Canadian Journal
of Microbiology45, pp. 458–463.
• Lovley D.R., Lonergan D.J. (1990) Anaerobic oxidation of toluene, phenol and
p-cresol by the dissimilatory iron-reducing organism, GS-l5. Applied and
Environmental Microbiology. 56, pp. 1858-1864.
• Meckenstock R.U., Annweiler E., Michaelis W., Richnow H.H., Schink B. (2000) Anaerobic naphthalene degradation by a sulfate-reducing enrichment culture.
Applied and Environmental Microbiology, pp. 2743–2747.
• Mort S.L., Ross D.D. (1994) Biodegradation of phenolic compounds by sulfate-reducing bacteria from contaminated sediments. Microbiology Ecology 28, pp. 67-77.
• Müller J.A., Galushko A.S., Kappler A., Schink B. (1999) Anaerobic degradation of m-cresol by desulfobacterium cetonicum is initiated by formation of 3-hydroxybenzylsuccinate. Archives of Microbiology 172, pp. 287–294.
• Müller J.A., Galushko A.S., Kappler A., Schink B. (2001) Initiation of anaerobic degradation of p-Cresol by formation of 4-hydroxybenzylsuccinate in desulfobacterium cetonicum, Journal of Bacteriology 183, pp. 752–757.
• Rabus R., Heider J. (1998) Initial reactions of anaerobic metabolism of alkylbenzenes in denitrifying and sulfate-reducing bacteria. Arch. Microbiology 170, pp. 377–384.
• Ramanand K., Suflita J.M. (1991) Anaerobic degradation of m-cresol in anoxic aquifer slurries: carboxylation reactions in a sulfate-reducing bacterial enrichment.
Applied and Environmental Microbiology, pp. 1689-1695.
• Shen C.F., Hawari J.A., Ampleman G., Thiboutot S., Guiot S.R. (2000) Origin of
p-cresol in the anaerobic degradation of trinitrotoluene. Canadian Journal of
Microbiology 46, pp. 119-124.
• Shibata A., Inoue Y., Katayama A. (2006) Aerobic and anaerobic biodegradation of phenol derivatives in various paddy soils. Science of the Total Environment 367, pp. 979-987.
• Smolenskit W.J., Suflita J.M. (1986) Biodegradation of cresol isomers in anoxic aquifers. Applied and Environmental Microbiology, pp. 710-716.
• Suflita J.M., Liang L.N., Saxena A. (1989) The anaerobic biodegradation of o-, m- and p-cresol by sulfate-reducing bacterial enrichment cultures obtained from a shallow anoxic aquifer. Journal of Industrial Microbiology 4, pp. 255-266.
• Tsai J.C., Kumar M., Lin J.G. (2009) Anaerobic biotransformation of fluorene and phenanthrene by sulfate-reducing bacteria and identification of biotransformation pathway. Journal of Hazardous Materials 164, pp. 847-855.
• Yadav K.K., Iyengar L., Birkeland N.K., Ramanathan G. (2005) Transient accumulation of metabolic intermediates of p-cresol in the culture medium by a pseudomonas sp. strain A isolated from a sewage treatment plant. World Journal of