A Cost-effective Ultra-Reliable Fault-tolerant Switching Software Architecture for Next Generation Networks
7
0
0
全文
(2) Software and hardware outages differ drastically in nature. Before extrapolating proven hardware redundancy results to construct the aforementioned two sets of software redundancy Markov models, it is essential to understand the distinctions between hardware and software faults, failures, outages and recovery from switching system perspective. Hardware outages are mostly caused by hardware faults, due to device aging and deterioration. The nature of hardware faults is such that faulty devices cease functioning the way they were designed to perform. Stuck-at faults and bridge faults are good examples. Hardware faults can be repaired by replacing faulty devices with good ones. When a repair is done, the system becomes free of hardware faults and the process repeats. Device aging is very well understood. It can be described by a 'bath-tub' curve. After an adequate burn-in, the probability of developing a failure is constant over time. Namely, it is a random process. It should be pointed out, however, that the presence of a hardware fault does not necessarily bring the system down. To bring down the system, the following conditions must be met: The hardware fault must be activated and induce errors. C2 The induced errors are so severe that the system can not continue to perform its primary functions (e.g. call processing for softswitches).. Attr. 3 Software faults are loaded into the system due to inadequate system testing, design and/or programming mistakes or specification/requirement deficiencies. Attr. 4 Some software faults are severe; and, some are not. Severe faults will cause system outages under certain conditions. They do not always bring down the system. Furthermore, we can not assume that the presence of a severe software fault will bring down the system as we do in dealing with critical hardware faults. The reason is that if we do so, the system would have been down permanently. Attr. 5 Software faults, design or programming bugs, are removed when they are discovered. Thus, they live in the system long enough to induce some errors. However, new software faults may be injected into the system while old ones are being removed. Attr. 6 Adding new software to introduce new features will most likely induce new software faults. Most software outages can be recovered automatically by some sequence of software recovery actions to remove the conditions which cause the system to go down. Normally, this can be achieved within several minutes.. C1. The first condition C1 is traffic dependent. In other word, a fault may not cause any system outages during light traffic hours. To simplify hardware reliability modeling and analyses, it is a common practice to assume that as soon as a critical fault occurs, it will be activated and induce severe and critical errors that will bring down the system in question. This approximation approach is consistent with worst-case engineering practice. Software outages, on the other hand, are due to software faults which are either design errors, specification deficiencies or programming bugs. Software faults can be characterized by the following attributes: Attr. 1 A certain number of software faults are loaded into the system since the system is put into service. There would be no software outages if they were not installed/loaded into the system. Namely, there is no software fault-free state for most new systems. Attr. 2 Once a switching system reaches software fault-free state, it will no longer cause any software outages.. Most switching systems are well tested before being placed into services. Therefore, most switching software faults function properly under normal conditions. For instance, software faults inside infrequently exercised code segments handling abnormal conditions such as fault recovery or overload. They induce errors that lead to system failures only under certain abnormal conditions. If not detected and treated immediately, these errors could propagate and induce new software faults and eventually become so severe that the system cannot continue to function and lead to system outages. A famous example is a bug in a C switch statement in AT&T’s 4ESS® Switch that caused nine hours of telephone network outage in 1990 [11]. With judicious fault tolerant designs, these errors can often be recovered/reconciled and contained without further causing noticeable system outages. Thus, under certain rare conditions severe software faults will induce errors which in turn will induce failures so severe that the system has to go down. Most likely, these conditions are unique for each severe software fault. Once identified, severe software faults will very likely be permanently removed from the system. From that point on, the system will function properly even if identical rare conditions occur again. Consequently, the rate of occurrences of these severe errors is not as easily predictable as hardware faults. It, however, can be measured and observed over time. Nevertheless, it is a random process just the same as. - 739 -.
(3) incoming traffic. Thus, software outages can be modeled by a constant software failure rates.. 3: SIMPLEX FAULT-TOLERANT SOFTWARE ARCHITECTURE AND SOFTWARE FAILURE RECOVERY To repair hardware faults, a repair person must be physically present. However, a switching system can automatically recover from most software failures without manual intervention. To meet the LATA Switching Systems Generic Requirements (LSSGR), or equivalent, stringent downtime requirements, a switching system must automatically recover itself from most, if not all, software failures. This software self-recovery can often be implemented in the form of multi-level recovery with abilities to automatically escalate to the next higher levels. However, this ability can only be achieved with appropriate run-time software fault recovery architecture. A proven architecture is multi-level software failure recovery which has been implemented in Lucent’s 5ESS® Switch [12] and Reliable Cluster Computing [13] product lines.. Note that Ai+1 is a more severe recovery action than Ai for all i Figure 1 Switching Software recovery In general, a multi-level recovery begins with error counting and masking. If the encountered software fault induces an error rate exceeding a pre-determined threshold, the system will attempt to recover from the failure by performing a higher level and more drastic recovery action. In the 5ESS® Switch, a software recovery starts from Return To the points of Interrupts (RTIs). The second level recovery is called a Single Process Purge (SPP). Each SPP is expected to affect only one phone call. RTIs and SPPs do not cause system outages. If SPPs still fail to recover from the failure, a next higher level and more drastic recovery action called selective initialization is taken. In this manner, a multi-level recovery progressively escalates itself from graceful to drastic in term of its impact, a measure of degradation to system’s call processing ability, to end-users. A drastic impact means a loss of a large number of transient (in-progress) and/or stable (in talking state) calls for a sufficiently long duration; and, the system may be totally or partially down during this period. Figure 1 shows a switching software recovery schema. as outlined above. It should be pointed out that the initial actions of a software recovery, such as RTIs and SPPs, may not cause outages and, thus, may not be the beginning of a software failure. Software failure rate should be assessed accordingly. As reported by the author [1], a very common component of modern microprocessor called memory management unit can also be used to further improve software fault tolerance of a simplex processor.. 4: IMPROVING SOFTWARE RELIABILITY WITH ACTIVE-STANDBY PAIR The software architecture we shall consider is described below. There are two copies of one software system running on two loosely coupled processors – one is called the active processor and the other standby, referred to as the Active-Standby (AS) pair. The basic recovery strategy is that, upon the presence of a software failure, as long as the active processor is able to gracefully recover without adverse effects to end users (causing long system outages), let it remain as the active; otherwise, switch to the standby. In other words, we let the active take minor and graceful recovery actions such as error counting and single process purges, which affect only a small number of calls. Suppose after performing several single process purges the active is still in trouble, we then invoke a switchover to the standby so that the old standby becomes the new active and the old active becomes the standby. The new active immediately processes new calls while the new standby continues to recover itself from the pending failure. In this way, more drastic software recovery actions are performed in the standby; and thus, the effects of drastic software recovery actions are hidden or shielded from the end customers. This makes the system more robust and fault-tolerant; and, as a result, the system reliability should improve. In most cases, each copy is able to automatically recover from detectable software failures. If a failure is neither detectable nor automatically recoverable, the failing processor will require either assistance from the mate processor or human interventions to restore it into normal operation. Human interventions prolong recovery time. Thus, a reliable switching software system engineering should eliminate human interventions as much as possible. We shall construct two sets of Markov models to demonstrate the benefits of a loosely coupled active-standby software architecture. For the first set, we shall assume a perfect coverage. Then we will. - 740 -.
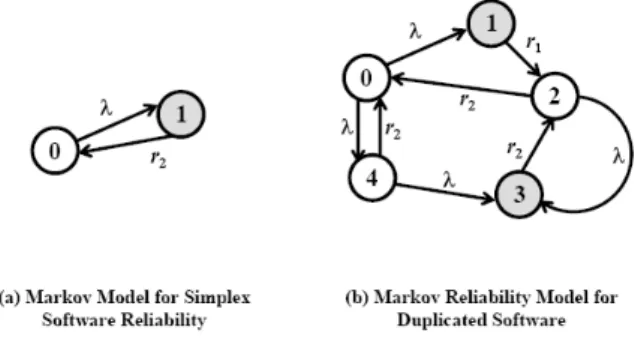
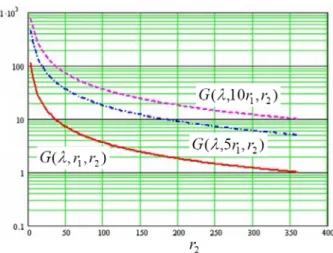
(4) remove the assumption and consider a more general model with imperfect coverage. A perfect coverage means all software failures are detectable and recoverable.. 5: MARKOV MODELS ACTIVE-STANDBY PAIR PERFECT COVERAGE. FOR WITH. Let’s consider a software system consisting of two identical copies of software. Figure 2 presents two Markov models for comparing software reliability with and without Active-Standby pair software redundancy. We shall make the following assumptions: As.1. The failure processes of these two software copies are mutually independent with identical constant failure rates. As.2 Each copy is able to automatically recover from all software failures. Namely, every failure is induced by detectable errors and every failure is recoverable Figure 2-(a) depicts a Markov reliability model for a simplex software system. It is a two-state model. State 0 denotes the normal condition while State 1 represents the condition that the software develops a failure. The software failure rate is denoted by λ. The recovery rate is denoted by r2. Thus, State 1 denotes the condition that system is unavailable. Let pi denotes the probability that the system is in State i, for i=0,1. Also, let y be the probability that the software fails. We have,. y (λ , r2 ) = p1 =. 2) State 1: Active copy develops a failure and initiates a switchover to the standby copy with a rate of r1 including failure detection. 3) State 2: Standby becomes the Active and the recovery in the failing copy is in progress. 4) State 3: Both copies are failing. This represents the condition that the system is unavailable. 5) State 4: Standby copy develops a failure and initiates a recovery.. λ λ + r2. Again, let Pi denotes the probability that the system is in State i, for i=0, 1,…, 4. To determine these P’s, one can apply the “rates in equal rates out” property of a Markov chain to obtain a set of five simultaneous equations, one for each state. After some manipulations, the following set of equations can readily be obtained: λ λ p1 = λ r1 p 0 ; p 2 = r2 [1 + r2 ] p 0 ; p3 = rλ 2 [2 + rλ ] p 0 ; p 4 = λ p 0 2 r2 + λ 2 2. x(λ , r1 , r2 ) = p1 + p 3 (λ / r1 )+2(λ +r2 )2 = 1+(λ / r1 )+2(λ / r2 )+ 2(λ / r2 )2 The notation a >> b indicates that a is many orders of magnitude larger than b. Thus, a+b can be approximated by a. Namely, a+b ≅ a Thus, the probability of software system unavailability, denoted by x, is the probability that the software is in State 1 or State 3. Namely, x = P1+ P3. Let’s define a software redundancy gain function, G, as. Figure 2(b) depicts a Markov reliability model for a system with the AS pair software redundancy. It is a five-state model. State 0 denotes the normal condition while States 1~4 represent the condition that the software develops some failures. The software failure rate is denoted by λ. The switchover and recovery rates are denoted by r1 and r2, respectively. G (λ , r1 , r2 ) = y (λ , r2 ) / x(λ , r1 , r2 ) λ{1+(λ / r1 )+ 2(λ / r2 )+ 2(λ / r2 )2} = (λ + r1 )[(λ / r1 ) + 2(λ + r2 ) 2 ] follows: To illustrate the usefulness of this gain function, let us consider the following example. Example 1. Figure 2 Markov Models for Perfect Coverage. Supposed it is desired to determine the gain for using the AS pair to improve software unavailability. Let’s assume the failure rate is one failure per four months and switchover times from the failing active to the standby of 1, 2 and 10 seconds are to be evaluated. Three plots of the gain as a function of recovery rate, r2, are shown on Figure 3. The x-axis shows the recovery rate in terms of number of recoveries per hour. Thus, x = 100 is equivalent to a recovery time of 36 seconds. All three plots start from a recovery time of 20 minutes. These five states represent the following conditions. 1) State 0: normal condition.. - 741 -.
(5) automatically recover by itself. Reasons for the imperfections are: (a) imperfect failure detections - in either the active or the standby software copies and in the simplex case as well, or (b) unsuccessful automatic fault recovery in either copy. Thus, software failures in this class require either assistance from the mate processor or human interventions (i.e. manual restorations/repairs) to recover with a rate denoted by γ3 and R, respectively. Detectable and recoverable software failures are recovered automatically with a rate of γ2 for both simplex and duplicated software. Finally, the switchover rate is noted by γ1. Figure 3 Software Redundancy Gain with Perfect Coverage The bottom curve of Figure 3 corresponds to 10-second switchover time; the middle one is 2 seconds; and, the top one is one second. A study of these three plots reveals that 1) The shorter the switchover time, the higher the gain is. 2) The faster the recovery speed in each copy, the lower the gain is. 3) A gain of 100X can be achieved if the recovery takes an average of 20 minutes and a switchover time of 10 seconds. Namely, by using a duplicated software, a software availability of about 60.8 minutes per year, or 0.999842 (almost four 9’s), can be improved to better than 0.61 minute per year, or 0.99999842 (near six 9’s). 4) There is no gain, if the recovery speed equals the switchover speed.. 6: MARKOV MODELS FOR DUPLICATED SOFTWARE WITH IMPERFECT FAILURE RECOVERY We shall now consider a more general situation by allowing imperfect failure recovery with distinct failure rates, λ and λ2, and coverage factors, c and c2, for the active and the standby copies respectively. A coverage factor is defined here as the fraction of software failures in the processor in question that can. In Figure 4-a), the probability of the simplex software unavailability, denoted by y2, is the probability that the software is in State 1 or State 2. Namely, y2 = p1+ p2. (1). y 2 (λ , c, r2 , R) =. For Figure 4-b), the probability of the software unavailability being analyzed, denoted by x2, is the probability that the software is in States 1, 3, 4, 6, 8, 9 or 10. Namely, x2 = P1+ P3+P4+ P6+ P8+ P9+ P10. To determine these P’s, at each state, one can apply the “rates in equal rates out” property of a Markov chain to obtain a set of 12 equations. After some manipulations, the following set of equations can readily be obtained:. cλ p1 = crλ p0 ; p2 = p; r2 +(1−c)λ 0 1 λ (1 − c) (cλ )2 p3 = p ;p = p0 r2{r2 +(1−c)λ} 0 4 r3 c2λ2 cλc2λ2 p5 = p ;p = p; r2 +(1−c )λ 0 6 r2[r2 +(1−c )λ ] 0 1. p7 =. λ (1−c)+r3. λ (1−c)c2λ2 }; r2 +(1−c )λ. λ (1−c)c2λ2 p8 = r1 p0 { r2 +(1−c2 )λ2 2 λ (1−c)c2λ2 cλ + [(1 − c 2 )λ2 + (1 − c)λ + ]} r2 +(1−c )λ λ (1−c)+r3 λ (1 − c) p7 p9 = R λ (1 − c ) p 0 λ (1−c)c2λ2 = {(1 − c 2 )λ 2 + (1 − c )λ + } r2 +(1−c )λ R[λ (1−c )+ r3 ]. 10. Imperfect Coverage Markov Models. p0 {(1 − c2 )λ2 + (1 − c)λ +. p 10 =. Figure 4. (cλ / r2 ) + (1 − c)λ / R 1+(cλ / r2 )+(1−c)λ / R. ∑p i =0. - 742 -. i. λ (1 − c ) c 2 λ 2 p r 2 [ r 2 + (1 − c 2 ) λ 2 ] 0. =1.
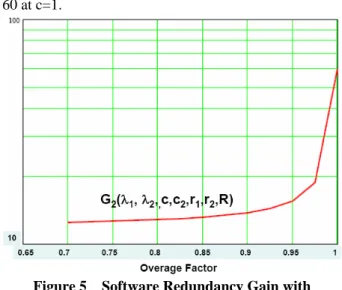
(6) = p0 {1 + crλ + 1. ( cλ ) 2 cλ + + ... r2 +(1−c )λ r2{r2 + (1−c )λ}. +. b) λ=λ2=1/(24*120), a failure rate of one failure per 120 days, about four months; c) R=0.25, mean manual repair time of 4 hours for software failures; d) r1=3600, mean switchover time of 1 second; e) r2=12, mean auto software failure recovery time of 5 minutes; and, f) r3=3, mean software failure recovery time of 20 minutes with assistance from the mate processor. If the failing processor is the active, a switchover of the standby to the active will occur. λ (1−c)c2λ2 } r2[r2 +(1−c2 )λ2 ]. For switching applications, the following relations apply:. ri >> λ ; ri >> λ2 ; R >> λ ; R >> λ2 ; ∀i. Thus, we obtain the following for x2 (λ , λ2 , c, c2 , r1 , r2 , R ) ,. approximation. This G2 plot reveals that the gain is a monotonic x2 (λ , λ2 , c, c2 , r1 , r2 , R) = P1 + P 3 + P 4 + P 6 + P8 + P 9 + P10 increasing function of c starting at around 12.5, more λ (1 − c) cλc2λ2 1 λ (1−c)c2λ2 cλ ≅ p0 { crλ + + + r2 +r { than one order of magnitude, at c=0.7 and ending near r r2 +(1−c)λ 2 2 1 r1 2 60 at c=1.. λ (1−c)c2λ2 + crλ [(1 − c2 )λ2 + (1 − c)λ + ]} r2 3. +. λ (1 − c) r3 R. {(1 − c2 )λ2 + (1 − c)λ +. λ (1−c)c2λ2 r2. }+. λ (1−c)c2λ2 r22. }. (2). where, 1 ≅ {1 + cλ + cλ + (cλ )2 + λ (1 − c) + c2λ2 + cλc2λ2 r1 r2 r2 r2 2 r2 2 p r1 0. λ (1−c)c2λ2 + r1 [(1 − c2 )λ2 + (1 − c)λ + ] r 3. 2. λ (1−c)c2λ2 cλ λ (1−c)c2λ2 + r1 { + r [(1 − c2 )λ2 + (1 − c)λ + ]} r2 r2 2 3 λ (1−c)c2λ2 λ (1−c)c2λ2 λ (1 − c) [(1 − c2 )λ2 + (1 − c)λ + ]+ + r2 r22 r3R. Figure 5. 7: BENEFITS OF AS PAIR SOFTWARE REDUNDANCY WITH IMPERFECT COVERAGE To study the potential benefits of utilizing AS pair software redundancy with imperfect coverage, we shall consider the following gain function: y (λ , c, r , R ) 2 2 G 2 (λ , λ 2 , c, c 2 , r1 , r2 , R) = x 2 (λ , λ 2 , c, c 2 , r1 , r2 , R ) By substituting Equations (1), (2) into G2 , we can readily obtain expressions for G2 (λ , λ2 , c, c2 , r1 , r2 , R). Example 2 To illustrate how this gain function can be utilized to optimize fault tolerance, a plot of G2 as a function of coverage factor c is given in Figure 5. These two curves were obtained by setting the remaining parameters as below: a). c2=0.95;. Software Redundancy Gain with Imperfect Coverage. Also, two plots of software unavailability for a simplex system and an AS pair software redundancy with imperfect coverage are given in Figure 6. This figure clearly demonstrates that an AS pair loosely coupled software architecture can transform a simplex software system worse than five 9’s into a better than six 9’s software system.. 8: SUMMARY AND DISCUSSIONS By extrapolating proven results with hardware redundancy, this paper has shown that judicious applications of software redundancy can drastically and cost-effectively improve software availability of a loosely coupled switching system with active-standby pair software redundancy. It is also important to point out that a large portion of procedural errors cause only software failures. Thus, effective use of software redundancy can, as a by-product, further improve system reliability by avoiding total system outages caused by some otherwise severe procedural errors. In. - 743 -. summary,. Next. Generation. Network. (NGN).
(7) applications such as voice and data convergence, voice over packets and emerging new 3G mobile and WiFi/WiMax Wireless and other innovative services demand fast time to market. To succeed in the global market, switching software architectures must be able to quickly absorb new technologies and respond to new market needs. This presents a new challenge to switching software architects because a switching platform must also be able to meet very stringent reliability requirements. Based on Markov modeling and reliability analysis, this paper has demonstrated that judicious applications of physical software redundancy can cost-effectively transform a simplex software system worse than five 9’s into a better than six 9’s system and thus establishes a cost-effective ultra-reliable software architectural framework for NGN switching platform while meeting the needs of fast-time-to-market.. REFERENCES [1]. [2]. [3] [4]. [5]. [6]. [7]. [8]. [9] [10]. [11]. [12]. [13]. Shih-Jeh Chang and Prudence T. Zacarias Kapauan, “Modeling and Analysis of Using Memory Management Unit to Improve Software Reliability”, 12th International Symposium on Software Reliability Engineering (ISSRE 2001), 96-102 E.F. Moore and C.E. Shannon(1956),"Reliable circuits using less reliable relays", Journal of the Franklin Institute, 262, 191- 208, 281-97 J.H. Lala, et al, ”A Design Approach for Ultrareliable Real-time Systems”, IEEE Computer, May, 1991. Musa, Lannino and Okumoto,”Software Reliability: Measurement, Prediction, Application”, McGraw-Hill, 1987. [14] [15]. [16]. Figure 6 Software Unavailability Comparison: Simplex vs. AS Pair Software Redundancy with Imperfect Coverage. - 744 -. A. Avizienis, "The N-Version Approach to Fault-Tolerant Software," IEEE Transactions on Software Engineering SE-11(12) (Dec. 1985) pp. 1491-1501. Michael R. Lyu, Algirdas Avizienis,”Assuring Design Diversity in N-Version Software: A Design Paradigm for N-Version Programming” Proceedings 2nd International Working Conference on Dependable Computing for Critical Applications, Tucson, Arizona A. Avizienis, “TheN-version approach to fault-tolerant software,” IEEE Trans. on Software Engineering, Vol. SE-1 1, No. 12, pp. 1491-1501,Dec. 1985. B. Randell, “System structure for software fault tolerance,” IEEE Trans. on Software Engineering, Vol. SE-1, No. 2, pp. 220-232, June 1975. J. Gray and D. P. Siewiorek, “High-availability computer systems,” IEEE Computer Magazine, pp. 3 9 4 8 , Sept. 1991. P. E. Ammann and J. C. Knight, “Data diversity: An approach to software fault-tolerance,’’ in Proc. IEEE Fault-Tolerant Computing Symposium, pp. 122-126, 1987. M.N.Meyers, “The AT&T telephone network outage of January 15, 1990.” Invited Talk at IEEE Fault-Tolerant Computing Symposium, 1990. F.H. Keeve, et al, “5ESSTM Switching System Software: Software Fault Detection and Recovery”, AT&T Technical Journal, January, 1986, p. 153~165 Michael R. Lyu and Veena B. Mendiratta, “Software Fault Tolerance in a Clustered Architecture: Techniques and Reliability Modeling”, Aerospace Conference, 1999. Proceedings. 1999 IEEE, 30 Oct.-2 Nov. 1996 Page(s):99 – 103 LSSGR, Bellcore, TRTSY -000064, FSD 00-00-0100, July 1989 Reliability and Quality Measurements for Telecommunications Systems (RQMS-Wireline), Telcordia Technologies Generic Requirements GR–929–CORE Issue 6, December 2000 M.L. Shooman,” Reliability of Computer Systems and Networks-Fault Tolerance, Analysis and Design”, John Wiley & Sons, Inc.., 2002 ISBN 0-471-29342-3.
(8)
數據

+2

相關文件
n How to build redundancy and diversity into a VoIP network without losing sight of the trade-off between network quality and network cost (network dimensioning, traffic
Rather than requiring a physical press of the reset button before an upload, the Arduino Uno is designed in a way that allows it to be reset by software running on a
In this paper, we build a new class of neural networks based on the smoothing method for NCP introduced by Haddou and Maheux [18] using some family F of smoothing functions.
Overview of a variety of business software, graphics and multimedia software, and home/personal/educational software Web applications and application software for
“More Joel on Software : Further Thoughts on Diverse and Occasionally Related Matters That Will Prove of Interest to Software Developers, Designers, and Managers, and to Those
• Nokia has been using Socialtext wiki software for a year and a half to facilitate information exchange within its Insight &
“More Joel on Software : Further Thoughts on Diverse and Occasionally Related Matters That Will Prove of Interest to Software Developers, Designers, and Managers, and to Those
This part shows how selling price and variable cost changes affect the unit contribution, break-even point, profit, rate of return and margin of safety?. This is the
