國立交通大學
電子物理學系
碩士學位論文
第二型能帶結構硒化錳鋅/碲硒化鋅
多重量子井之光學特性研究
Optical characteristics of type-II
Zn
0.97Mn
0.03Se/ZnSe
1-xTe
xmultiple quantum wells
研究生:邱鏡學
指導教授:周武清 教授
中華民國九十七年六月
96 碩 士 論 文 第 二 型 能 帶 結 構 硒 化 錳 鋅 / 碲 硒 化 鋅 多 重 量 子 井 之 光 學 特 性 研 究 邱 交通大學理學院 電子物理學系第二型能帶結構硒化錳鋅/碲硒化鋅多重量子井之光學特性研究
Optical characteristics of type-II Zn0.97Mn0.03Se/ZnSe1-xTex multiple quantum wells
研 究 生:邱鏡學 Student:Ching-hsueh Chiu
指導教授:周武清 教授 Advisor:Prof. Wu-ching Chou
國 立 交 通 大 學
電子物理學系
碩 士 論 文
A Thesis
Submitted to Institute of Electrophysics College of Science
National Chiao Tung University In partial Fulfillment of the Requirements
For the Degree of Master in
Electrophysics April 2008
Hsinchu, Taiwan, Republic of China
第二型能帶結構硒化錳鋅/碲硒化鋅多重量子井之光學特性研究
研究生:邱鏡學 指導教授:周武清 博士
國立交通大學電子物理學系
中文摘要
利用光激螢光量測技術來分析硒化錳鋅/碲硒化鋅(碲含量佔 8 和 20 莫耳百 分比)多重量子井之光學特性。此多重量子井是以分子束磊晶系統所成長,碲硒 化鋅層井寬分別為 2、3 和 5 奈米。隨著雷射功率強度的增加,量測到光激螢光 光譜峰值有明顯的藍位移,這是能帶彎曲效應所造成,由此可以驗證此多重量 子井是第二型能帶結構。由光激螢光變溫光譜實驗,可求得樣品的活化能。我 們也利用時間解析光譜實驗分析載子的複合機制,發現載子的生命期會隨著不 同的碲含量以及碲硒化鋅厚度而改變,這是因為電子與電洞的波函數重疊情形 受到了改變。時間解析光譜隨雷射功率強度而呈現的非單一指數曲線,也可以 用能帶彎曲模型解釋。Optical characteristics of Type-II
Zn
0.97Mn
0.03Se/ZnSe
1-xTe
xMultiple quantum wells
Student:Ching-hsueh Chiu Advisor:Dr. Wu-Ching Chou
Institute of Electrophysics National Chiao Tung University
Abstract
The Zn0.97Mn0.03Se/ZnSe1-xTex (x = 0.08 and 0.20) multiple quantum wells (MQWs)
grown by molecular beam epitaxy were studied by photoluminescence (PL) measurements. The ZnSe1-xTex well thickness varies among 2, 3, and, 5 nm. The PL
peak energy shows a giant blue-shift with excitation power due to the band-bending effect. The activation energies of the MQWs were also obtained by temperature-dependent PL measurements. We also studied the mechanism of carrier recombination by the time-resolved photoluminescence (TRPL) experiments. The dependence of PL lifetimes on the Te concentration and well width can be explained by the variation of electron-hole wavefunction overlapping. Moreover, the non-single-exponential PL decays of the power-dependent TRPL measurements can be
Acknowledgement
在交大電物所兩年的研究生活即將進入尾聲,回想這段時間以來,有歡笑、有淚 水、有高興、有失落,在這期間讓我學到不少東西及交到許多好朋友,比起大學時候 的我更成長了不少。 首先謝謝周武清教授,在我這兩年研究生涯提供充足的研究資源,不厭其煩的教 導,使我在研究和處理事情中都學到不少寶貴知識,讓再往研究之路邁進的我幫助很 大;再來要感謝奈米科技實驗室學長姐的熱心指導我,感謝彥丞、繼祖、謝博、瑞雯、 怡仁、狗哥、瑞泰,沒有你們辛苦的傳承實驗技術和方法,勢必我的研究之路不會這 麼順遂;特別感謝彥丞學長在這段期間一起研究及討論,協助我解釋實驗數據並解決 實驗困難,回想起來是我最甜美的時光,也以彥丞學長看齊,成為一位好學長;還要 感謝實驗室伙伴復凱,在研究期間一起努力打拼,希望你能賺大錢去雲南找天仙妹 妹;還有威智、俊榮兩位學弟,希望你們能和彥丞學長合作把高壓團隊壯大起來,也 期許你們未來一年的研究工作順利完成;另外要感謝中原大學同學們,奕男、政雄、 政道、雅婷,雖然大家都在各校研究所就讀,但是常常互相鼓勵對方,使我們友情常 存不變質,尤其奕男,從大學時期一起努力學業,到研究所時期常見面互相鼓勵,是 我快樂的泉源,希望能早日達成你的夢想。 最後,很感謝我的家人,有你們全力支持,讓我有用不完的動力,尤其爸爸、媽 媽,有你們提供優渥的環境和精神鼓勵,使我常常創造新記錄和開創新局,也謝謝妹 妹的鼓勵,希望你能早日實現夢想;我也期許自己:「相信自己,我一定做的到!」Index
Abstract (Chinese version).………..…...i
Abstract (English version).………..………...………..ii
Acknowledgement………...iii
Index.………...……….……...iv
Chapter 1:Introduction.……….………...……...1
Chapter 2:Experiments………...…...3
2-1 Sample preparation……...………...3
2-2 Photoluminescence (PL) system....……….………...5
2-3 Time-resolved photoluminescence (TRPL) system...6
Chapter 3:Results and discussion.………...12
3-1 Emission properties of Zn
1-xMn
xSe/ZnSe
1-yTe
yMQWs...12
3-2 Dynamics of carrier recombination………..…...15
Chapter 4:Conclusions.………...30
Chapter 1:Introduction
Wide-band-gap II-VI isoelectronic semiconductor, ZnSe1-xTex, has attracted much
attention due to their applications in blue/green light-emitter materials [1-2]. The optical properties of isoelectronic localized states have also been studied in the past decades, such as GaAsN [3], ZnSTe [4,5], and ZnSeTe [6-8]. Recently, ZnSe1-xTex alloys have
been under extensive investigation. For example, Spectacular atomic ordering has been observed in ZnSe0.5Te0.5 specimens, which self-organize to form modulated ZnSe1-xTex
superlattices [9]. In order to investigate the recombination dynamics of ZnSe1-xTex ternary
compound semiconductor, the time-resolved photoluminescence (TRPL) technique was used. It was shown that the PL decay time of bulk ZnSe is about 200 ps [10] while it is about 30 ns for ZnSe1-xTex (x = 0.12) epilayer [11]. Due to the spatial separation of
electrons and holes in a type-II quantum structure, the wavefunction overlap between electrons and holes is largely decreased. Therefore, the observed PL lifetime will be longer than that in a type-I structure. For example, the PL decay time for type-II ZnTe/ZnSe superlattice is about 100 ns [12].
In this thesis, the type-II Zn0.97Mn0.03Se/ZnSe1-xTex multiple quantum wells (MQWs)
are studied by PL and TRPL. The PL decay time are expected to be longer than the normal type-II quantum structure because of the existence of Te isoelectronic center. In chapter 2, the sample preparations of molecular-beam epitaxy (MBE) are introduced. In
addition, the optical measurements are also introduced, including photoluminescence (PL) and TRPL. In chapter 3, the experimental results about power-dependent PL, temperature-dependent PL, and carrier recombination dynamics are discussed. Finally, a brief conclusion of current work is given in chapter 4.
Chapter 2:Experiment
In this chapter, the sample growth of Zn0.97Mn0.03Se/ZnSe1-xTex MQWs and the
experimental techniques used in this thesis are described. The experimental techniques include the conventional PL, power-dependent PL and TRPL.
2.1 Sample preparation
The type-II Zn0.97Mn0.03Se/ZnSe1-xTex MQWs were grown on GaAs (001) substrates
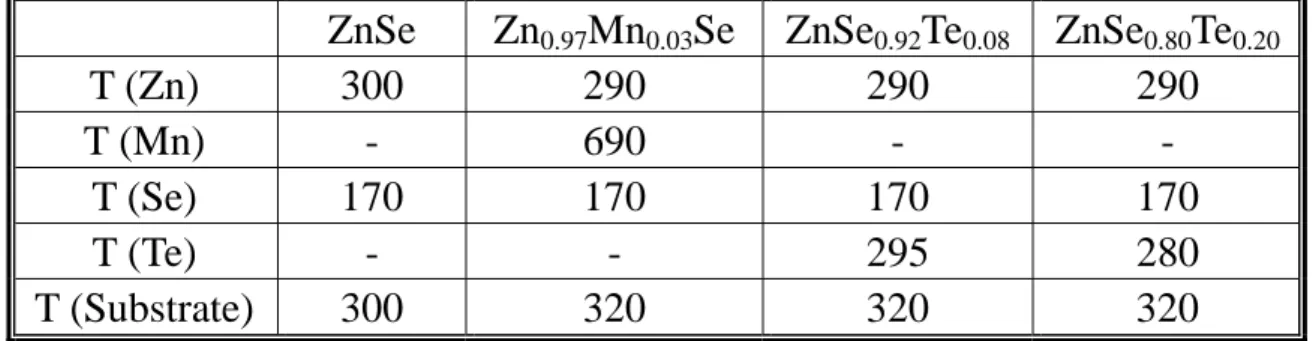
by Veeco Applied EPI 620 molecular-beam epitaxy (MBE) system. Low-temperature effusion cells were used for elemental Zn, Se, and Te sources. A standard effusion cell was used for Mn element. The growth conditions were listed in Table 2-1.
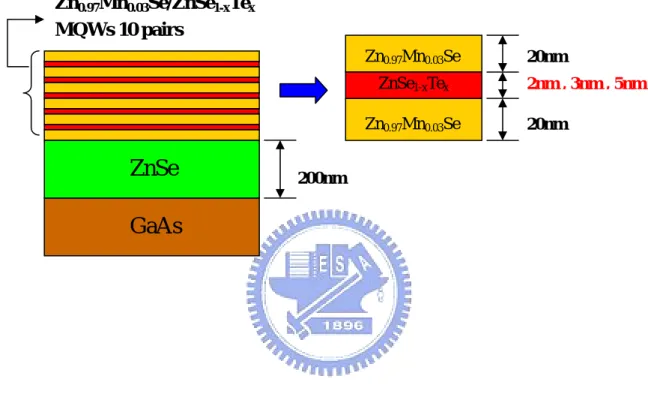
The schematic sample structure of Zn0.97Mn0.03Se/ZnSe1-xTex MQWs was shown in
Fig. 2-1. The GaAs substrate was mounted on molybdenum disk holder by Indium. After the substrate holder was loaded on the transfer rod in the introduction chamber, the oil-free mechanical diaphragm pump and then the turbo pump were turned on. When the pressure of introduction chamber is below 10-8 torr, the manual gate valve was opened and the substrate holder (molybdenum disk) was transferred to the growth chamber by the substrate transfer arm. The substrate temperature was raised up to 650 0C for removing the oxide on the GaAs substrate. The deposition procedure was monitored by the reflection high energy electron diffraction (RHEED). When clear RHEED pattern was
observed, the substrate temperature was decreased to 300 oC for the deposition of ZnSe buffer layer.
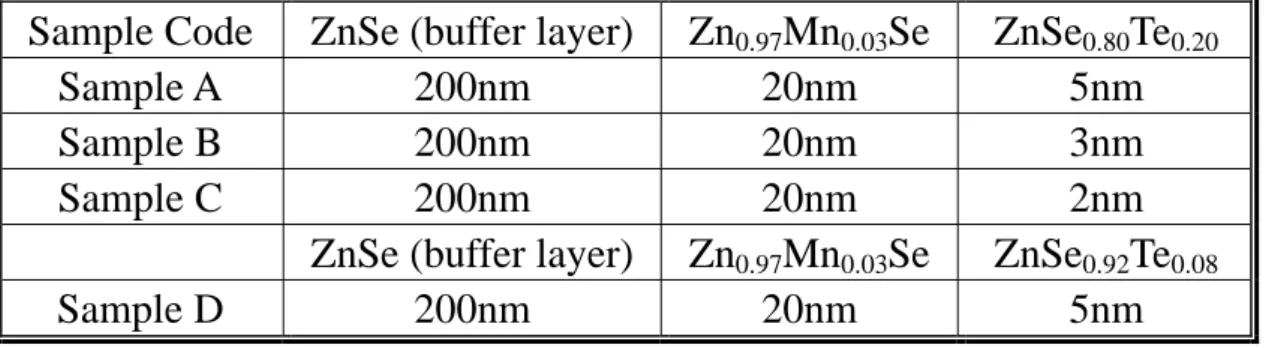
In order to decrease the lattice mismatch between GaAs and ZnMnSe layers, a ZnSe buffer layer of about 200 nm was grown before the ten periods of Zn0.97Mn0.03Se/ZnSe1-xTex (x = 0.08 and 0.20) MQWs. The Mn and Te concentration were
determined by energy-dispersive x-ray (EDX) measurement on the respective Zn0.97Mn0.03Se and ZnSe1-xTex epilayers grown with the same parameters. For the
Zn0.97Mn0.03Se/ZnSe1-xTex MQWs, the thickness of the Zn0.97Mn0.03Se layers is fixed at 20
nm while the thickness of ZnSe1-xTex layers varies from 5, 3, to, 2 nm. Finally, a
Zn0.97Mn0.03Se capping layer of about 20 nm was grown on the ZnSe1-xTex layer. The
2.2 Photoluminescence (PL) system
The schematic setup of the photoluminescence system is shown in Fig. 2-2. The samples were loaded on the cold finger of a closed cycle cryostat. The temperature can be controlled between 10 and 325 K. The sample was excited by an He-Cd 325 nm laser. The incident laser beam was focused on the sample by a convex lens (L1). The
combination of a set of convex lenses (L2 and L3) guided the luminescence into the
double-grating spectrometer. A SPEX 1403 double-grating spectrometer equipped with a thermoelectrically cooled photo-multiplier tube (R928, Hamamatsu) was used to analyze the PL spectra. The spectrometer was controlled by a computer, which was used to store and plot the collected data.
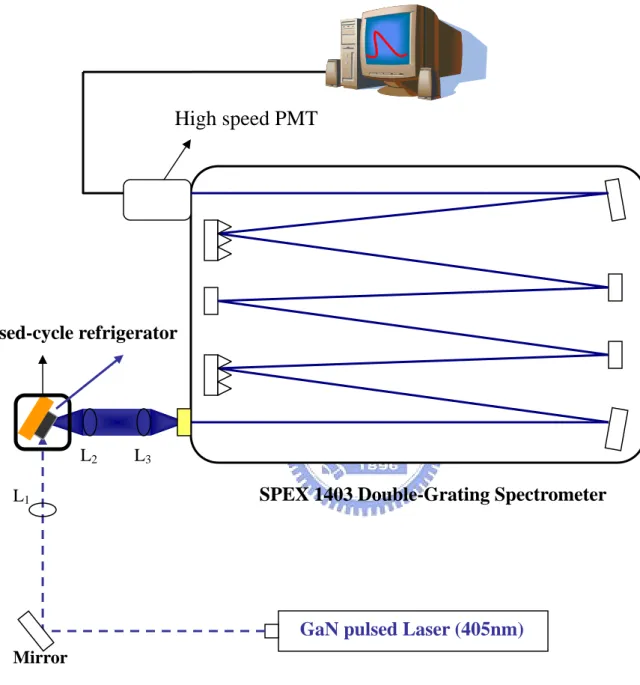
2.3 Time-resolved Photoluminescence (TRPL) system
The schematic setup of the Time-resolved photoluminescence system is shown in Fig. 2-3. The GaN pulsed laser (405 nm) with a pulse width of 50 ps and a repetition rate of 2.5 MHz was used as an excitation source. The laser light was focused on the sample by a convex lens (L1). The combination (L2 and L3) lenses guided the luminescence into
the double-grating spectrometer. The signal was dispersed by a 0.85 m double-grating spectrometer and detected by a high-speed photomutiplier tube. The signal was further analyzed by a computer plug-in time-correlated counting card. The overall temporal resolution of the time-resoved PL measurement is about 0.3 ns.
Table 2-1. Effusion cell temperature (oC) and substrate temperature (oC) for the growth of the Zn0.97Mn0.03Se/ZnSe1-xTex MQWs.
ZnSe Zn0.97Mn0.03Se ZnSe0.92Te0.08 ZnSe0.80Te0.20
T (Zn) 300 290 290 290
T (Mn) - 690 - -
T (Se) 170 170 170 170
T (Te) - - 295 280
Table 2-2. Sample parameters of the type-II Zn0.97Mn0.03Se/ZnSe1-xTex multiple
quantum wells.
Sample Code ZnSe (buffer layer) Zn0.97Mn0.03Se ZnSe0.80Te0.20
Sample A 200nm 20nm 5nm Sample B 200nm 20nm 3nm Sample C 200nm 20nm 2nm
ZnSe (buffer layer) Zn0.97Mn0.03Se ZnSe0.92Te0.08
Fig. 2-1. Sample structure of Zn0.97Mn0.03Se/ZnSe1-xTex MQWs 2nm , 3nm , 5nm 200nm
GaAs
ZnSe
ZnSe1-xTex Zn0.97Mn0.03Se Zn0.97Mn0.03Se 20nm 20nm Zn0.97Mn0.03Se/ZnSe1-xTex MQWs 10 pairsFig. 2-2. The experimentalsetup of PL measurements.
He-Cd Laser (325nm) Mirror
L1
L2 L3
SPEX 1403 Double-Grating Spectrometer Closed-cycle refrigerator
Fig. 2-3. The experimental setup of TRPL measurements.
GaN pulsed Laser (405nm)
Mirror L1
L2 L3
SPEX 1403 Double-Grating Spectrometer Closed-cycle refrigerator
Chapter 3:Results and Discussion
In this chapter, we present the interesting optical characteristics of Zn0.97Mn0.03Se/ZnSe1-xTex (x = 0.08 and 0.20)MQWs measured by the conventional and
time-resolved PL. The type-II band alignment of the Zn0.97Mn0.03Se/ZnSe1-xTex MQWs
was verified by power-dependent PL measurement. The thermal activation energy (Ea)
was determined from temperature-dependent PL spectra. The wavelength-dependent and temperature-dependent time-resolved PL measurements were used to study the carrier recombination processes and recombination kinetics of Te isoelectronic centers in the Zn0.97Mn0.03Se/ZnSe1-xTex MQWs system.
3.1 PL studies of Zn
0.97Mn
0.03Se/ZnSe
1-xTe
xMQWs
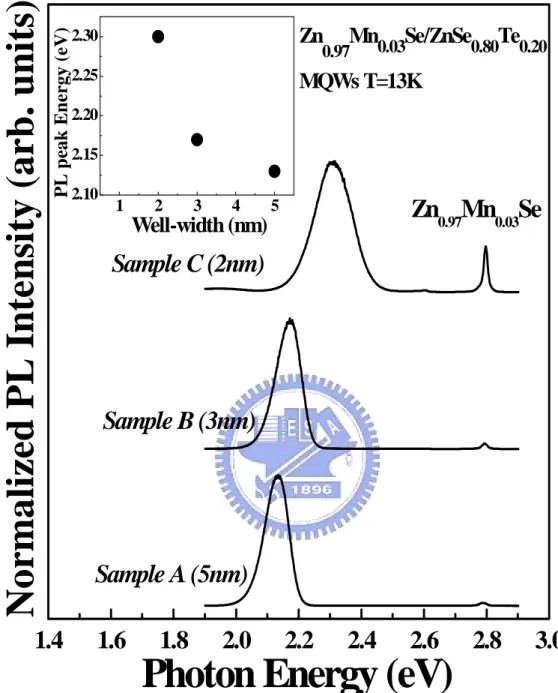
Fig. 3-1 shows the PL spectra of Zn0.97Mn0.03Se/ZnSe0.80Te0.20 MQWs with
different well thickness of ZnSe0.80Te0.20 layer at low temperature. All of the spectra
consist of two emission bands. The sharp emission peak near 2.798 eV is attributed to the near band edge transition of Zn0.97Mn0.03Se layer. The other emission, which is more
sensitive to the well thickness, is due to the recombination in MQWs. A significant blue-shift about 200 meV was observed as the Lw decrease from 5 nm to 2 nm. This can
line shape at low energy side. Due to holes are more strongly trapped by Te impurities at low energy. The broad PL line width is mainly due to inhomogeneous broadening caused by Te composition fluctuation that leads to asymmetrical PL curves. In addition the full width at half maximum (FWHM) of the PL curves increases with the decreasing of well thickness. This is due to the increasing well-width fluctuation [13-14].
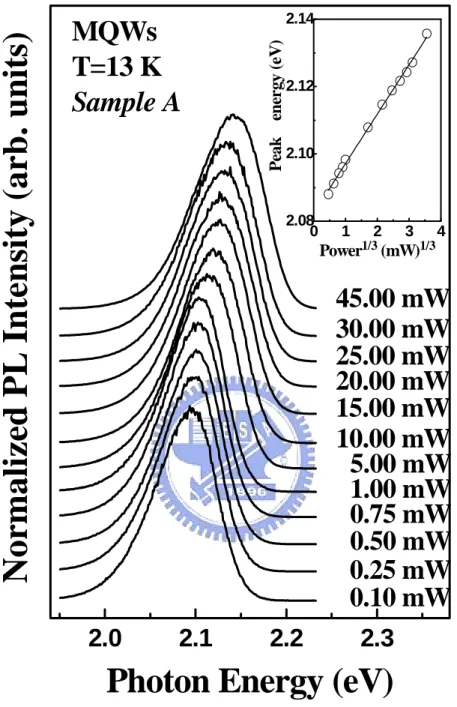
The band alignment was determined by power-dependent PL. Fig. 3-2 (Fig.3-3) presents the results for the MQW of sample A (sample C). The PL peak has a blue-shift of about 48 meV (23 meV) when the pumping intensity changes from 0.1 mW to 45.0 mW. The peak position of PL spectra shows a significant blue-shift with the increasing excitation intensity. The inset shows the blue-shift of PL peak energy as a function of the cube of excitation power. The relationship is linear. This phenomenon is usually interpreted as the results of band-bending effect in type-II quantum structures [15-17]. The band-bending effect is caused by the spatially separated photo-excited carriers, in which electrons are confined in the ZnMnSe layers and holes are confined in the ZnSeTe layers. The electron-hole pairs are attracted through the Coulomb interaction. This leads to the bending of the valence and conduction band. The quantization energy was found to increase proportionally with the cube root of the excitation power. The type-II band alignment of Zn0.97Mn0.03Se/ZnSe1-xTex MQWs system was schematically
)
exp(
1
)
(
0T
k
E
A
I
T
I
B a−
+
=
accumulated holes trapped by Te isoelectronic impurities and electrons near the interface. The emission energy of the PL peak is smaller than the band gap of ZnMnSe and ZnSeTe.
The temperature-dependent PL spectra of sample A are shown in Fig. 3-5. The intensity gradually decreases as the temperature is increased from 13 to 300 K. Fig. 3-6 shows the variation of the integrated PL intensity as a function of the reciprocal temperature of sample A. The temperature-dependence of the integrated PL intensity (IPL) could be expressed as
where I0 is the integrated PL intensity at 0 K, T is the temperature, A is fitting constant,
and kB = 8.62×10⁻⁵ (eV.K-1) is the Boltzmann constant. We have fitted our data using
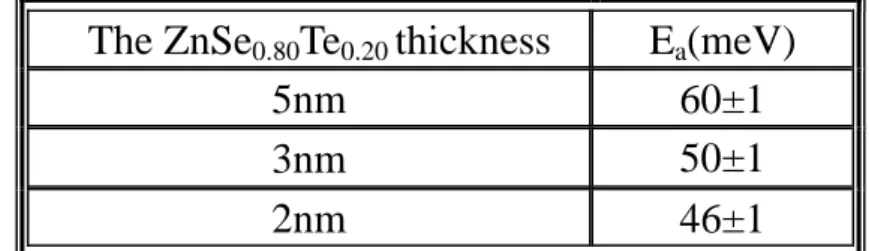
Eq. (1). The results of fitting are given in Table 3-1 and show that the Ea value is in the
range of 60 - 46 meV for different quantum well thickness. Quenching of the luminescence with increasing temperature can be explained by thermal activation of carriers out of a confining potential [18-19].
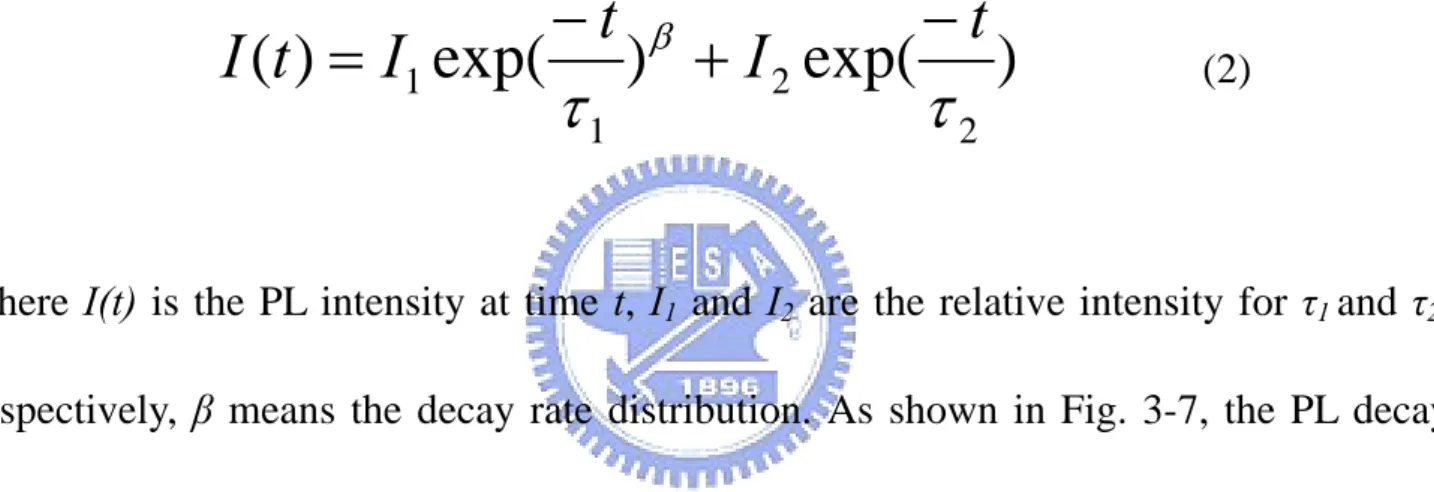
)
exp(
)
exp(
)
(
2 2 1 1τ
τ
βI
t
t
I
t
I
=
−
+
−
3.2 TRPL studies of Zn
0.97Mn
0.03Se/ZnSe
1-xTe
xMQWs
In order to understand the carrier recombination mechanism of the type-II MQWs, TRPL measurements are studied. Fig.3-7 displays the spectral distribution of τPL of the
Zn0.97Mn0.03Se/ZnSe1-xTex MQWs (x=0.08 and 0.20). The decay time is composed of a
faster initial component and a slower tail component. In order to resolve the time constant, all of the experimental data were fitted by a biexponential function described by
where I(t) is the PL intensity at time t, I1 and I2 are the relative intensity for τ1 and τ2,
respectively, β means the decay rate distribution. As shown in Fig. 3-7, the PL decay times decrease with the increasing detection energy. The samples of higher Te concentration exhibit longer PL decay times. Because when the Te concentration is increased, the holes are trapped by more Te-clusters, leading to less electron-hole wavefunction overlap. In addition, the τPL decreases with decreasing well thickness. It is
due to the stronger electron-hole wavefunction overlap with the decreasing well width. Fig. 3-8 (a) displays the PL spectrum of sample A at 13K. The PL decay times of sample A at various detection energies are shown in the Fig. 3-8 (b). The same behavior is also observed in other samples discussed herein. The PL decay curves are well-fitted
by equation (2). The decay time monotonically decreases with the increasing of detection energies. It is attributed to the stronger trapping of holes by the Te-clusters. It results in the suppression of electron-hole wavefunction overlap in low energy. Such a non-exponential decay is attributed to the band bending effect [20-21]. After the photoexcitation, a dipole layer is formed between the holes in the ZnSe1-xTex layer and
electrons attracted in the surrounding Zn0.97Mn0.03Se. It builds up an electric field in
type-II MQWs, which in turn gives rise to the bending of valence and conduction band. It further changes the overlapping of the electron and hole wave function. The faster initial decay time is attributed to the increasing spatial overlap due to the band-bending effect. After most of carriers recombined, the electron-hole wavefunction overlap decreases and the band become un-bended as shown in Fig. 3-9 (a) and (b).
To further support our investigations, we perform the power-dependent time-resolved PL measurements shown in Fig.3-10. The PL decay time is multi-exponential at high excitation intensities and it approaches a single exponential under lower excitation energy. The band bending effect depends strongly on the photo-excited carrier concentration. The initial fast decay time results from the higher carrier concentration caused by higher excitation intensity.
Fig. 3-11 shows the spectral distribution of PL decay time at different temperatures. The decay time monotonically decreases with the increasing of detection energies. The
sharp drop of decay times are much more pronounced at low temperature (13K). It is because the holes are strongly trapped by Te-clusters at 13 K. It leads to the decrease of electron-hole wavefunction overlap. At high temperature, the holes are less trapped by Te-clusters, then the electron-hole wavefunction overlap increases. Therefore, it manifests that the Te isoelectronic centers play an important role in the recombination dynamics of Zn0.97Mn0.03Se/ZnSe1-xTex MQWs.
Table 3-1. Activation energy of the Zn0.97Mn0.03Se/ZnSe0.80Te0.20 MQWs.
The ZnSe0.80Te0.20 thickness Ea(meV)
5nm 60±1
3nm 50±1
Fig. 3-1. Normalized PL spectra of Zn0.97Mn0.03Se/ZnSe0.80Te0.20 MQWs with
different ZnSe0.80Te0.20 layer thickness at 13 K. The inset shows the
measured PL peak energies as a function of the well width.
1 2 3 4 5 2.10 2.15 2.20 2.25 2.30
1.4
1.6
1.8
2.0
2.2
2.4
2.6
2.8
3.0
Photon Energy (eV)
Sample A (5nm)
Sample B (3nm)
Sample C (2nm)
Zn
0.97Mn
0.03Se
Zn 0.97Mn0.03Se/ZnSe0.80Te0.20 MQWs T=13K PL p eak E n e rgy (eV) Well-width (nm)N
o
rmalized
PL I
n
ten
sity (arb
. u
n
its
)
Fig. 3-2. PL spectra of Zn0.97Mn0.03Se/ZnSe0.80Te0.20MQWs (sample A) under
different excitation intensities at 13 K. The inset shows the measured PL energy (open circles) versus the cubic root of excitation power.
2.0
2.1
2.2
2.3
0 1 2 3 4 2.08 2.10 2.12 2.14 P ea k e n er g y ( eV ) Power1/3 (mW)1/330.00 mW
25.00 mW
45.00 mW
20.00 mW
15.00 mW
0.25 mW
1.00 mW
0.75 mW
0.50 mW
10.00 mW
5.00 mW
0.10 mW
MQWs
T=13 K
Sample A
Normalized
PL Inten
sity (arb. un
it
s)
Fig. 3-3. PL spectra of Zn0.97Mn0.03Se/ZnSe0.80Te0.20MQWs (sample C) under
different excitation intensities at 13 K. The inset shows the measured PL energy (open circles) versus the cubic root of excitation power.
0 1 2 3 4 2.28 2.29 2.30 2.31
2.2
2.3
2.4
2.5
Pe ak e n er gy (e V ) Power1/3 (mW)1/3MQWs
T=13 K
Sample C
Nor
m
alize
d
PL Inte
nsity (
a
rb
. units)
0.10 mW
0.25 mW
0.50 mW
0.75 mW
1.00 mW
5.00 mW
10.00 mW
15.00 mW
20.00 mW
25.00 mW
30.00 mW
45.00 mW
Fig. 3-4. Schematic diagram of type-II band alignment for Zn0.97Mn0.03Se/ZnSe1-xTex MQWs. Zn0.97Mn0.03Se Zn0.97Mn0.03Se Zn0.97Mn0.03Se ZnSe1-xTex
CB
VB
Te
Eg=2.49(eV) Eg=2.798(eV) PL ZnSe1-xTexFig. 3-5. Temperature-dependent PL spectra of sample A.
1.9
2.0
2.1
2.2
2.3
x60
x50
x50
x35
x12
x4
x3
13K
PL Intensity
(a
rb. units)
Photon Energy (eV)
Zn
0.97Mn
0.03Se/ZnSe
0.80Te
0.20MQWs
300K
260K
200K
160K
120K
80K
60K
40K
Sample A
x2.5
Fig. 3-6. Arrhenius plot of the integrated PL intensity, fitted by using Eq. (1) with sample A. 0.00 0.02 0.04 0.06 0.08
Intensi
ty (a
rb. uni
ts.)
Temperature (1/K)
Sample A
Fig. 3-7. The spectral distributions of the decay times for the Zn0.97Mn0.03Se/ZnSe1-xTex (x=0.08 and 0.20) MQWs.
0
1
2
3
4
1.8
0
2.0
2.2
2.4
2.6
150
300
450
600
750
Sample D
Sample C
Sample B
Zn
0.97Mn
0.03Se/ZnSe
1-xTe
xMQWs
T=13K
PL Intensity (a.u.)
Sample A
Sample A (x=20%) Sample D (x=8%) Sample B (x=20%) Sample C (x=20%)
D
ecay Time (n
s)
(a) (b) Fig. 3-8. (a) PL spectrum of sample A at 13 K.
(b) The spectral distribution of PL decay time of sample A at 13 K.
0
100 200 300 400 500
1.9
2.0
2.1
2.2
PL Inte
nsi
ty (ar
b
. uni
ts)
MQWs
Sample A
T=13K
2.09 eV
2.04 eV
2.05 eV
2.12 eV
2.13 eV
2.15 eV
2.00 eV
Time (ns)
Photon Energy (eV)
(a)
(b)
Fig. 3-9. Schematic representations for the electron and hole wave function distribution for (a) strong band-bending effect (b) weak band-bending effect.
Fig. 3-10. The TRPL spectra of sample A recorded at different excitation intensities.
0 100 200 300
PL Peak Intensity (a. u.)
Time (ns)
T=13K Sample A
0.01 mW 0.03 mW 0.30 mWDeteced at 2.09 eV
Fig. 3-11. The PL spectra and PL decay times of Zn0.97Mn0.03Se/ZnSe0.80Te0.20
MQWs for sample A in different temperature.
0
1
2
3
1.9
2.0
2.1
2.2
2.3
0
150
300
450
600
750
Dec
ay T
ime
(ns)
PL I
n
tensi
ty (a. u.)
Photon Energy (eV)
60 K
100 K
13 K
Zn
0.97Mn
0.03Se/ZnSe
0.80Te
0.20MQWs
13 K
60 K
100 K
Sample A
Chapter 4:Conclusions
In summary, we have studied the optical properties of Zn0.97Mn0.03Se/ZnSe1-xTex (x
= 0.08 and 0.20) MQWs structures by using PL and TRPL measurements. The quantum confinement effect is confirmed by the energy shift of the PL peak energy. From excitation power-dependent PL, a type-II band alignment of the Zn0.97Mn0.03Se/ZnSe1-xTex MQWs is verified. The activation energies of the samples are
about 46、50 and 60meV.
In addition, the long PL decay times from different well width and Te concentration is well-explained by wavefunction overlap. It indicates that the Te isoeletronic center plays an important role in the carrier recombination. The decay time is composed of a slower tail and a faster initial decay due to the band-bending effect. The results are supported by power-dependent TRPL measurements.
References
[1] G. F. Neumark, R. M. Park, and J. M. Depuydt, Phys. Today 47(6), 29 (1994) [2] D. B. Eason, Z. Yu, W. C. Hughes, W. H. Roland, C. Boney, J. W. Cook,
Jr.,J. F. Schetzina,G. Cantwell and W. C. Harsch, Appl. Phys. Lett. 66, 115 (1995). [3] X. D. Luo, J. S. Huang, Z. Y. Xu, C. L. Yang, J. Liu, W. K. Ge, Y. Zhang, A.
Mascarenhas, H. P. Xin, and C. W. Tu, Appl. Phys. Lett. 82, 1697 (2003)
[4] X. D. Yang, Z. Y. Xu, Z. Sun, Y. Ji, B. Q. Sun, I. K. Sou, and W. K. Ge, Appl. Phys. Lett. 86, 162108 (2005)
[5] M. C.-K. Cheung A. N. Cartwright, I. R. Sellers B. D. McCombe, and I.L. Kuskovsky, Appl. Phys. Lett. 92, 032106 (2008)
[6] Qiang Fu, D. Lee, A.V. Nurmiko, L. A. Kolodziejski, and R. L. Gunshor, Phys. Rev. B 39, 3173 (1989)
[7] C. S. Yang, D. Y. Hong, C. Y. Lin, W. C. Chou, C. S. Ro, W. Y. Uen, W. H. Lan, and S. L. Tu, J. Appl. Phys. 83, 2555 (1998)
[8] A. P. Jacob, Q. X. Zhao, M. Willander, C. S. Yang, and W. C. Chou, J. Appl. Phys. 94, 2337 (2003)
[9]S. P. Ahrenkiel, S. H. Xin, P. M. Reimer, J. J. Berry, H. Luo, M. Bode, M. Al-Jassim, J. R. Buschert, and J. K. Furdyna, Phys. Rev. Lett. 75, 1586 (1995)
[10] Jia Zhen Zheng, J. W. Allen, D. E. Spence, W. E. Sleat, and W. Sibbett, Appl. Phys. Lett. 62, 63 (1992)
[11] A. Reznitsky, S. Permogorov, S. Verbin, A. Naumov, Yu. Korostelin, V. Novozhilov, and S. Prokov’ev, Solid State Comm. 52, 13 (1984)
[12] K. Suzuki, U. Neukirch, J. Gutowski, N. Takojima, T. Sawada, and K. Imai, J. Cryst. Growth 184/185, 882 (1998)
[13] S. D. Baranovskii, U. Doerr, P. Thomas, A. Naumov, and W. Gebhardt, Phys. Rev. B 48, 17149(1993)
[14] M. J. Ludowise, D. Biswas and P. K. Bhattacharya, Appl. Phys. Lett. 56, 958 (1990)
[15] C. M. Lin, and Y. F. Chen, Appl. Phys. Lett. 85, 2544 (2004)
[16] N. N. Ledentsov, J. Bohrer, M. Beer, F. Heinrichsdorff, M. Grundmann, D. Bimberg, S. V. Ivanov, B. Ya. Meltser, S. V. Shaposhnikov, I. N. Yassievich, N. N. Faleev, P. S. Kop’ev, and Zh. I. Alferov, Phys. Rev. B 52, 14058 (1995)
[17] Y. S. Chiu, M. H. Ya, W. S. Su, and Y. F. Chen, J. Appl. Phys. 92, 5810 (2002) [18] E. Tournie´, C. Morhain, M. Leroux, C. Ongaretto, and J. P. Faurie, Appl. Phys.
Lett. 68, 1543 (1996)
[19] J. T. Ku, M. C. Kuo, J. L. Shen, K. C. Chiu, T. H. Yang, G. L. Luo, C. Y. Chang, Y. C. Lin, C. P. Fu, D. S. Chuu, and W. C. Chou J. Appl. Phys. 99, 063506 (2006)
[20] C.-K. Sun, G. Wang, J. E. Bowers, B. Brar, H.-R. Blank, H, Kroemer, and M. H. Pilkuhn, Appl. Phys. Lett. 68, 1543 (1996)
[21] Y. Gu, Igor L. Kuskovsky, M. van der Voort, G. F. Neumark, X. Zhou, and M. C. Tamargo, Phys. Rev. B 71, 045340 (2005)